·4 min read
Daily versus monthly maximum drawdown: the missing path inside the month
Same funds, same year, different worst case: what sampling frequency does to a maximum drawdown, recomputed from our own price data.
Read more →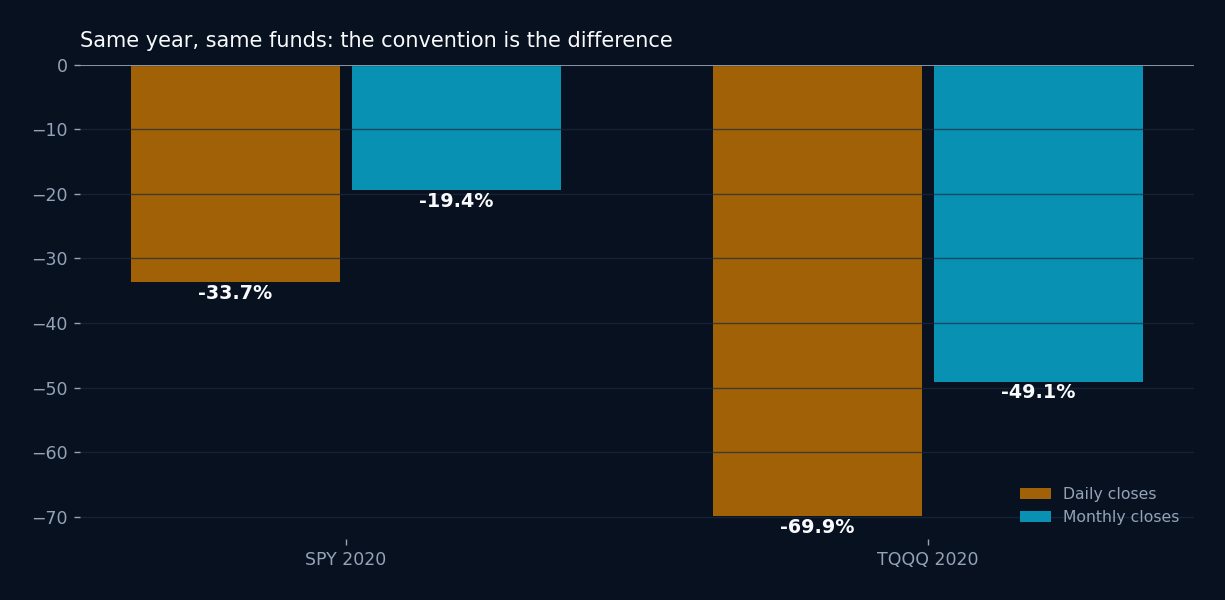
Tactical asset allocation insights, strategy deep dives, and platform updates.
Same funds, same year, different worst case: what sampling frequency does to a maximum drawdown, recomputed from our own price data.
Read more →Similar volatility, different bargains: 3 absolute trend gates against 1 relative gold-bond rule.
Read more →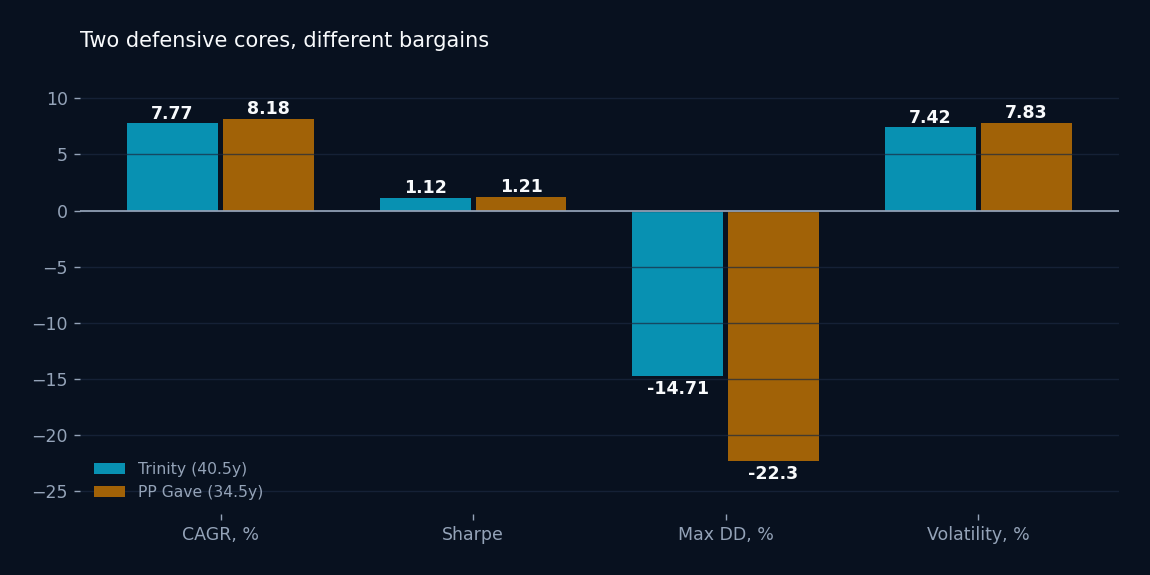
A matched 40.5-year comparison shows how an asset-class trend filter and a concentrated sector ranker create very different drawdowns.
Read more →
A catalog audit shows orderly median risk differences across conservative, moderate, and aggressive labels, while exposing how much dispersion a single word can hide.
Read more →
How GPM scores 13 assets, scales its defense with breadth, and why the all-cash cliff at 6 is the feature to understand.
Read more →
A volatility-scaled buffer gave a 200-day TQQQ gate room in calm markets and tightened the exit when turbulence was already high.
Read more →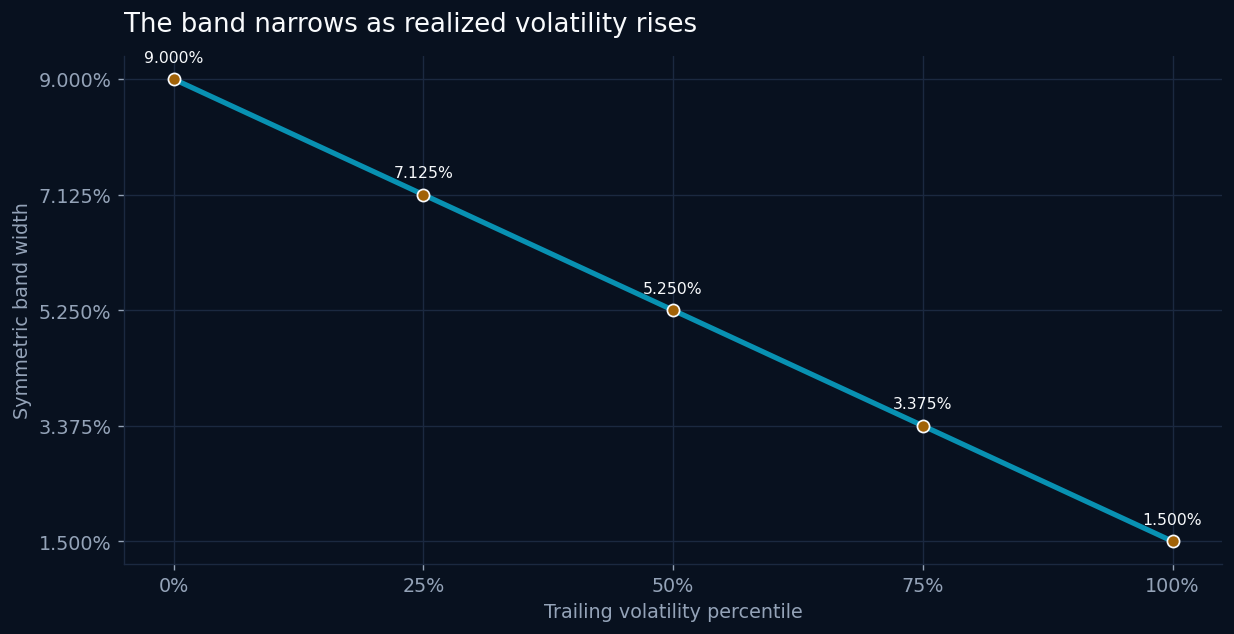
A community-built leveraged portfolio with 2 trend gates: what they fix, what they cost, and the years that hurt.
Read more →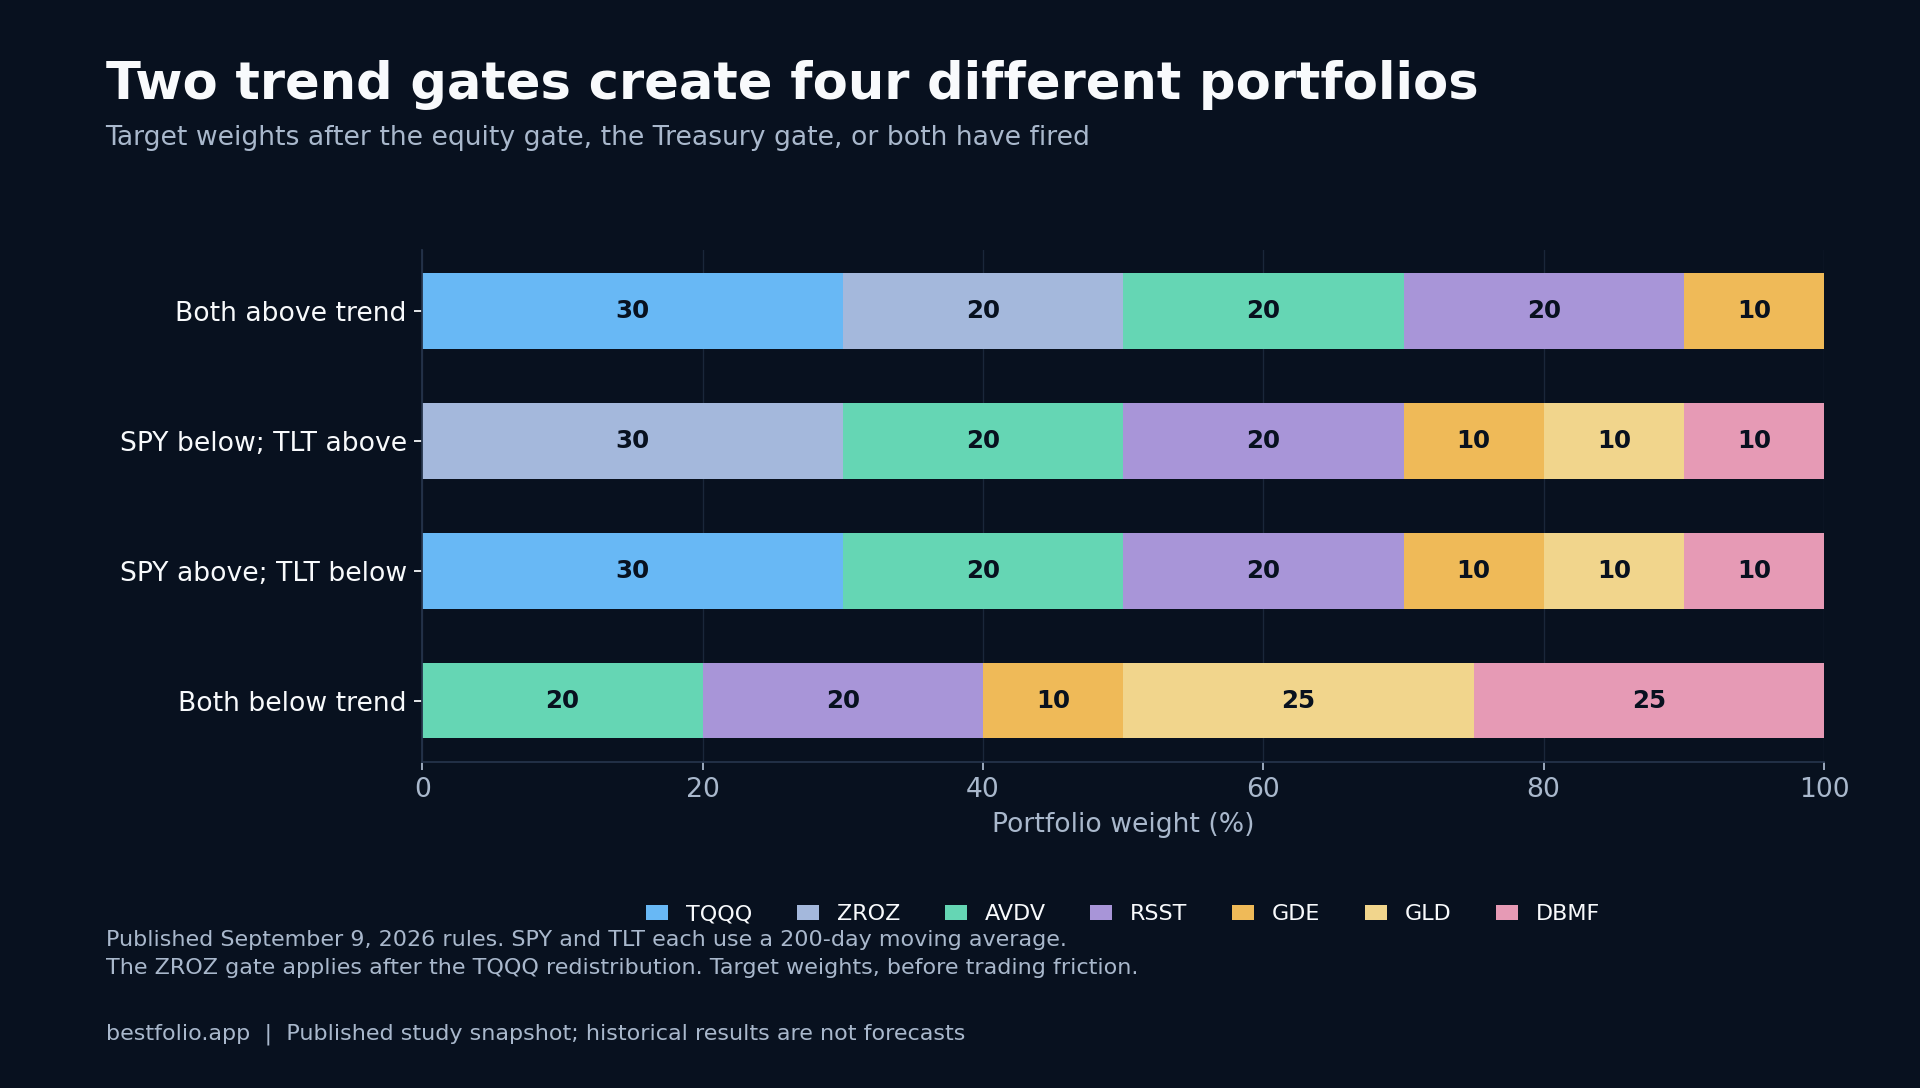
A matched 52-year comparison finds that HAA's 2x variant beat 3x on CAGR, Sharpe, Sortino, and drawdown while using the same signals and turnover.
Read more →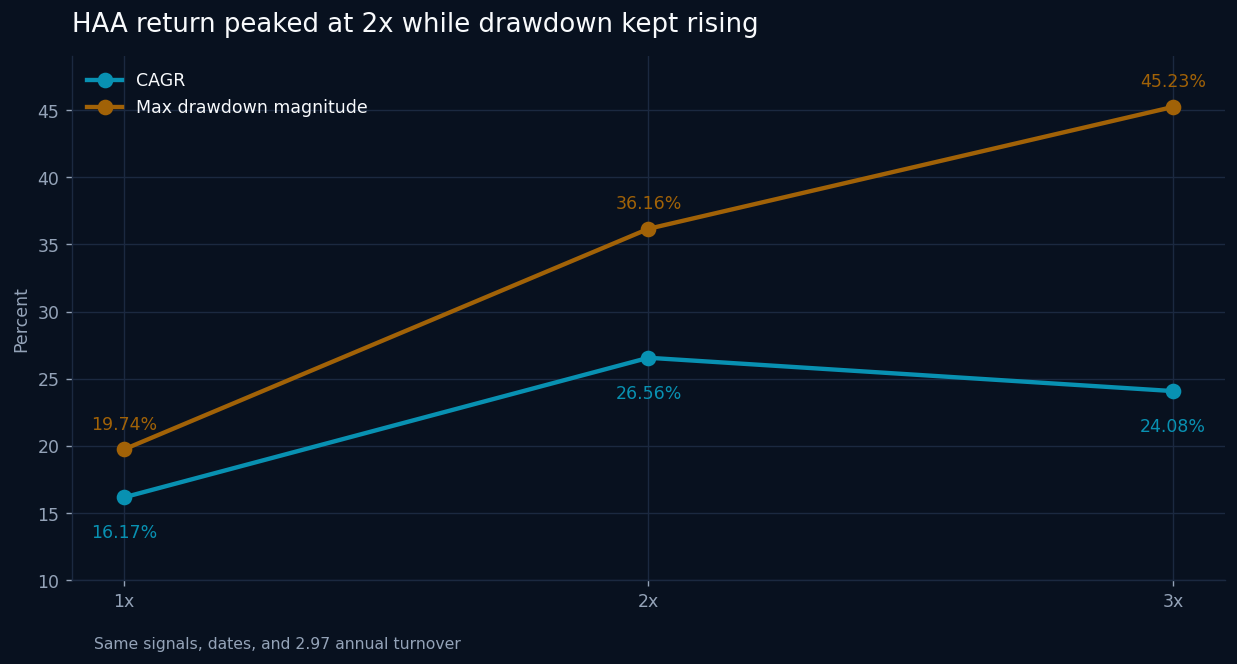
A reader called our flagship an overfitting masterpiece. So we ran the tests that could convict it: 700 parameter configurations, a deliberate cherry-pick, 60 random universes, and a post-publication study of 63 strategies. Our published settings ranked 2nd of 700, the pre-2019 ranking predicted nothing about what followed, and the decay evidence leans one way without proving it.
Read more →
VEA's return history stays fixed while its beta, size loading, and explained variance move sharply under US and developed-market factor sets.
Read more →
A year-by-year reproduction shows why a TIPS signal helped in rate shocks, stayed silent in 2008 and 2020, and barely changed the deepest drawdown.
Read more →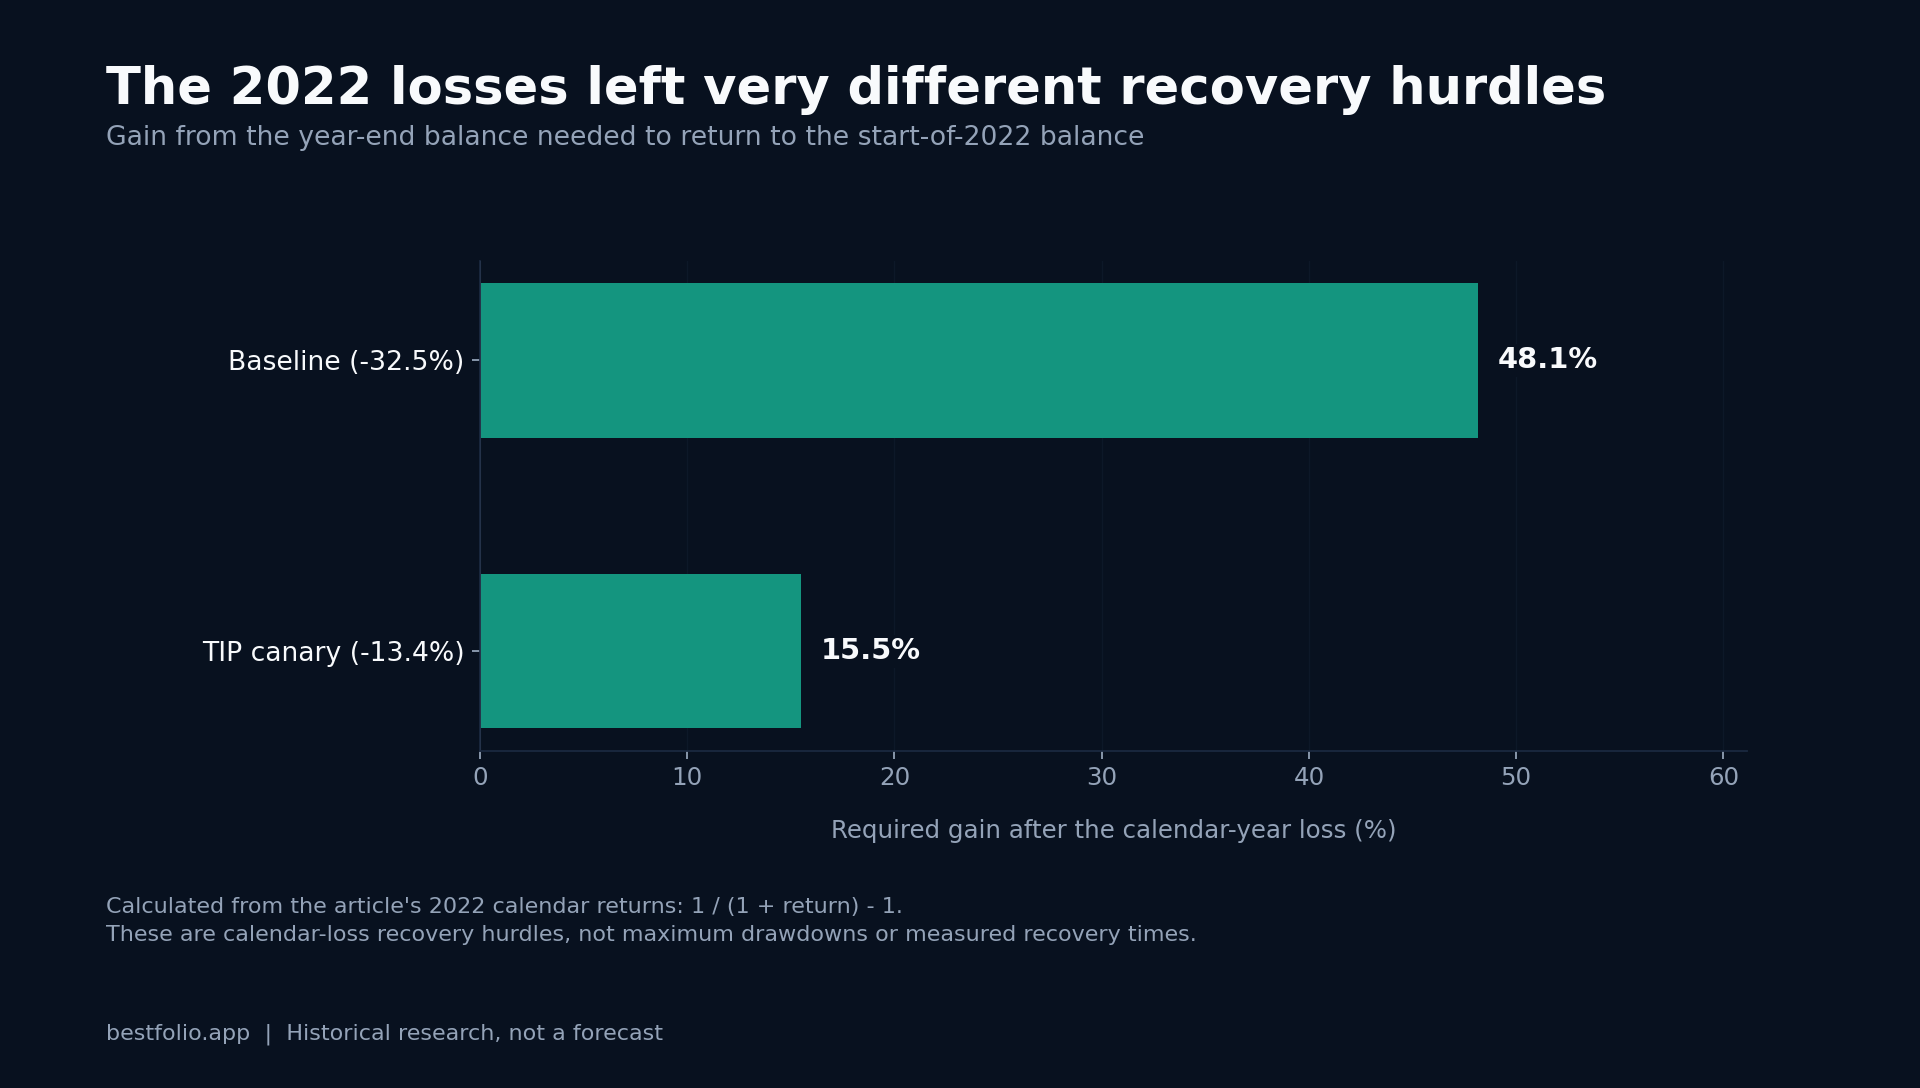
75.5 reconstructed years, a 4-branch macro rule, and why the proxy chain deserves as much scrutiny as the 16.88% CAGR.
Read more →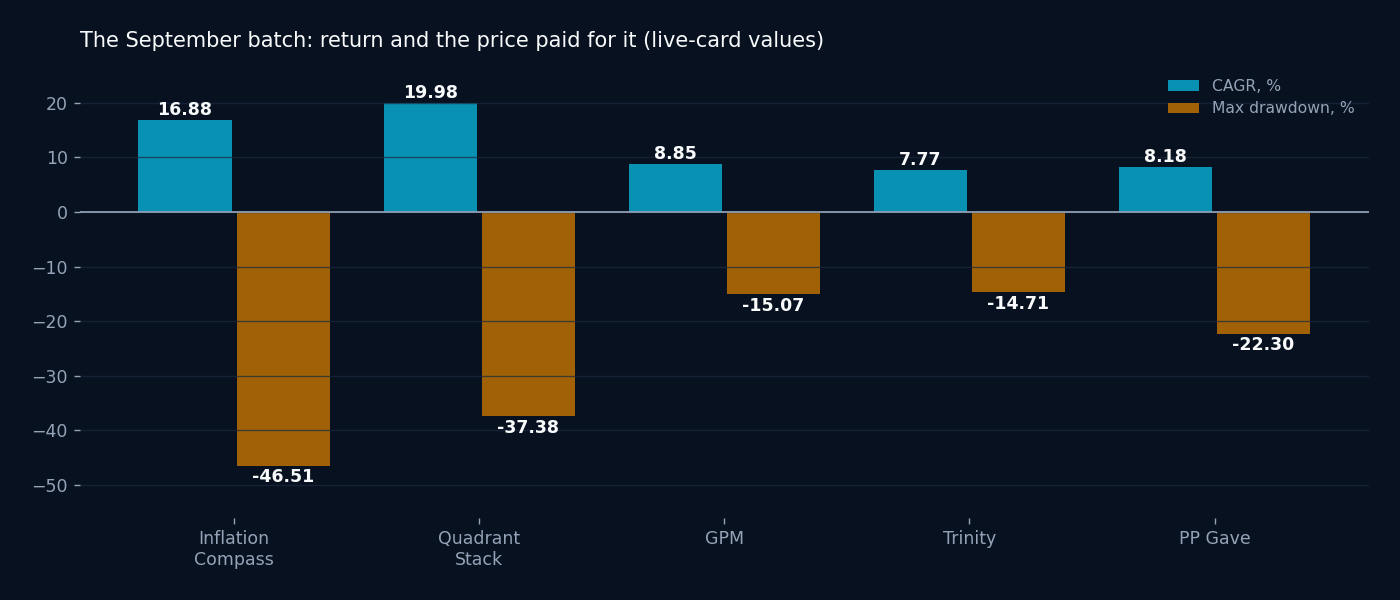
The strategy I'd show you first: a perfect 1.0 robustness score, a 1.24 Sharpe held for 38.8 years, crashes it sidestepped, and a just-shipped 1.5x version that turns $10,000 into $7.66M instead of $1.97M. Only 5% of members hold it.
Read more →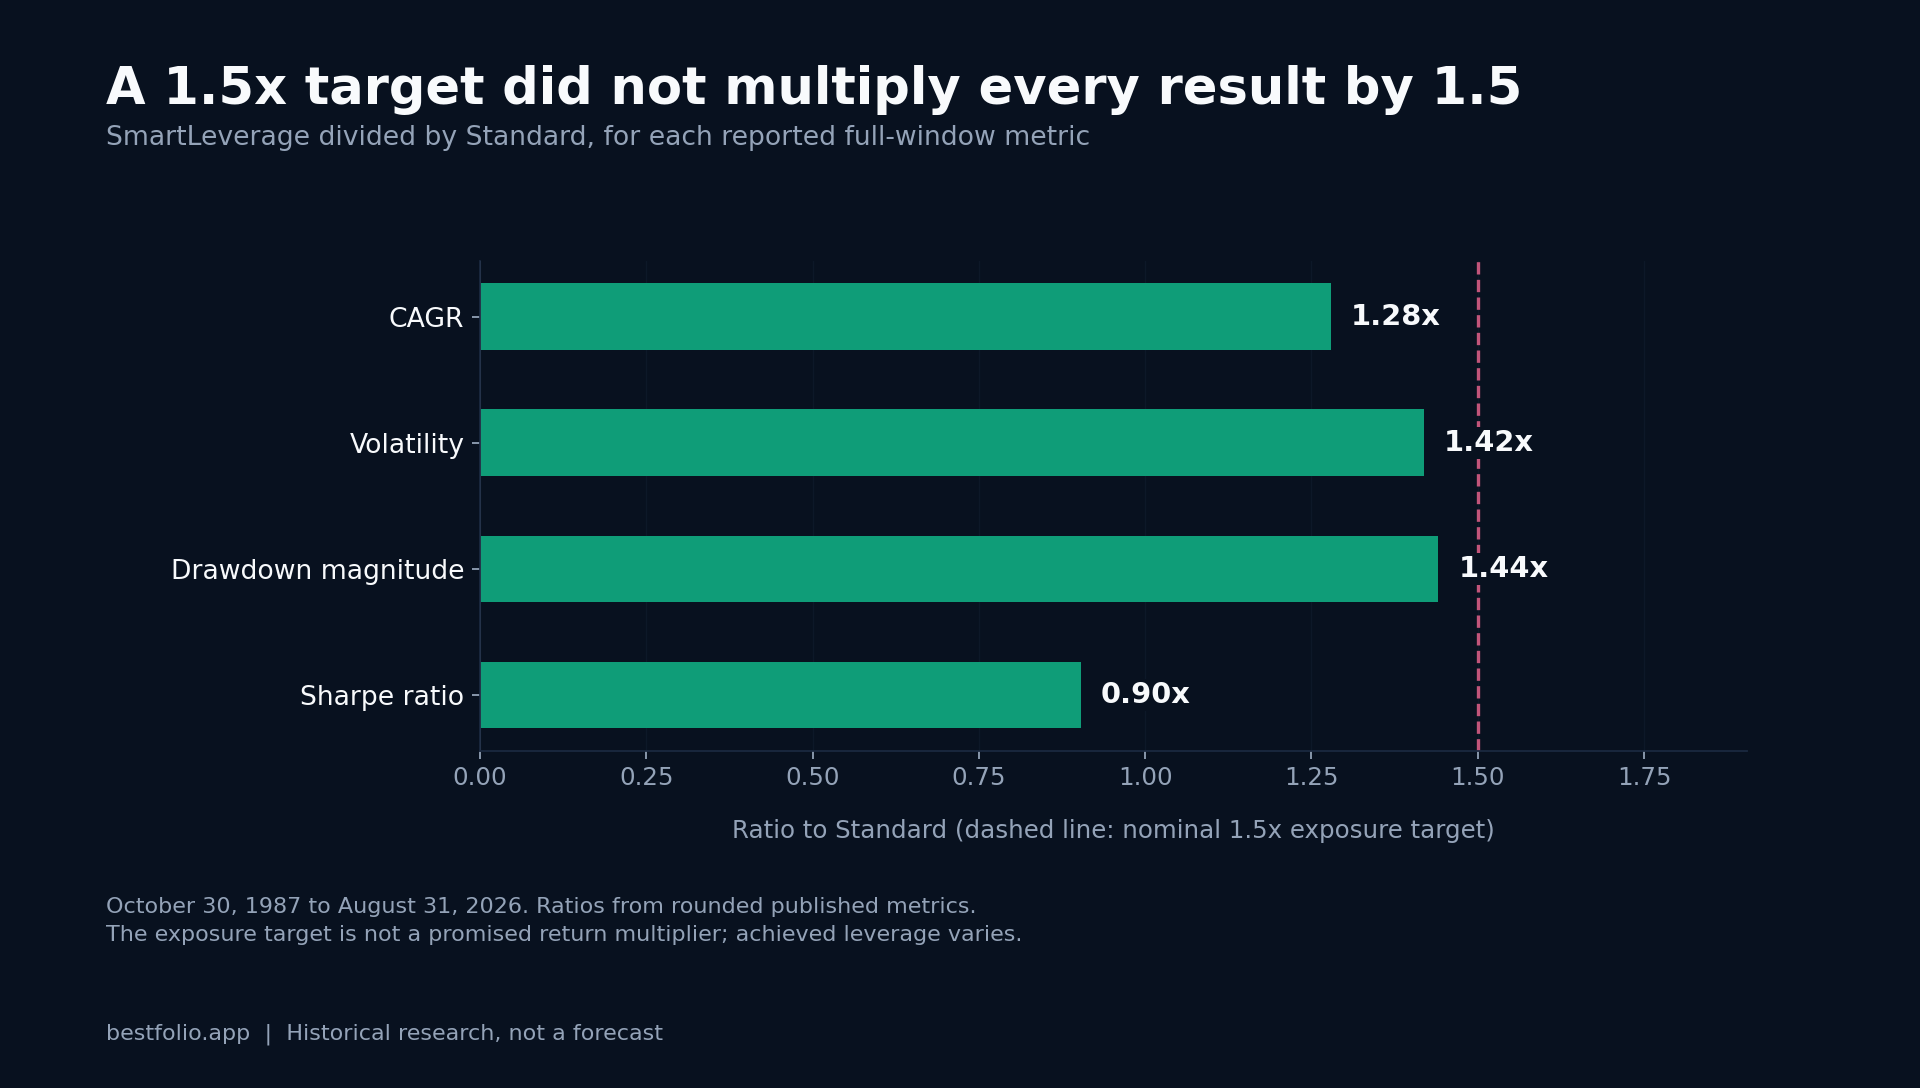
Member portfolios and the deflated Sharpe leaderboard rank the same 175 variants almost independently: the correlation is 0.156, one popular pick sits far below our fragility cutoff, and 4 perfect scorers have no holders at all.
Read more →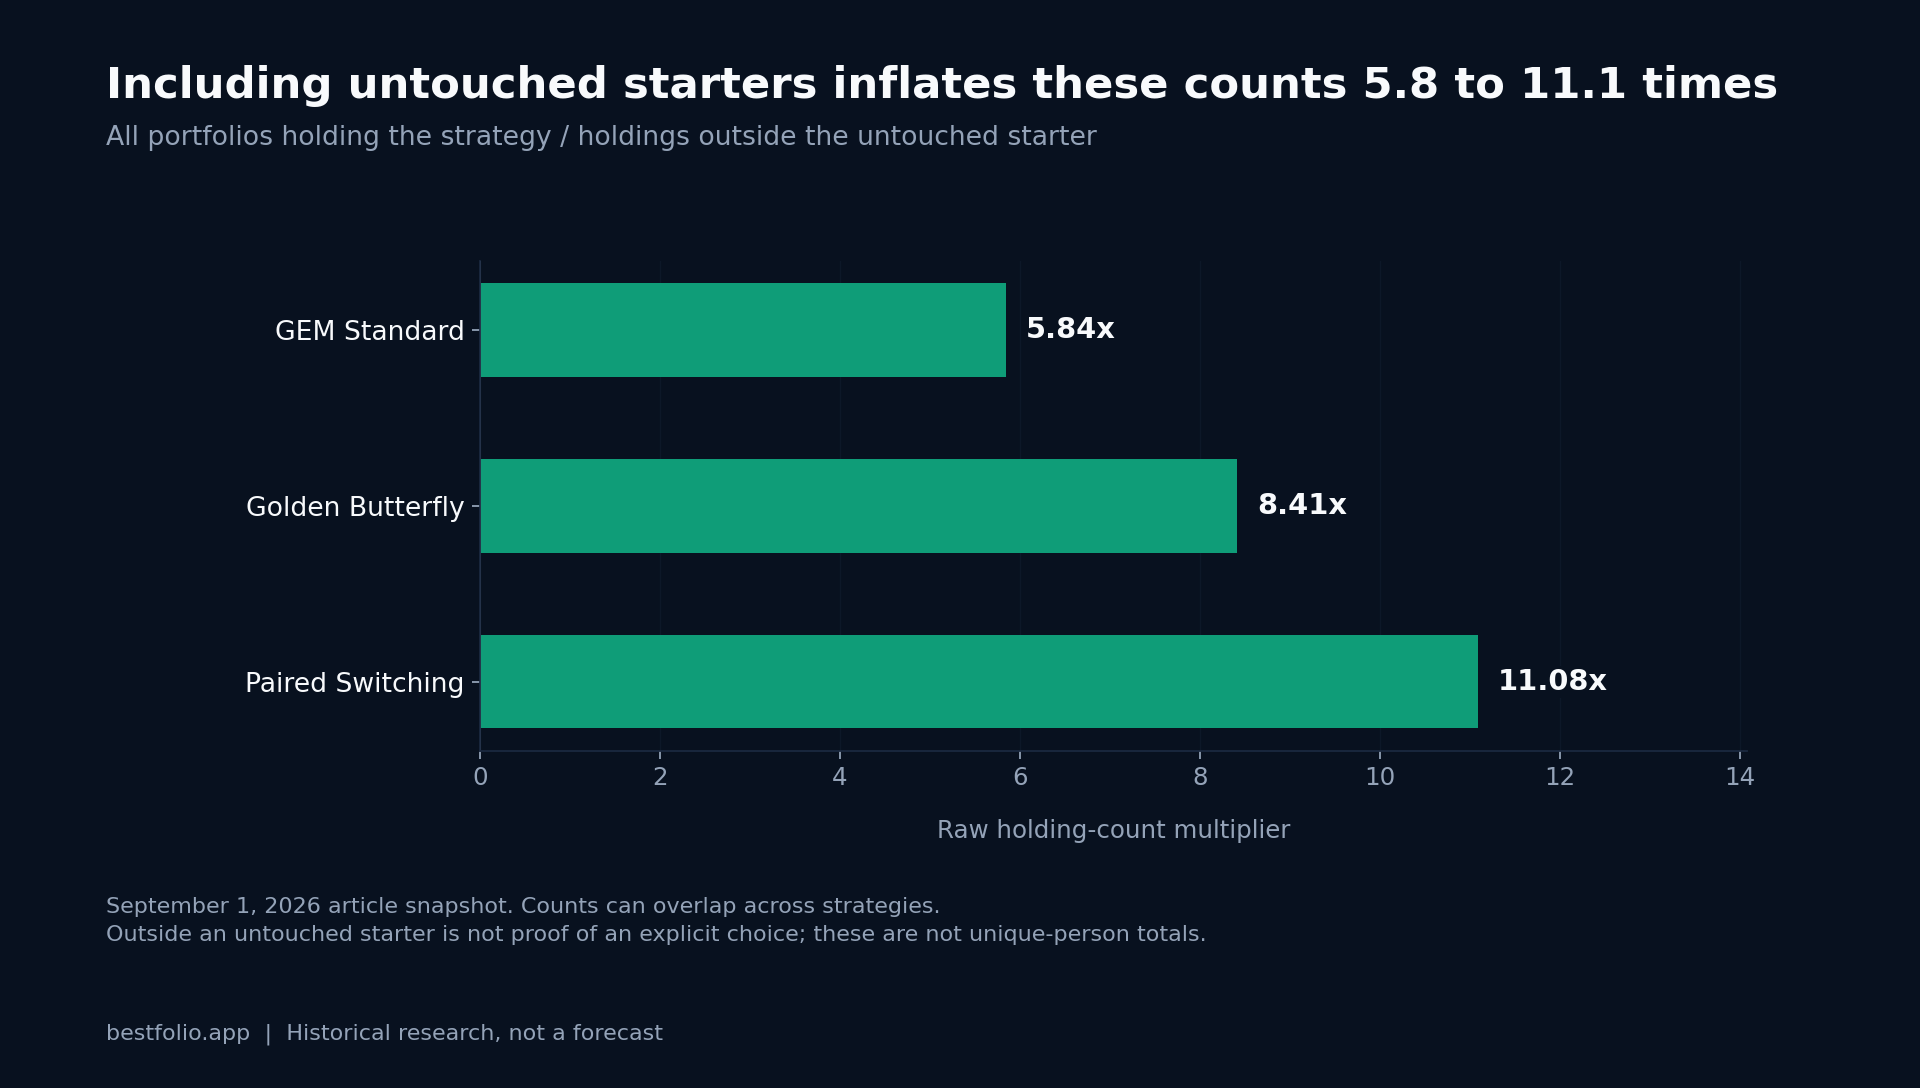
Our 3 tracked model portfolios lead the post: the conservative blend did +1.4% in August 2026 (+3.4% YTD). Then the full board of 93 published TAA strategies, with the month, year-to-date and 1-year return side by side, because the long view is the one that counts. YTD leaders, the leveraged corner, and the month's best and worst.
Read more →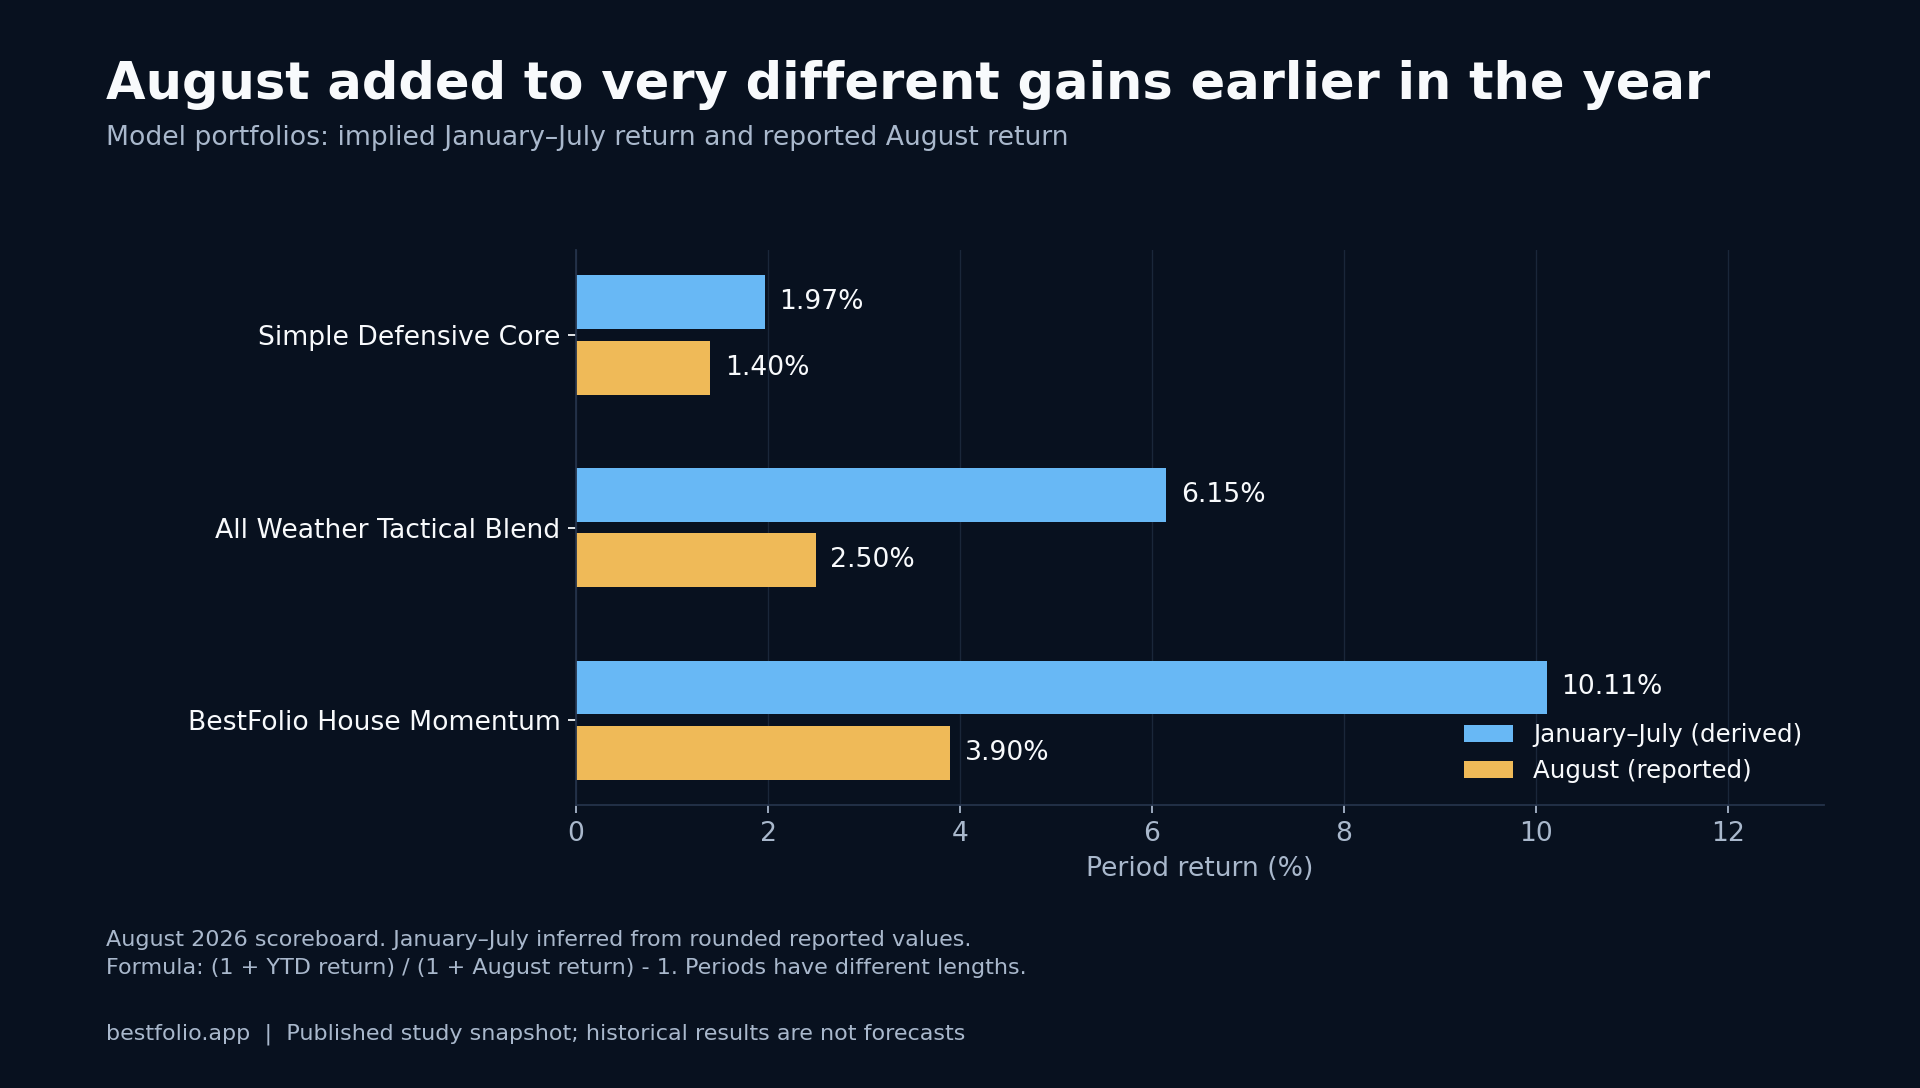
Recorded inflation changed five century-scale withdrawal backtests and moved four binding retirement starts. Corrected figures, methodology and limitations.
Read more →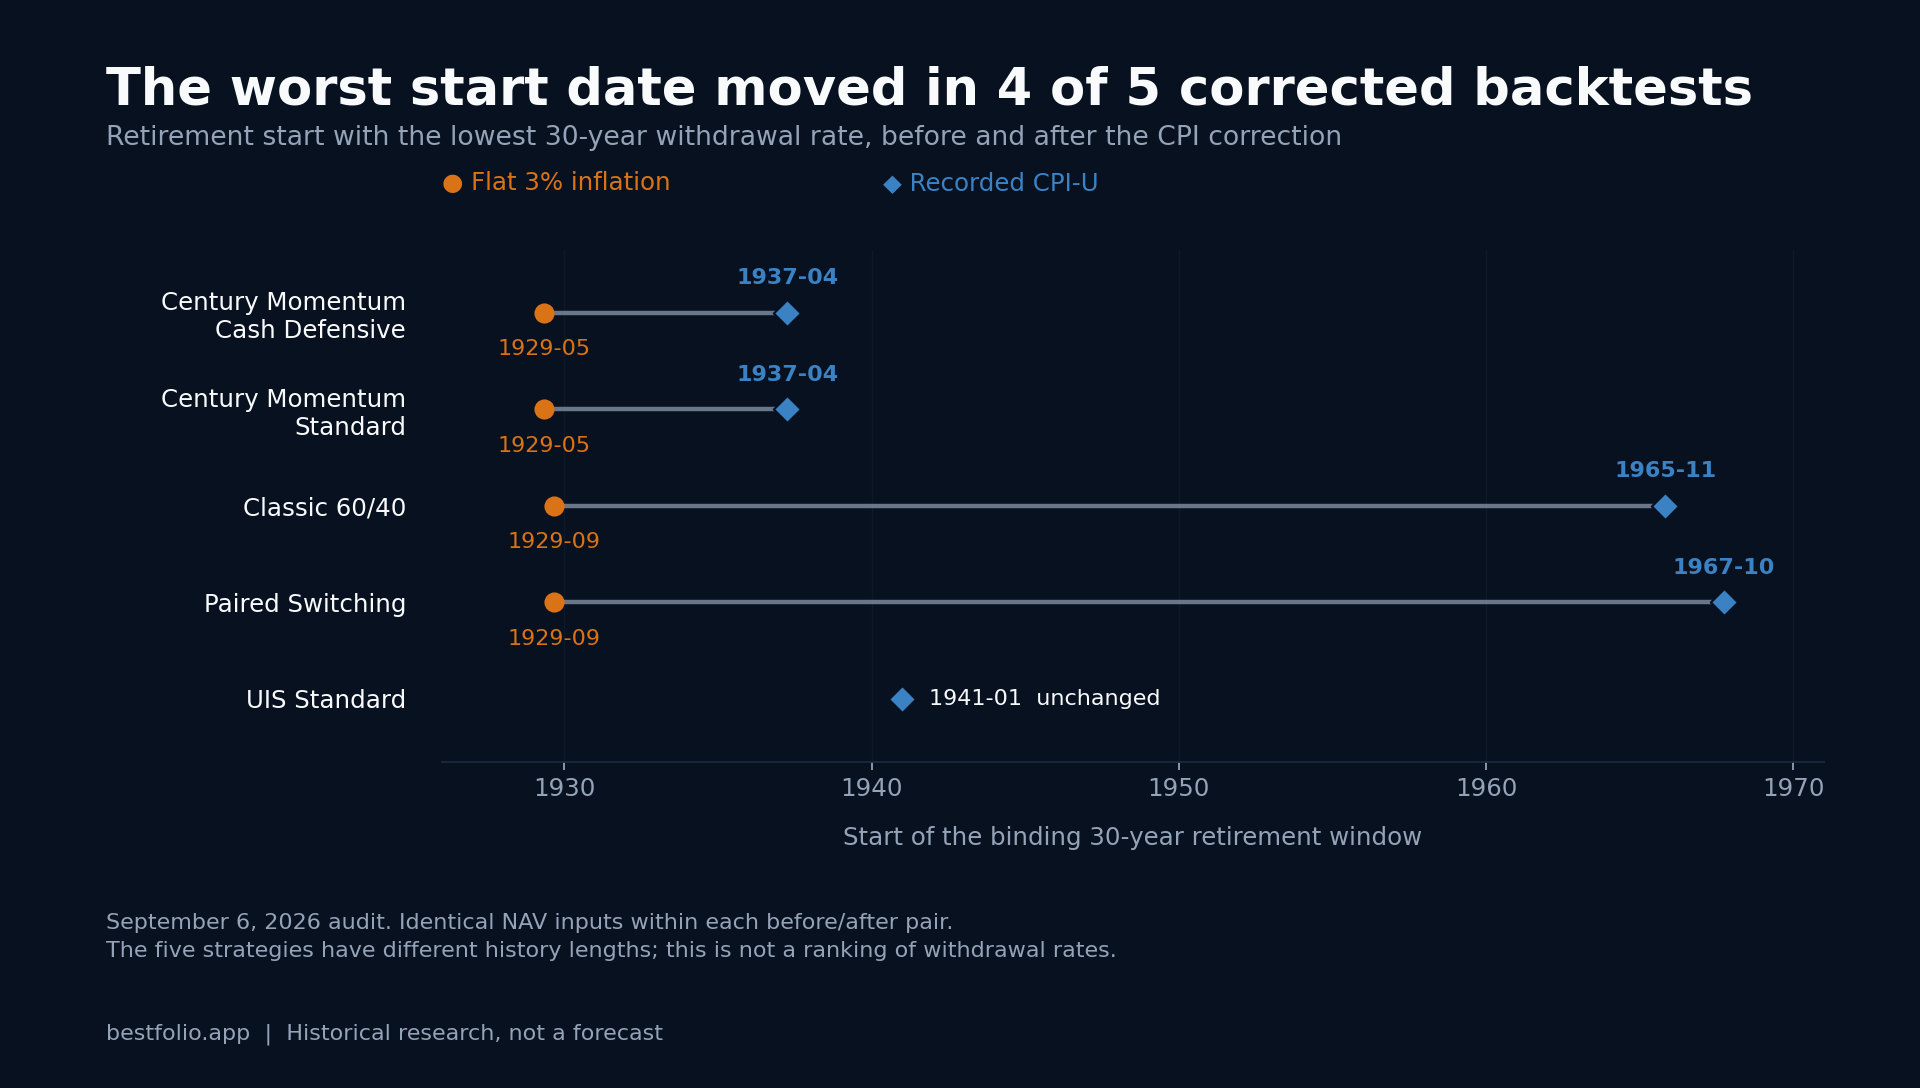
A threshold-based allocation rule can produce opposite decisions when one implementation uses total-return data and another uses price-only or unsettled prices.
Read more →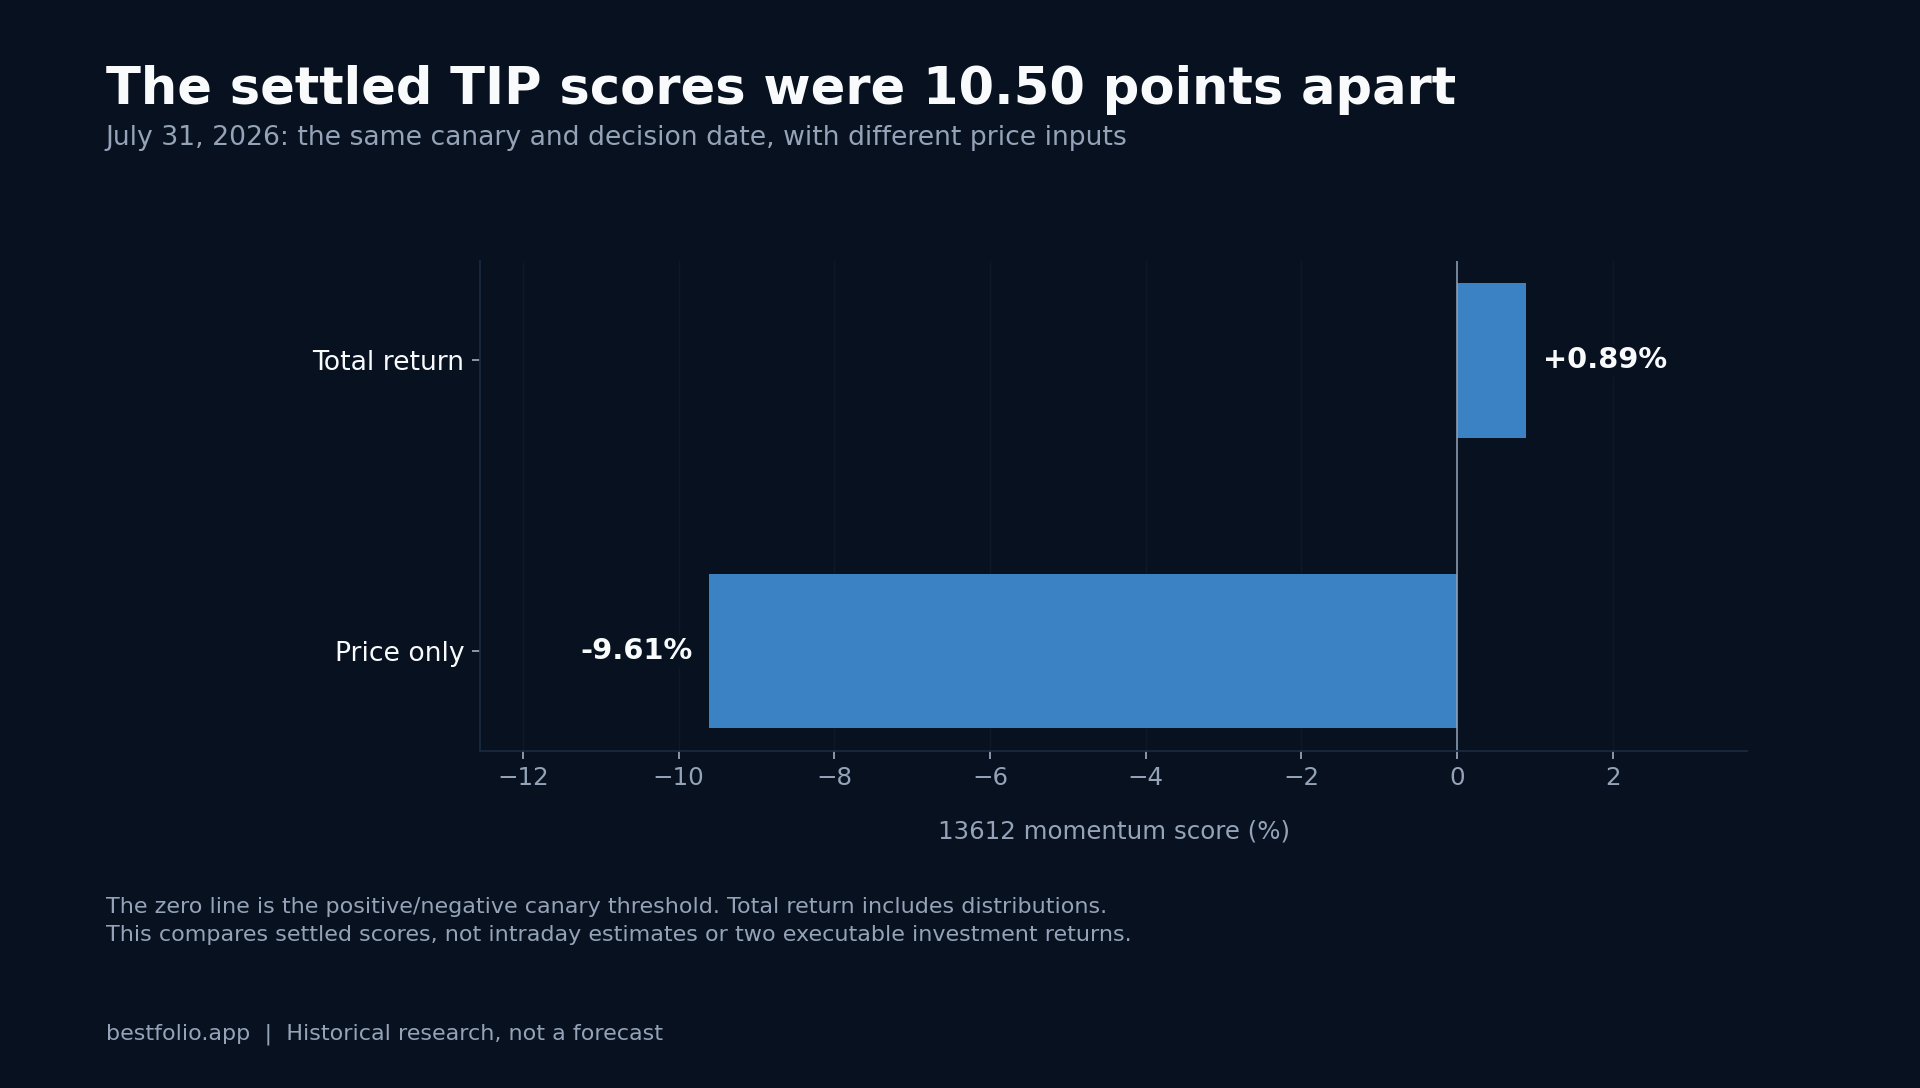
The Founder rate closes on 6 October at 11:59pm Pacific. After that, new subscribers pay $29/mo instead of $19/mo. If you're already on Founder, nothing changes for you.
Read more →
We separated the cash series used by a momentum signal from the cash return held by the portfolio. Across one fixed rule, that accounting choice moved CAGR by 0.87 percentage points.
Read more →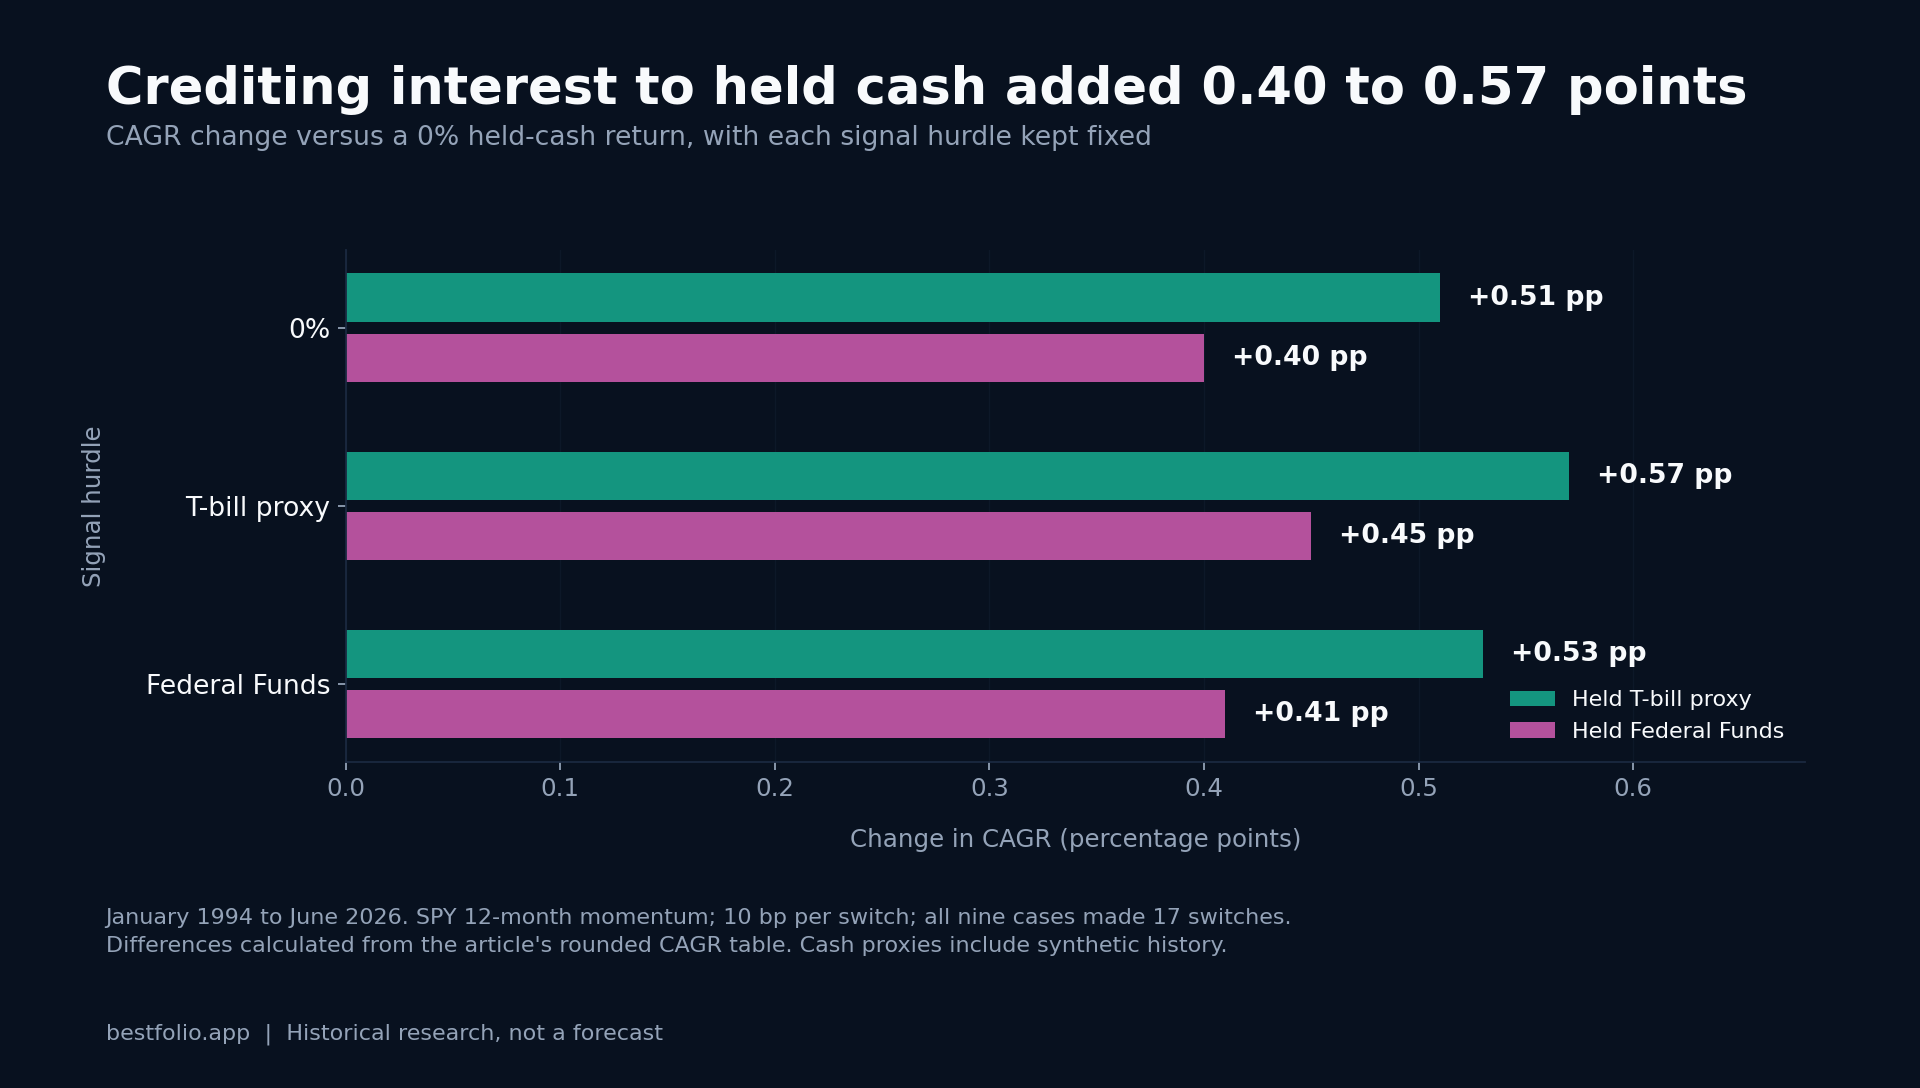
Five strategies join the BestFolio catalog today, led by David Varadi's Inflation Compass and its four-quadrant inflation read. The batch also carries our first community-credited strategy and a leveraged QLD variant wearing the strongest risk label we have ever put on a strategy page.

On matched windows SCHG and QQQM run a 0.978 correlation with identical drawdowns. SPMO is the only one running a strategy, and it cuts both ways: -10% in 2022 while the pair lost a third, then late to the 2023 bounce.
Read more →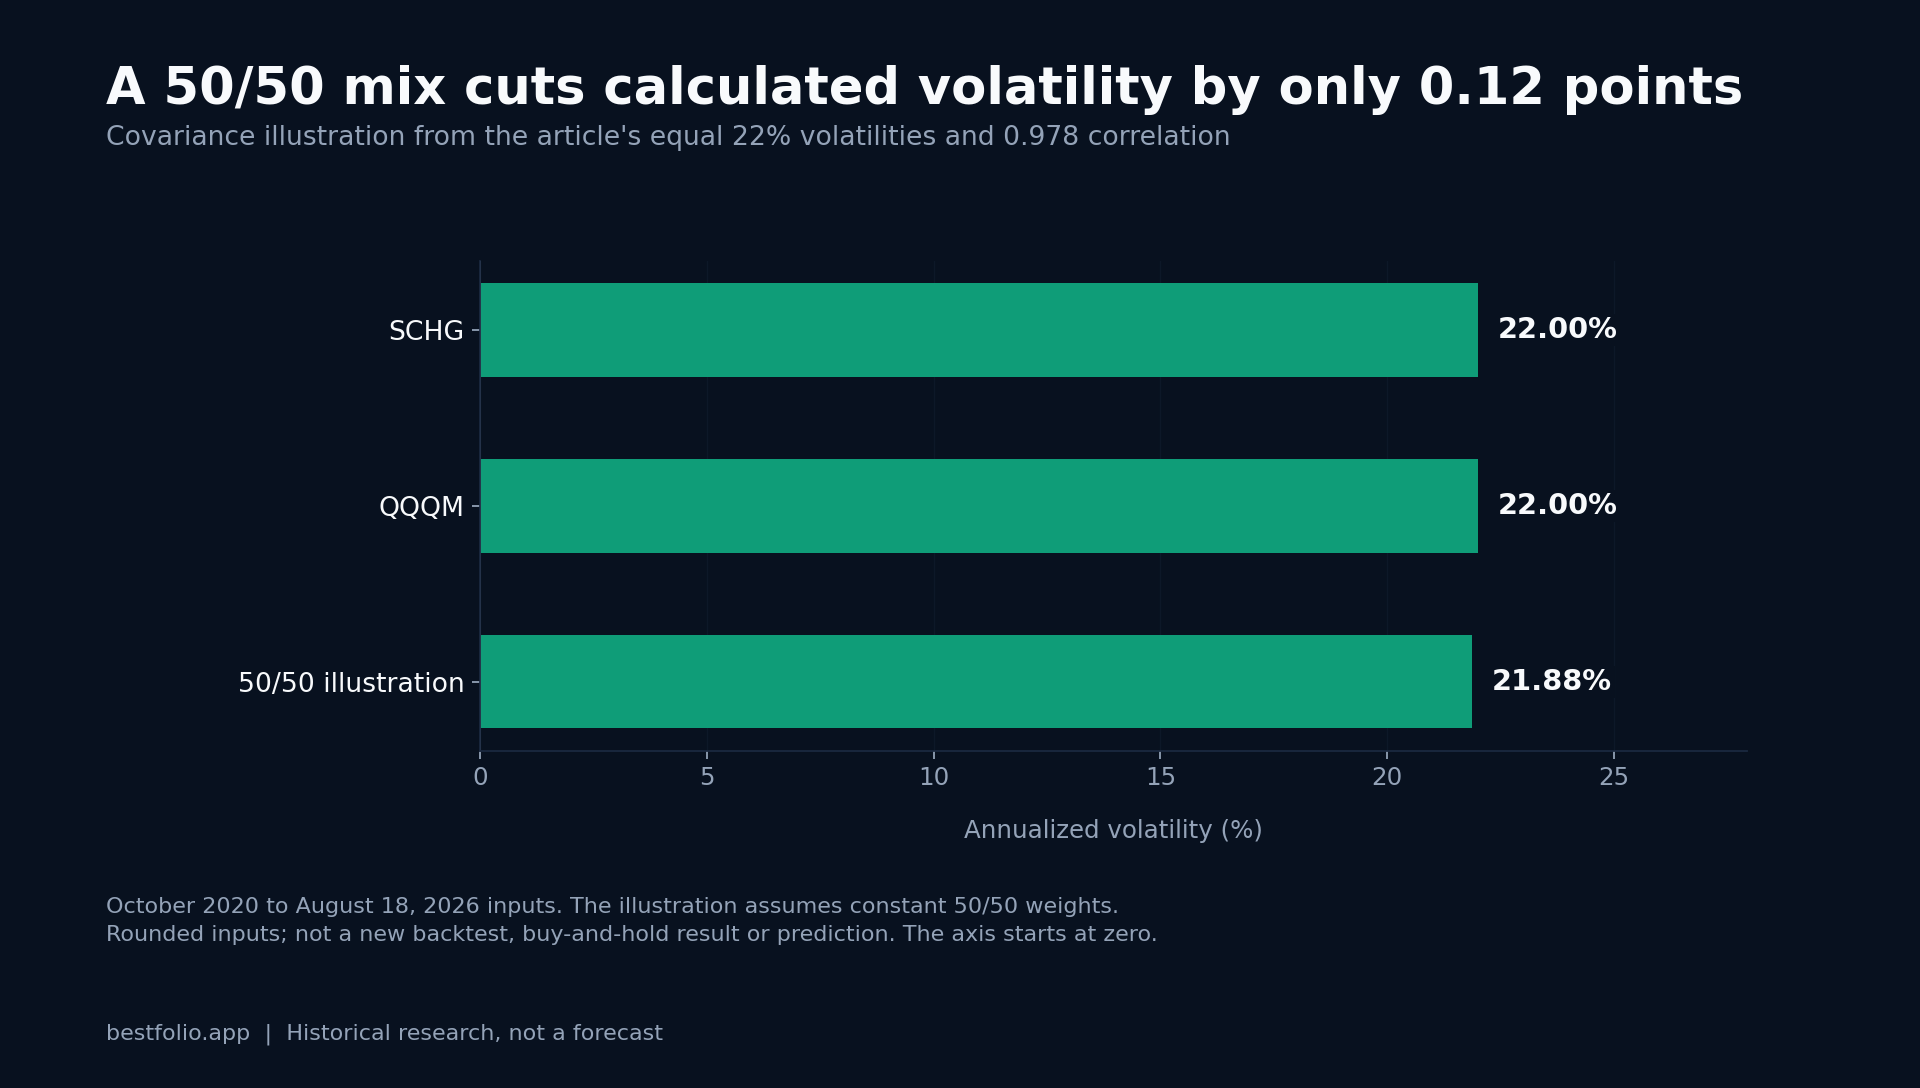
Golden Ratio Dual Gate compounds at 19.9% over the full backtest, yet its rolling 5-year outcomes ranged from 12.1% to 31.7% depending on the start month. We replayed all 160 eligible starts, lump sum and DCA, from the production series.
Read more →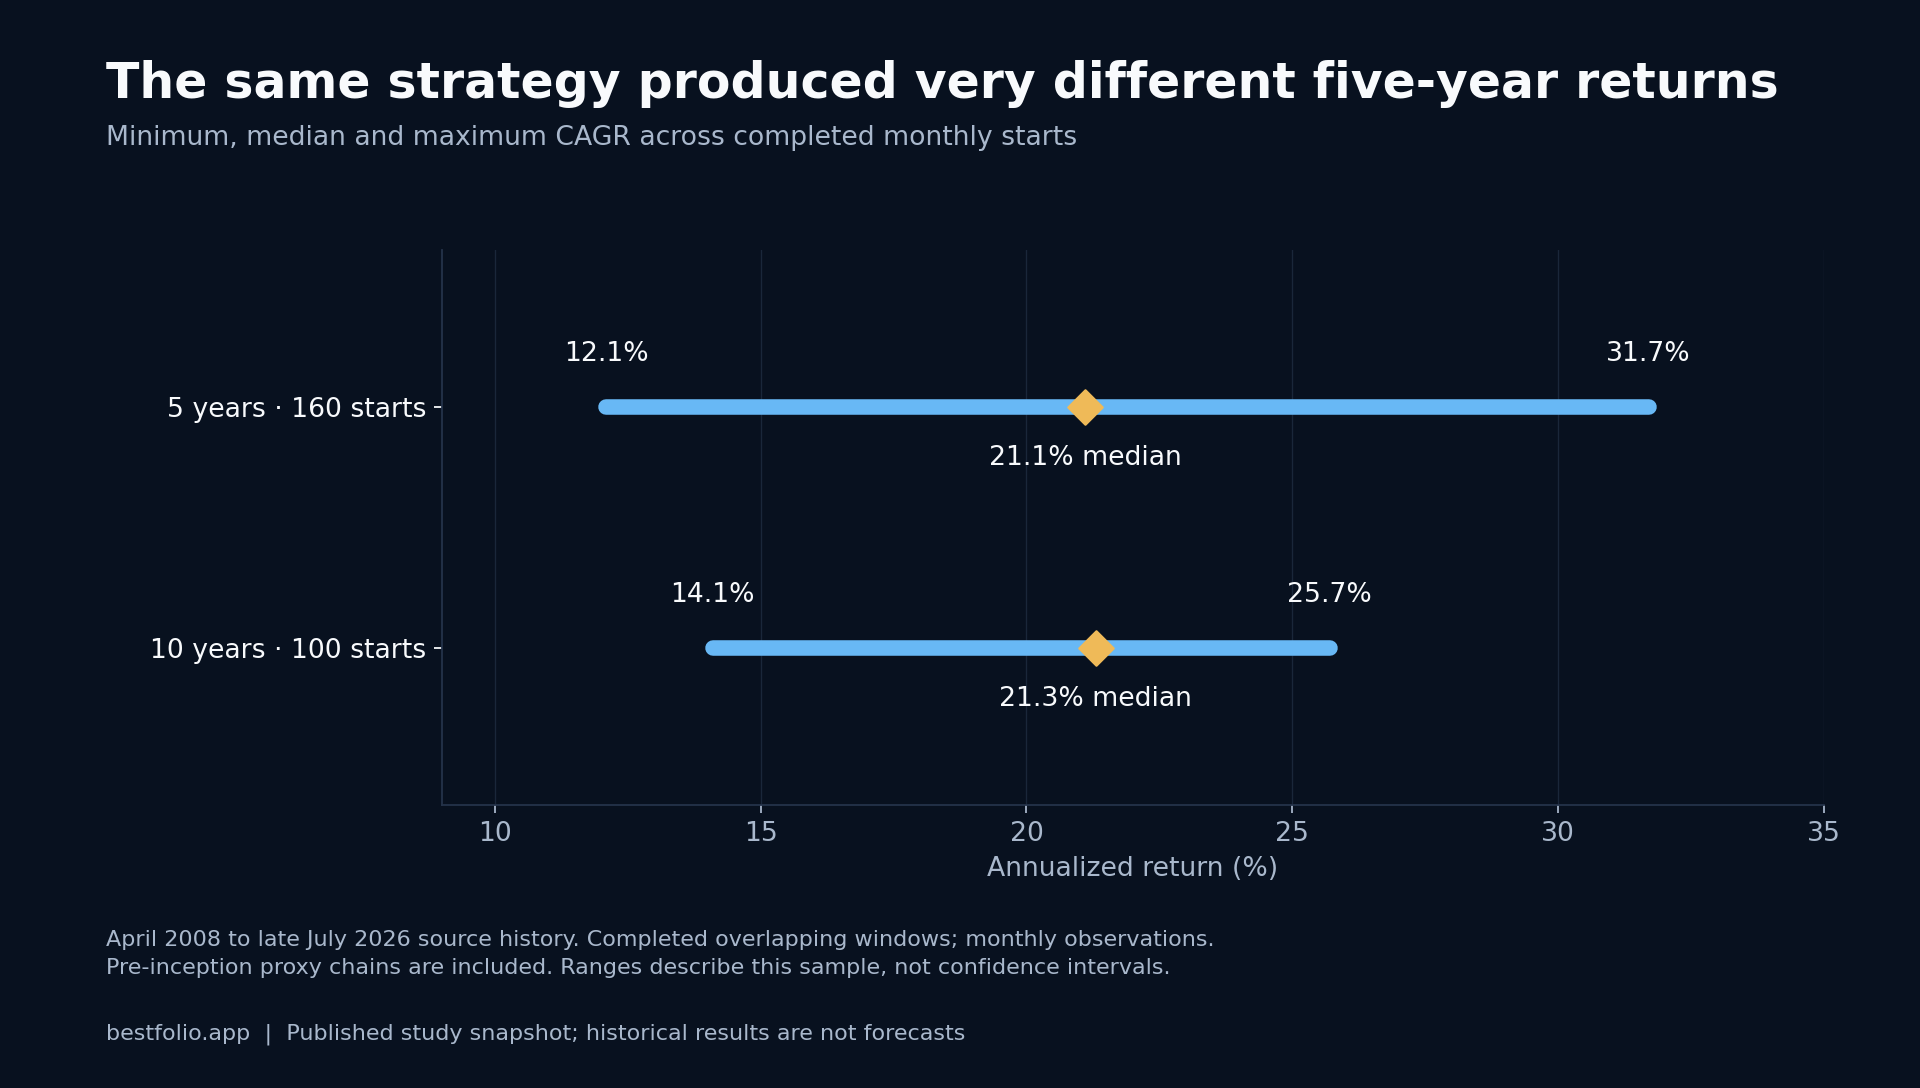
We added 1 and 2 business sessions to GEM, HAA and BAA after their canonical next-session trade. HAA and BAA each lost about 1 CAGR point at the 2-session delay.
Read more →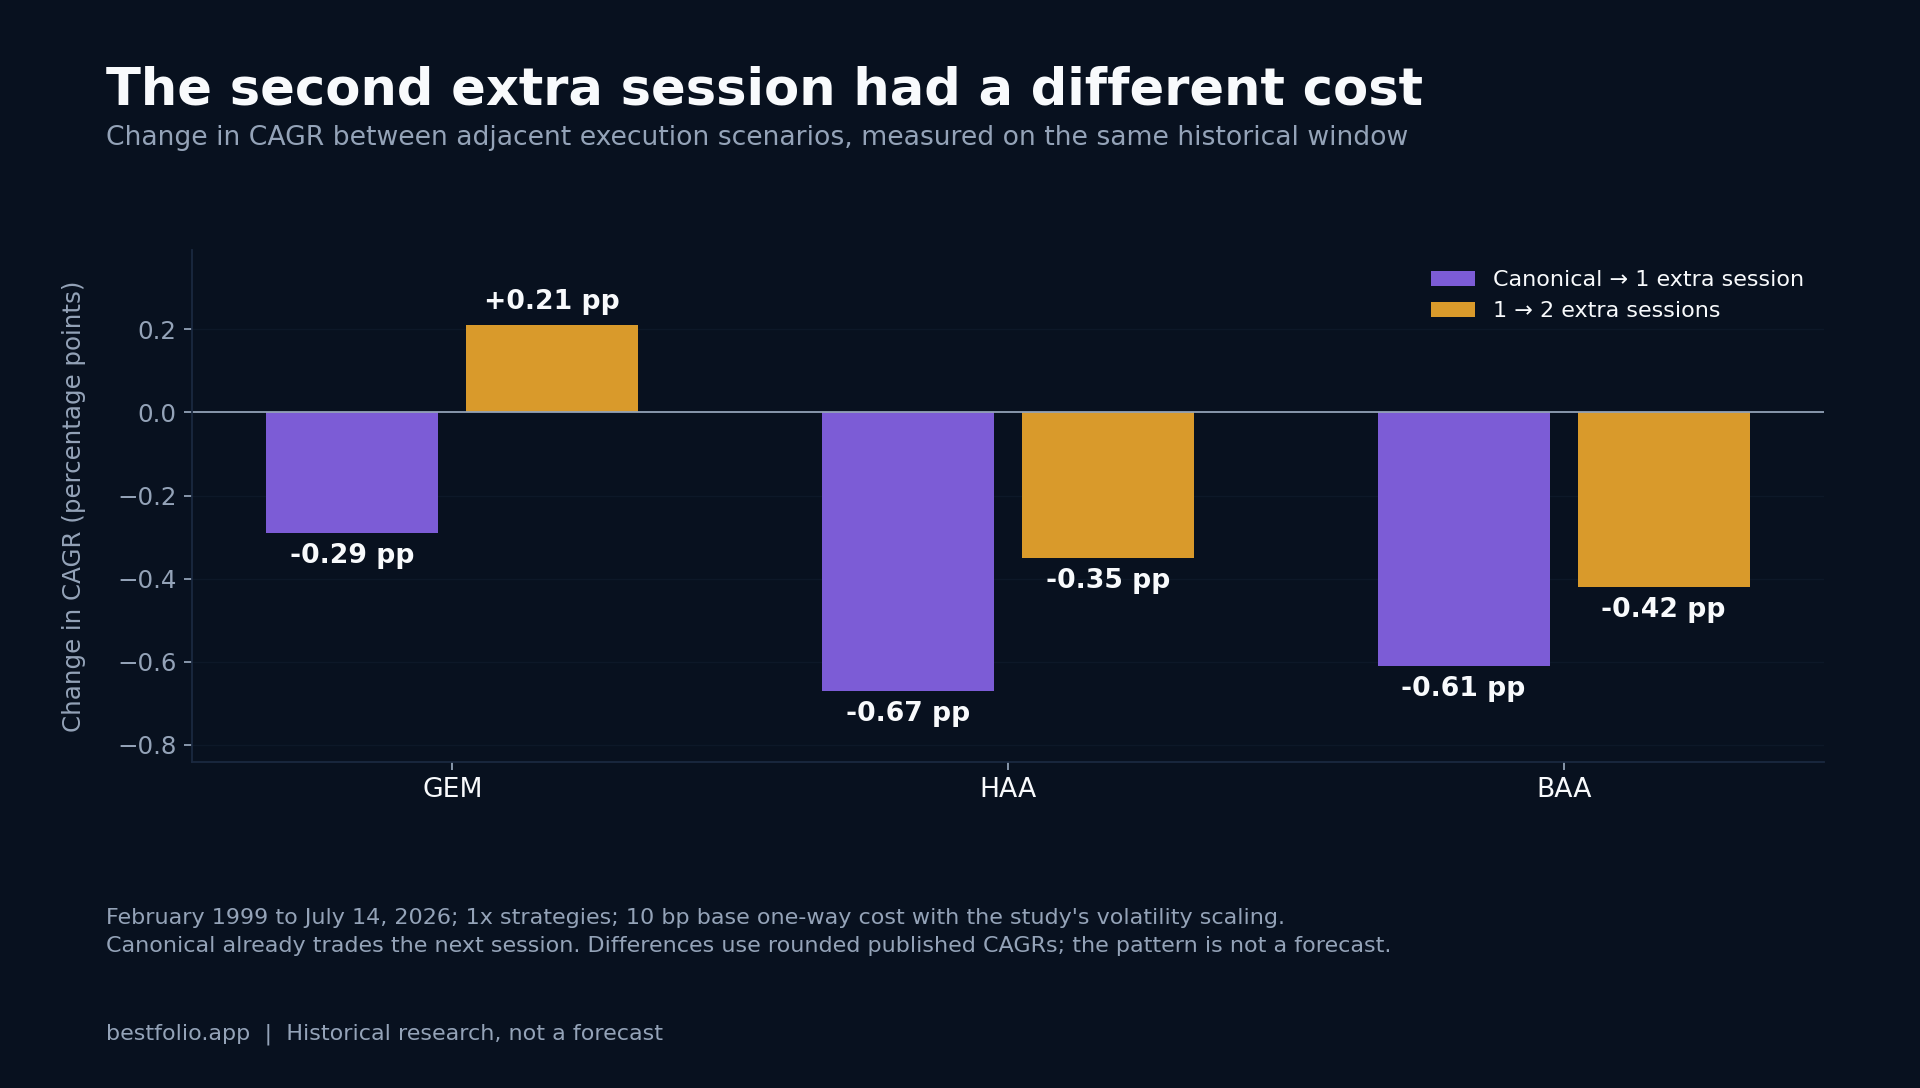
A subscriber rebuilt our GGCEM backtest on as-published OECD data and it fell apart. We verified it, published the real-time comparison, and pulled the strategy from our rankings.
Read more →
Treasuries failed in 2 of 5 fast equity selloffs. We tested whether the prior 60-day stock-bond correlation warned us. The rule caught 2 cases out of 5 and fired constantly in calm markets.
Read more →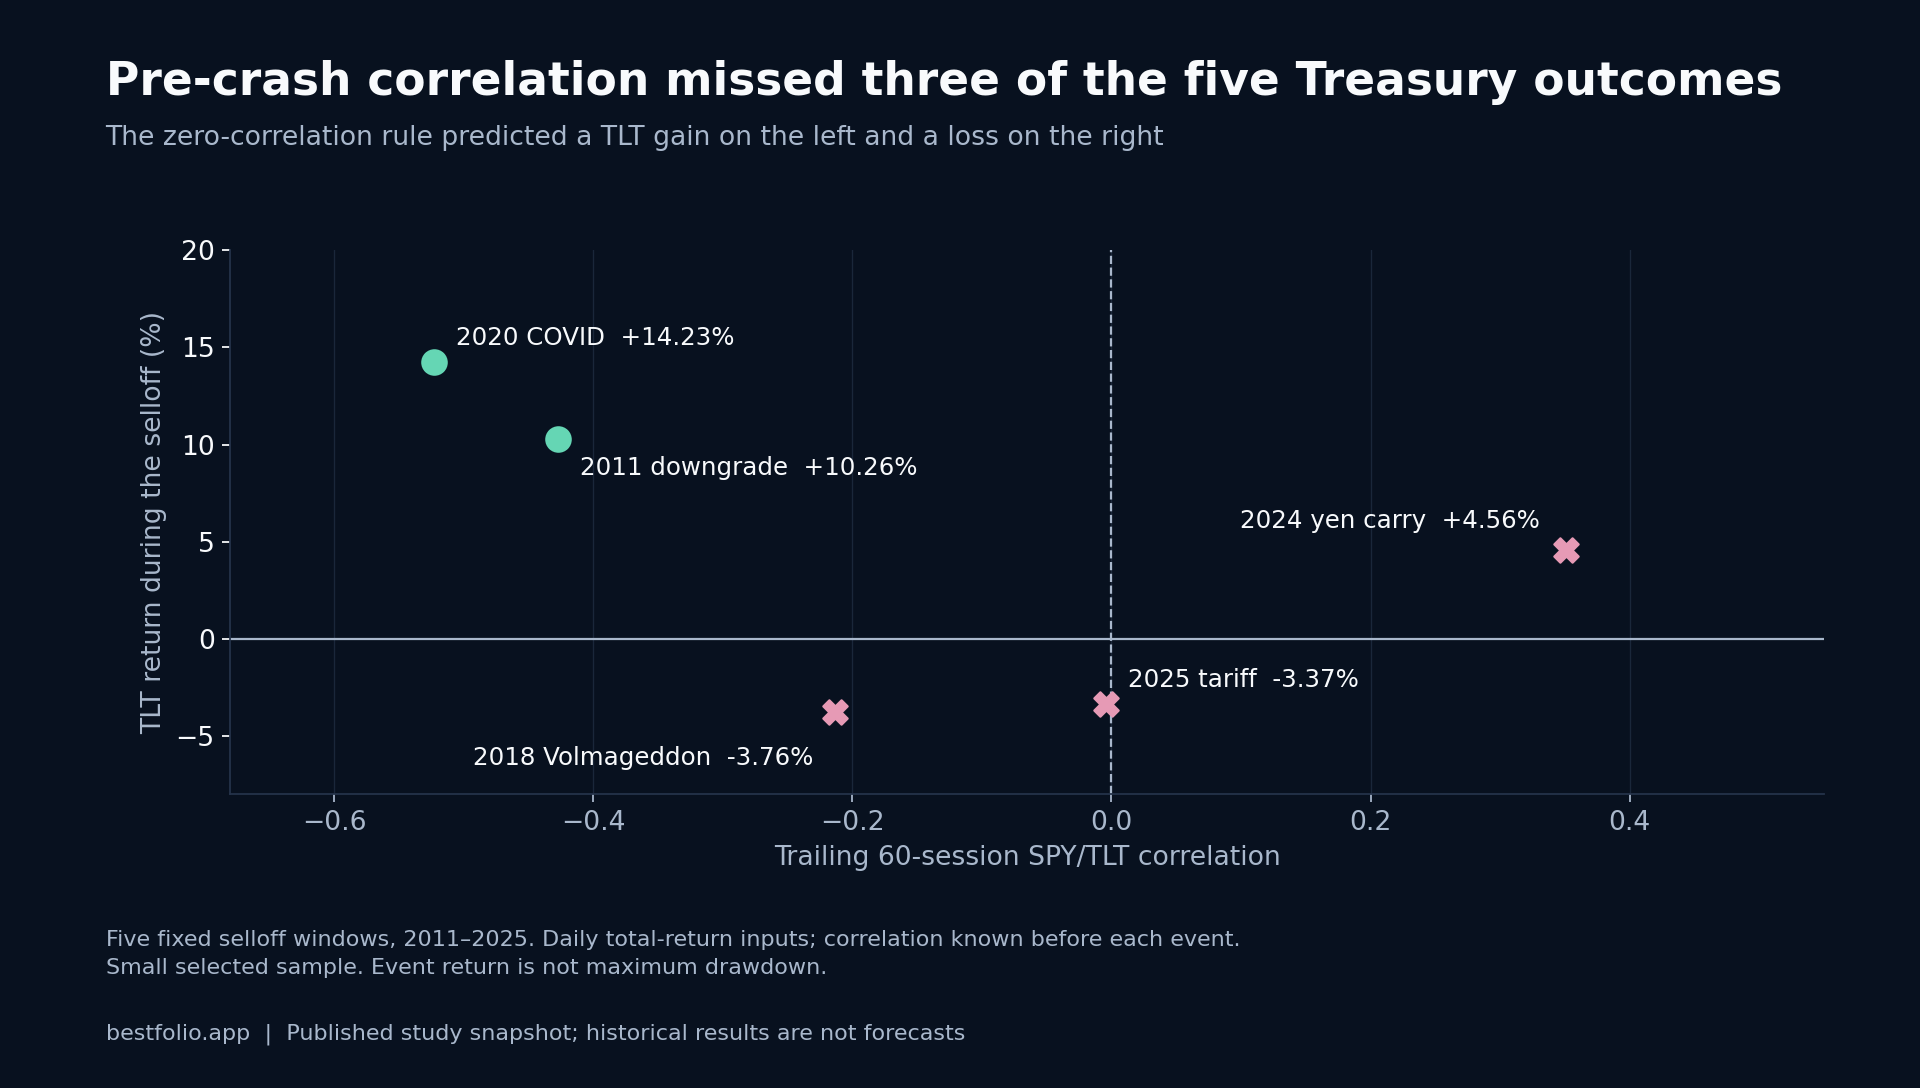
Every strategy on BestFolio carries a Robustness score: the probability its Sharpe is a real edge rather than the luckiest pick among the 202 variants we tested, released or not. Here's how it works, which of our own strategies it flags, and why every score just dropped a notch.
Read more →
Our 3 tracked model portfolios lead the post: the conservative blend did -0.4% in July 2026 (+1.9% YTD). Then the full board of 69 published TAA strategies, with the month, year-to-date and 1-year return side by side, because the long view is the one that counts. YTD leaders, the leveraged corner, and the month's best and worst.
Read more →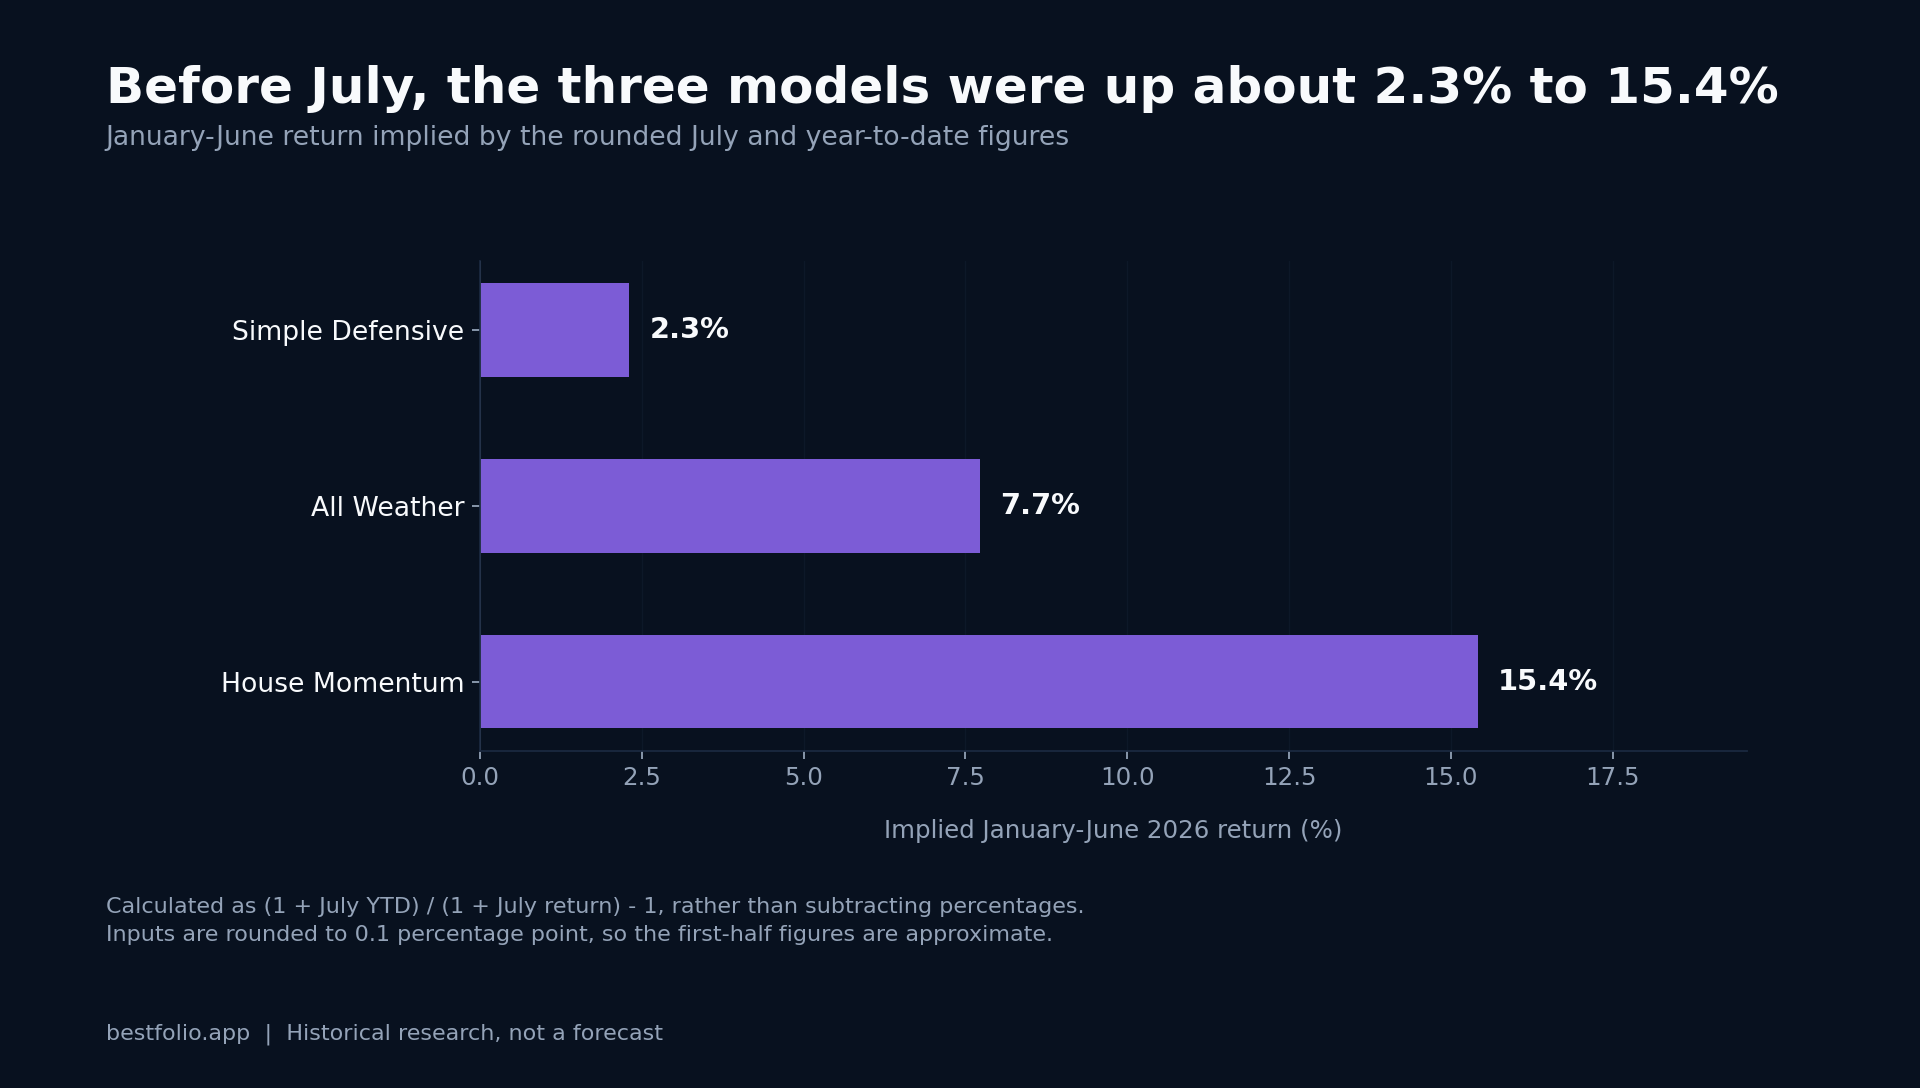
LVWC charges 0.60%, but that figure sits after the leveraged index has already paid for borrowing. We trace every layer and use Amundi's older 2x USA fund to show what can be measured today.
Read more →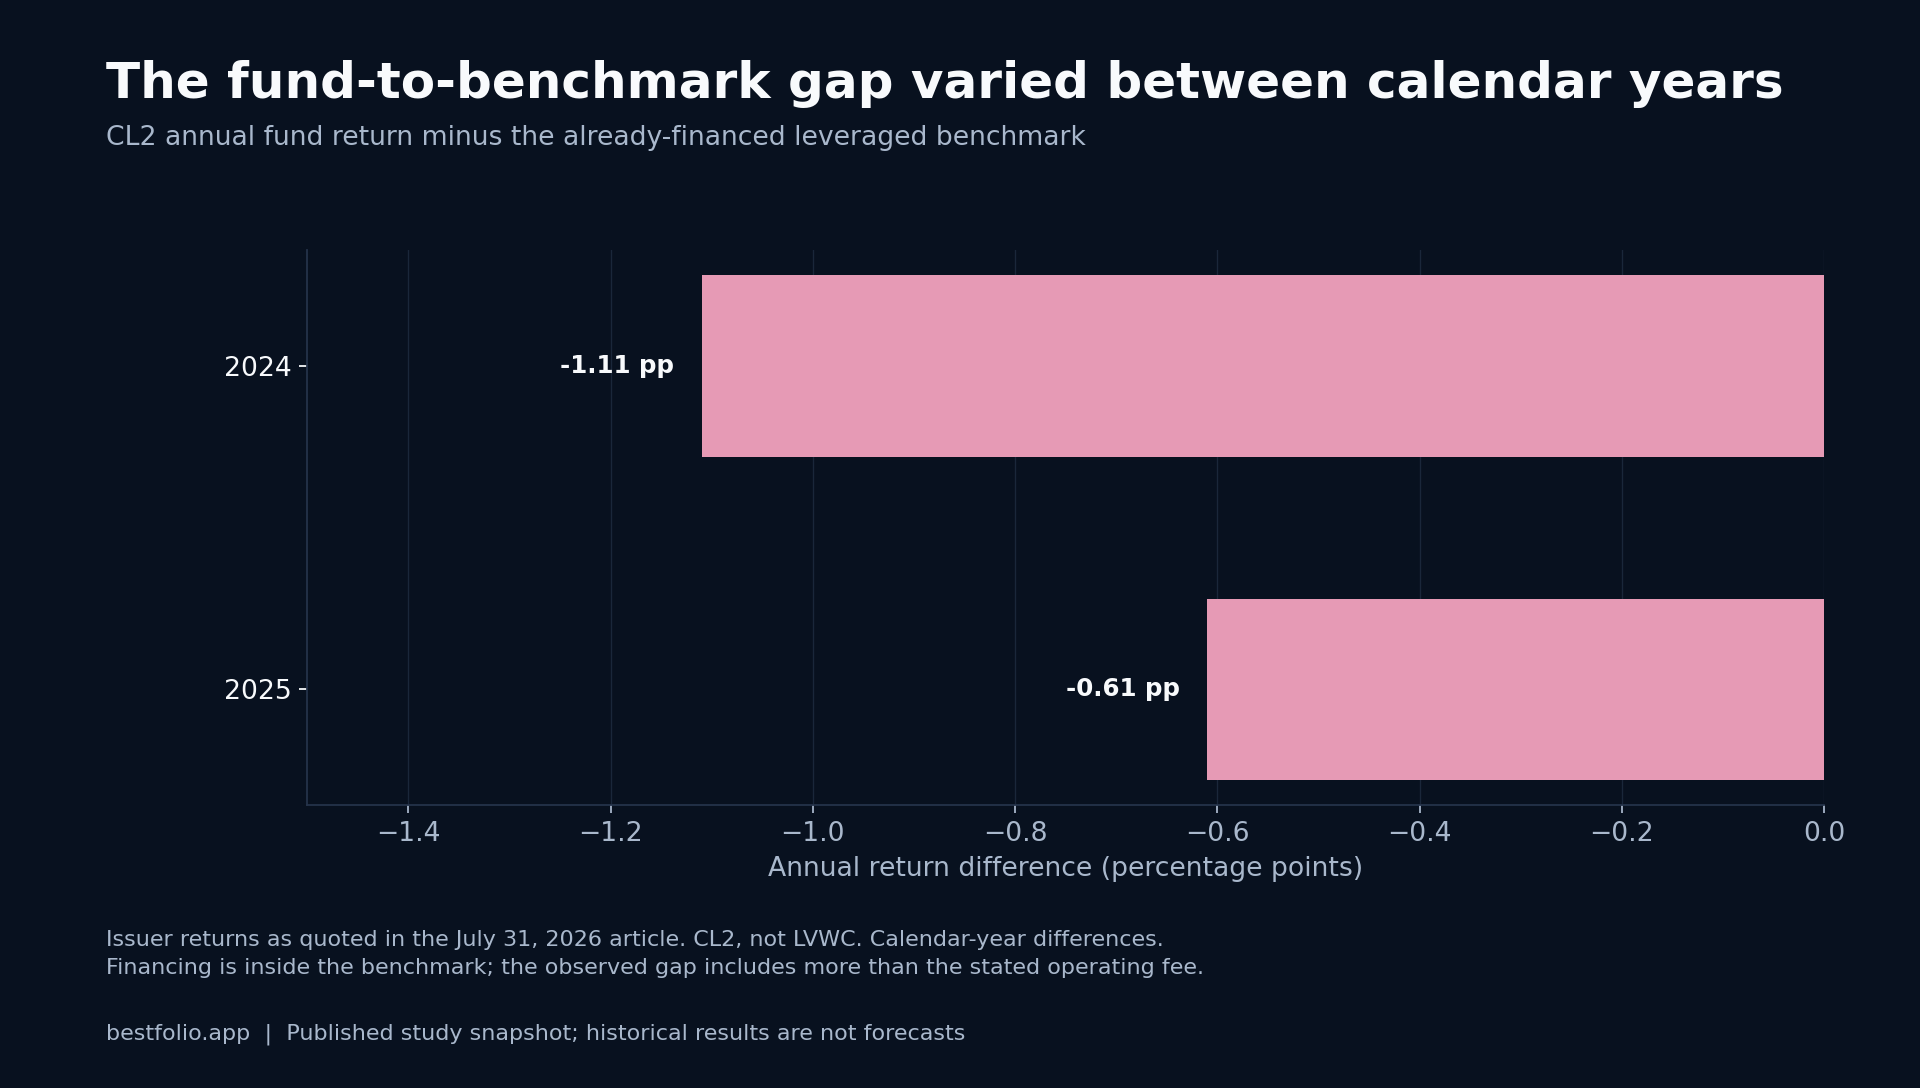
Six strategies, six distinct return mechanisms. The August batch arrives July 28 with a macro regime model, a two-system momentum blend, a channel breakout, a defensive trend switch, a bond timing model, and one fixed allocation. All six clear the live catalog's median Sharpe of 0.97.

Regular contributions helped a synthetic 2x S&P 500 position across long historical windows, but they never removed sequence risk. In 5,000 block-resampled 15-year paths, the leveraged route still trailed 24.74% of the time.
Read more →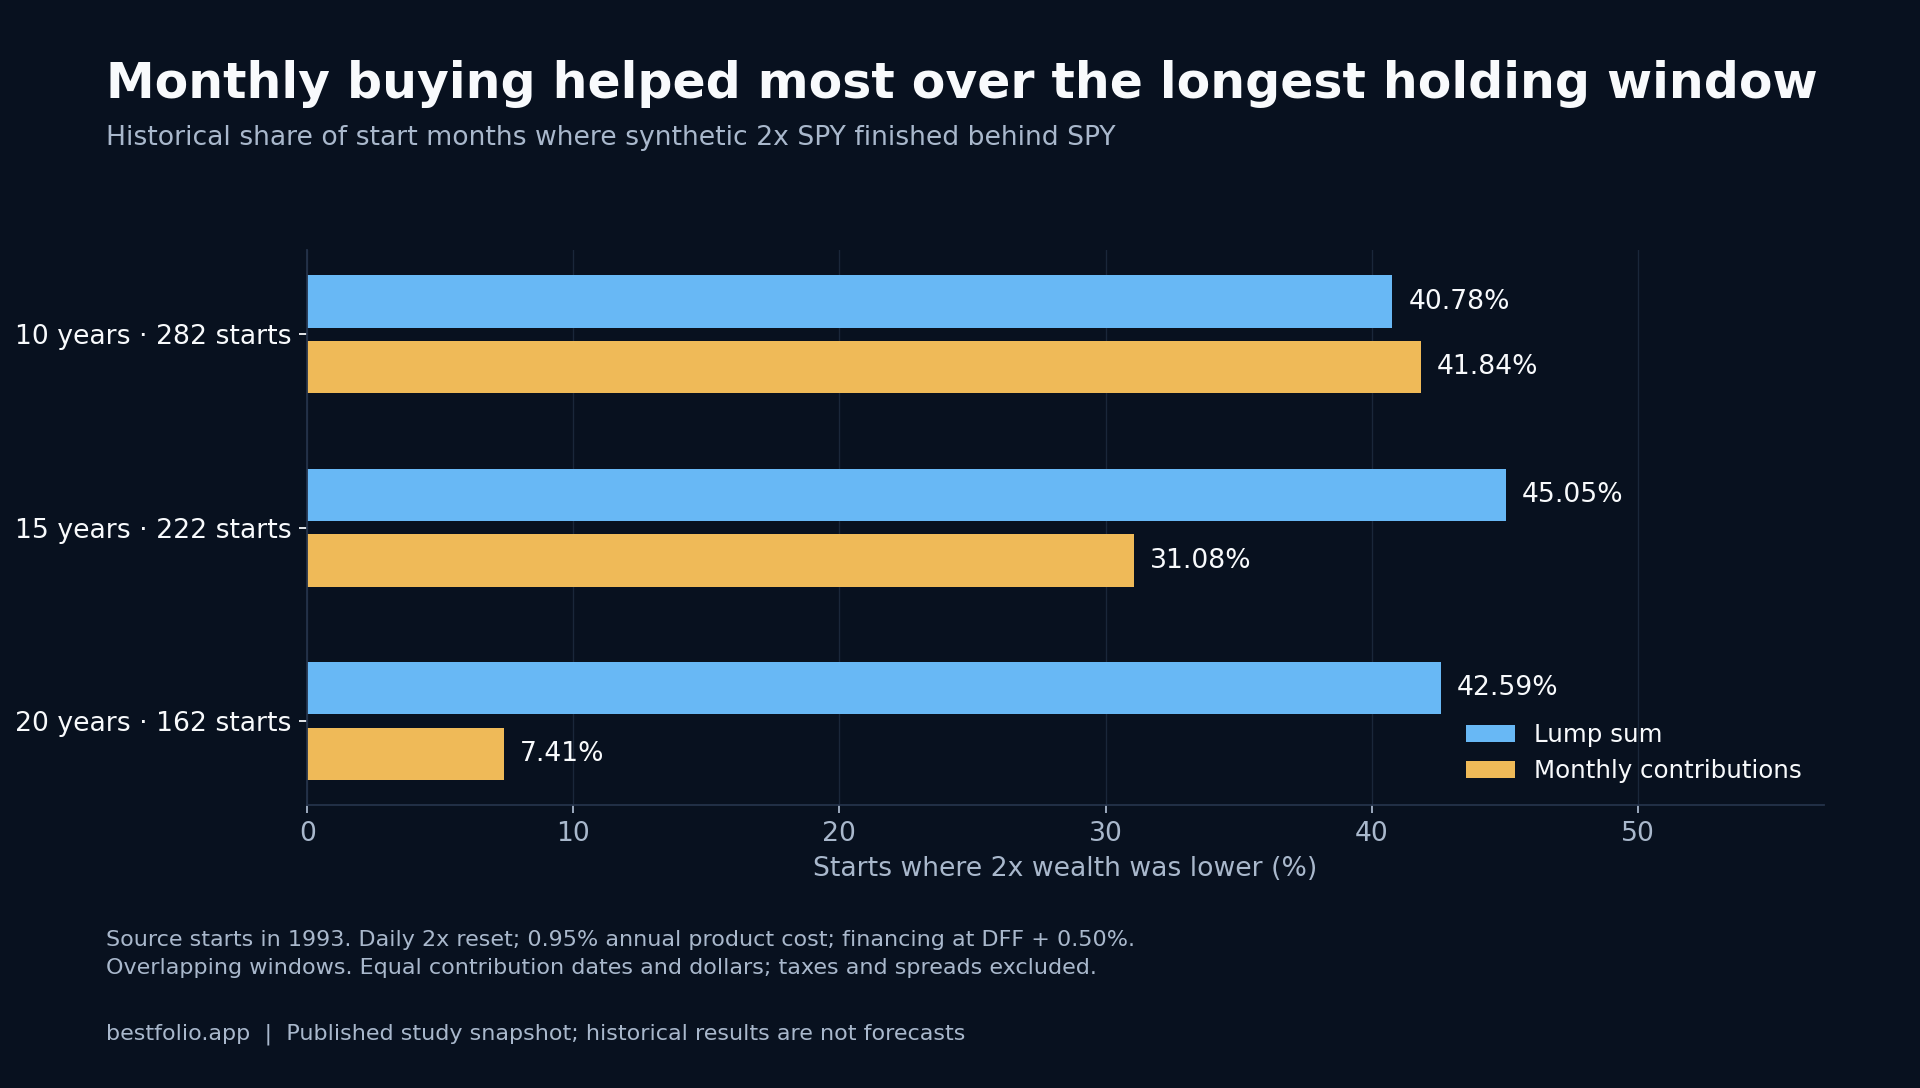
A subscriber asked us to add a tactical strategy whose rules are private. We can't implement rules we can't read, so we rebuilt the portfolio's shape from three fully published models. Same Sharpe, same max drawdown, 1.7 points less CAGR.
Read more →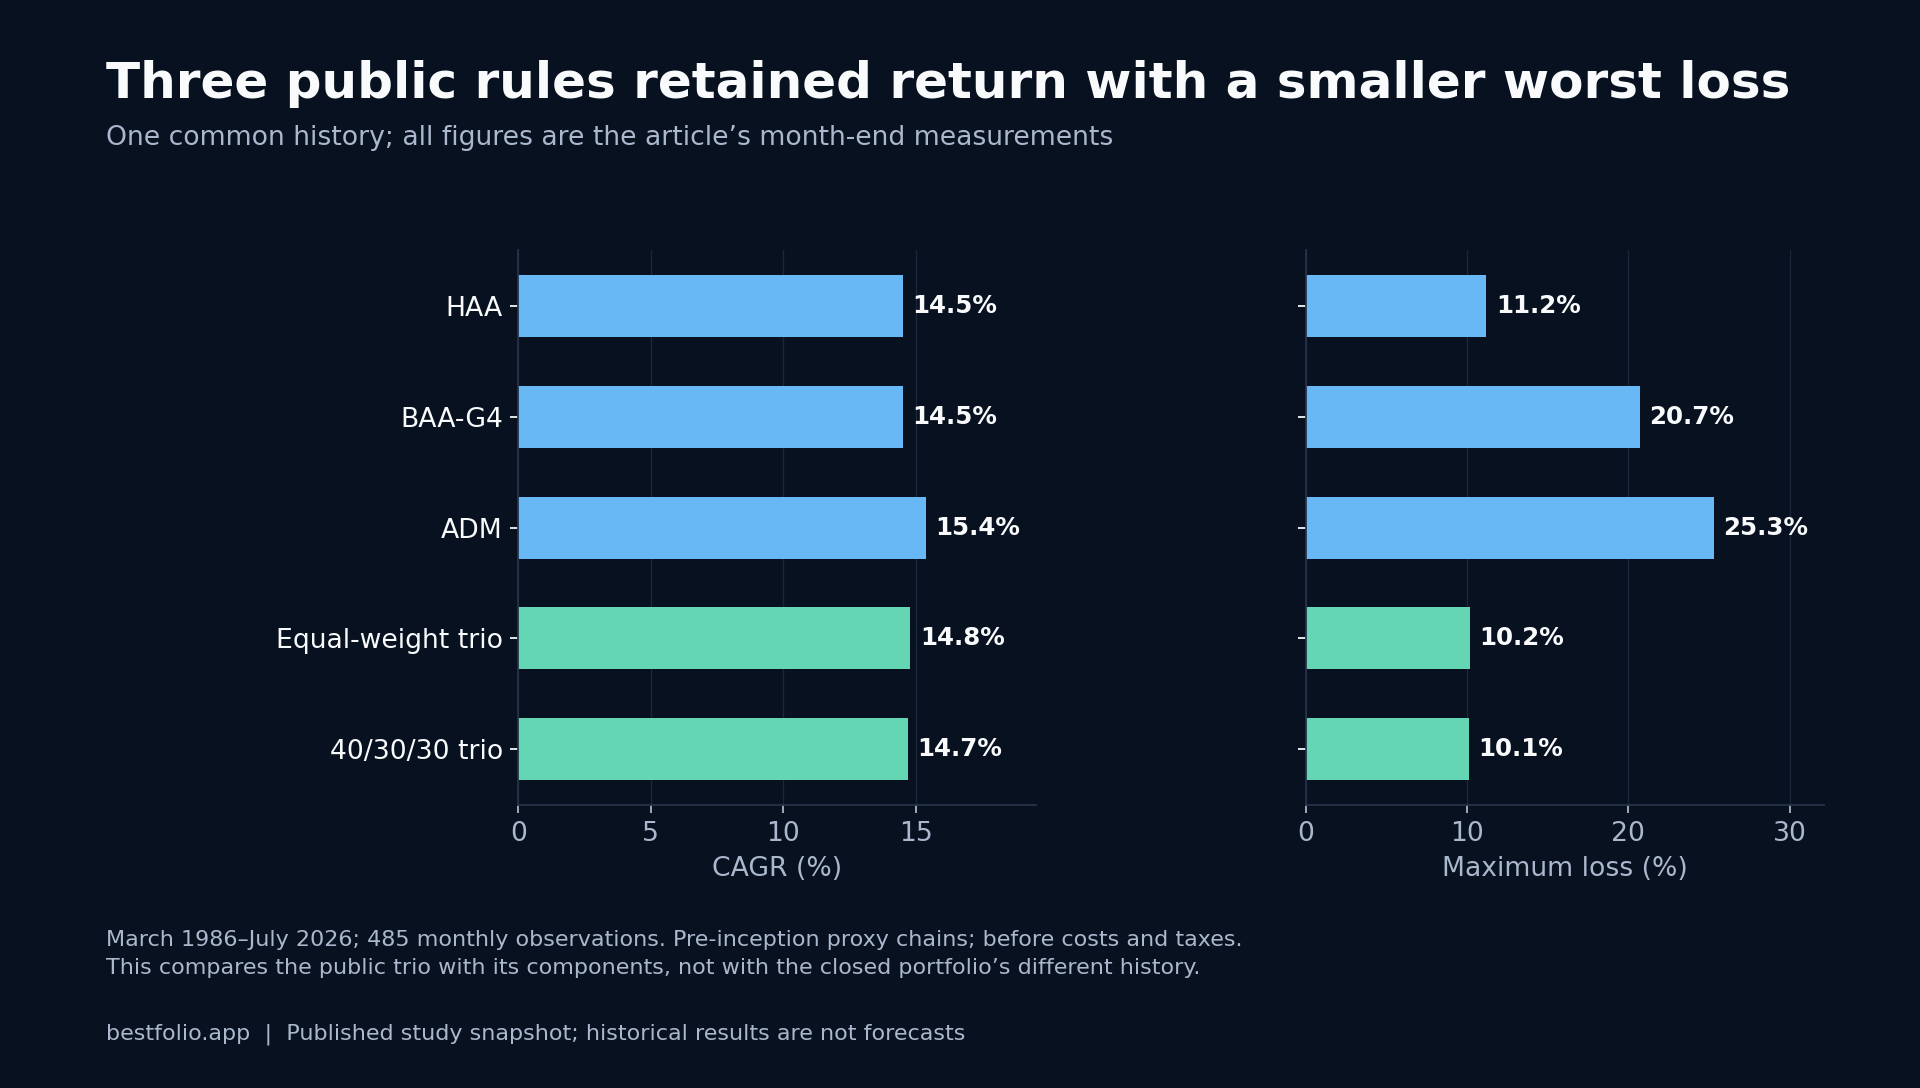
r/ETFs is loading SPMO as a defensive core on the strength of one friendly decade. We put its real record next to a century of momentum data. The visible part is great. The invisible part is the whole risk.
Read more →
The scariest retirement start date in modern history keeps coming up on r/Fire. We extended the numbers past the usual 2023 cutoff, then re-ran the same cohort on tactical strategies.
Read more →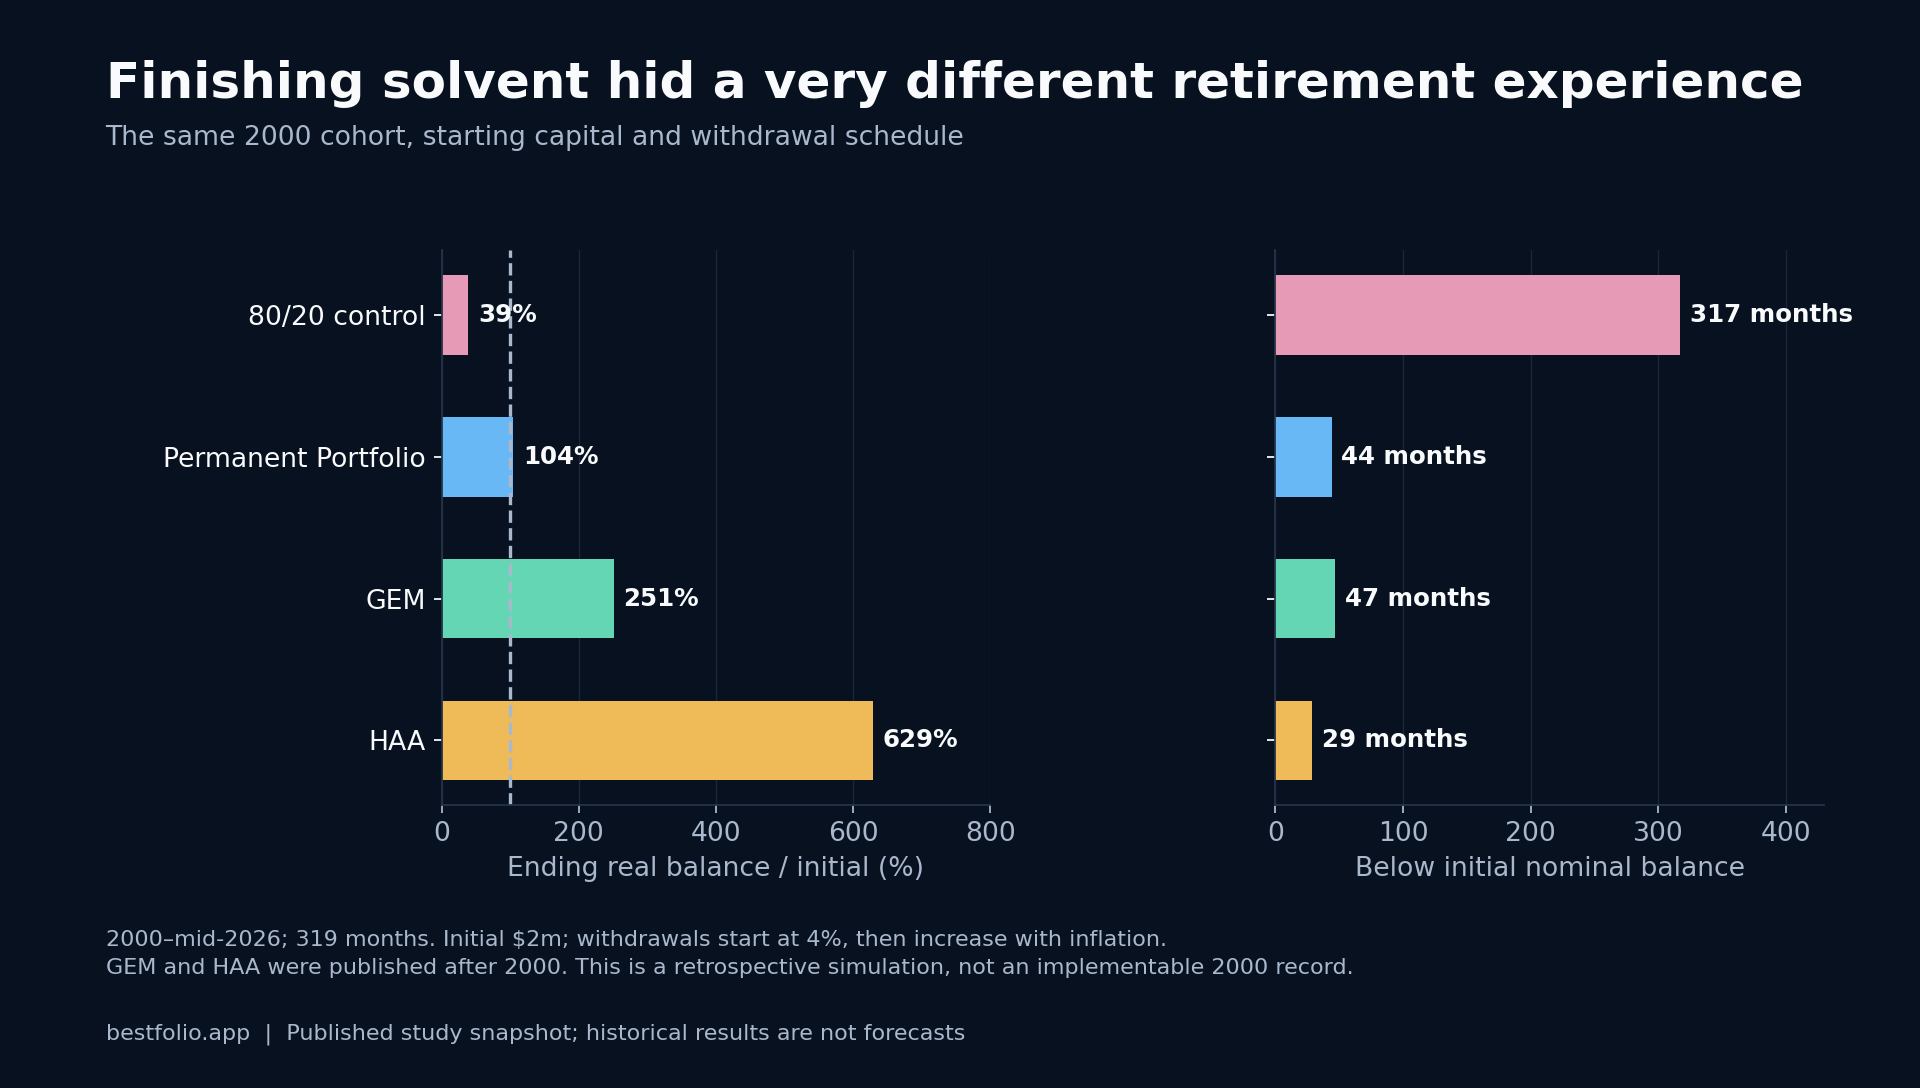
A community strategy we rebuilt on real funds: 50% UPRO on top of a five-asset sleeve, gated by SPY and TIP. Every rule and every number, free, including the year the gate gets wrong.
Read more →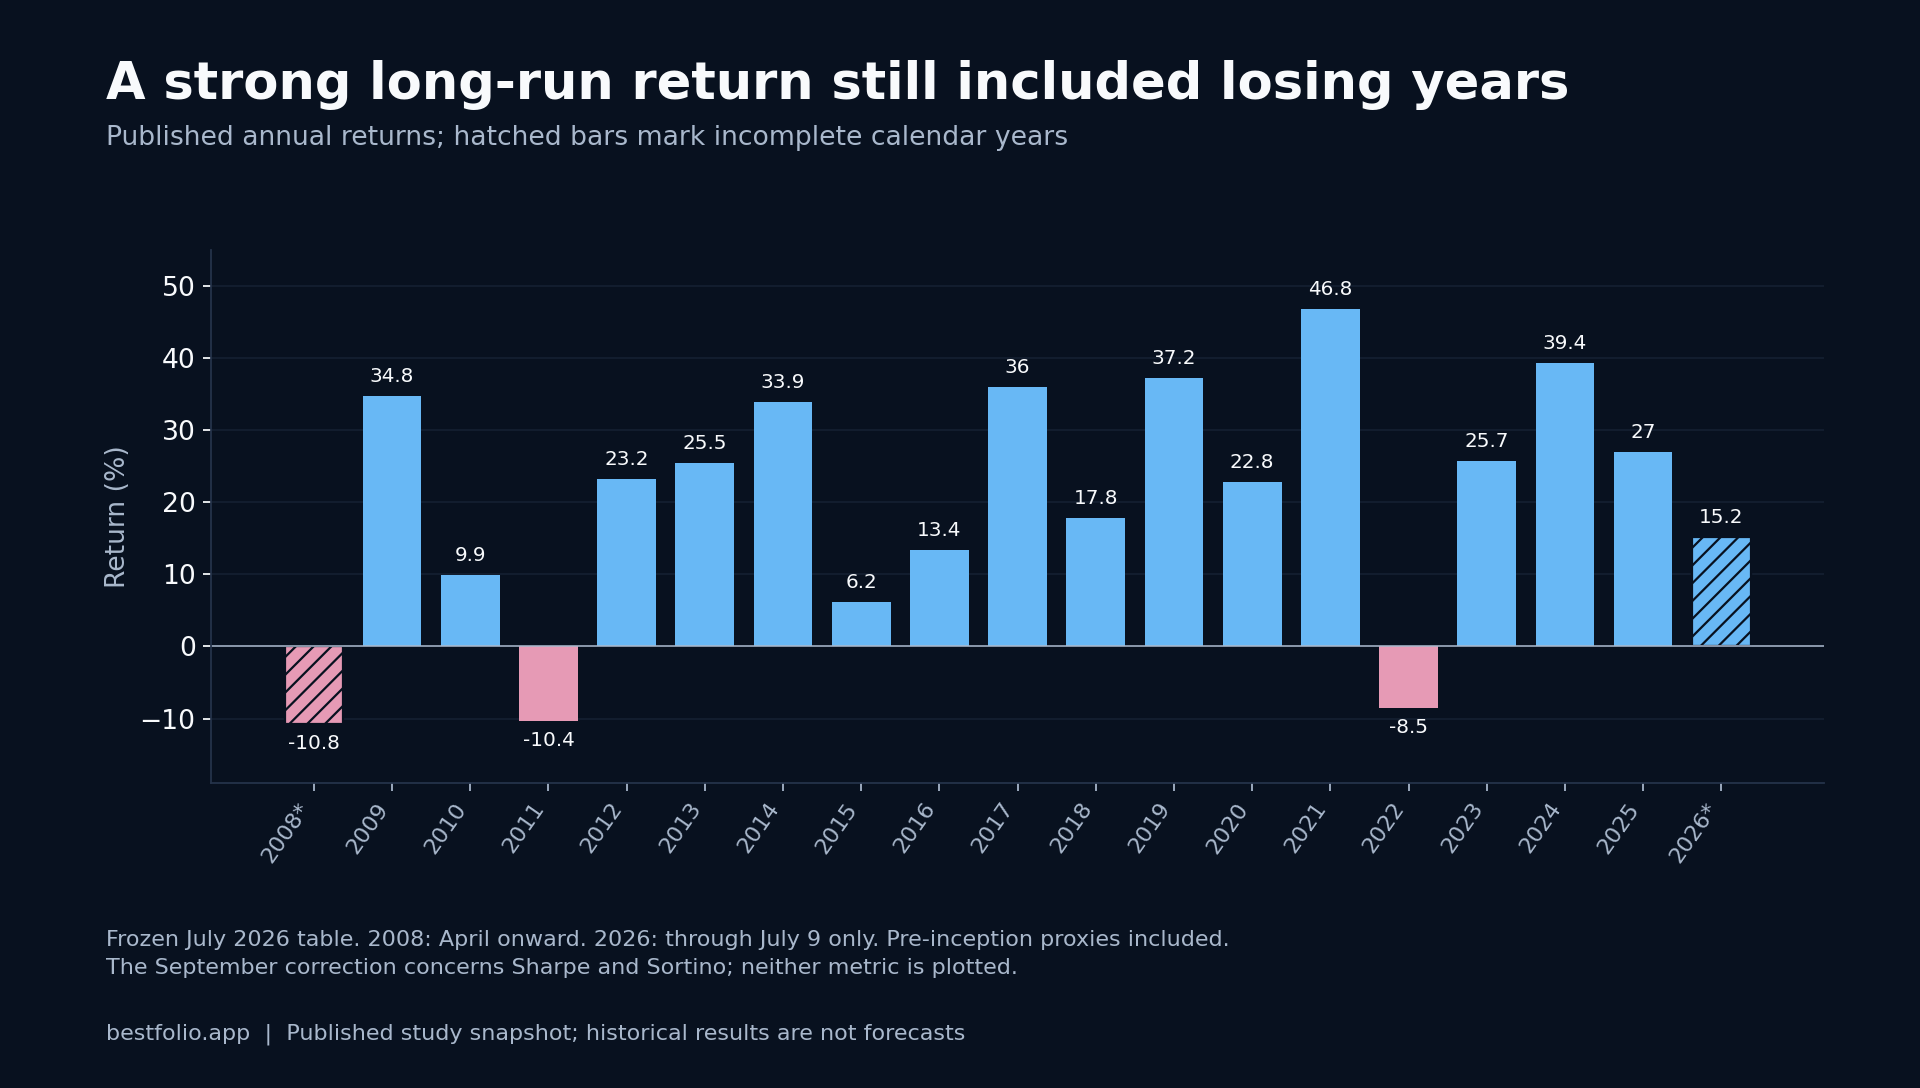
A question from r/LETFs: if your signals lag, what do you hold in the gap? We measured every major defensive asset inside the five fastest equity selloffs since 2011. One result surprised us, and its price tag explains why nobody holds it.
Read more →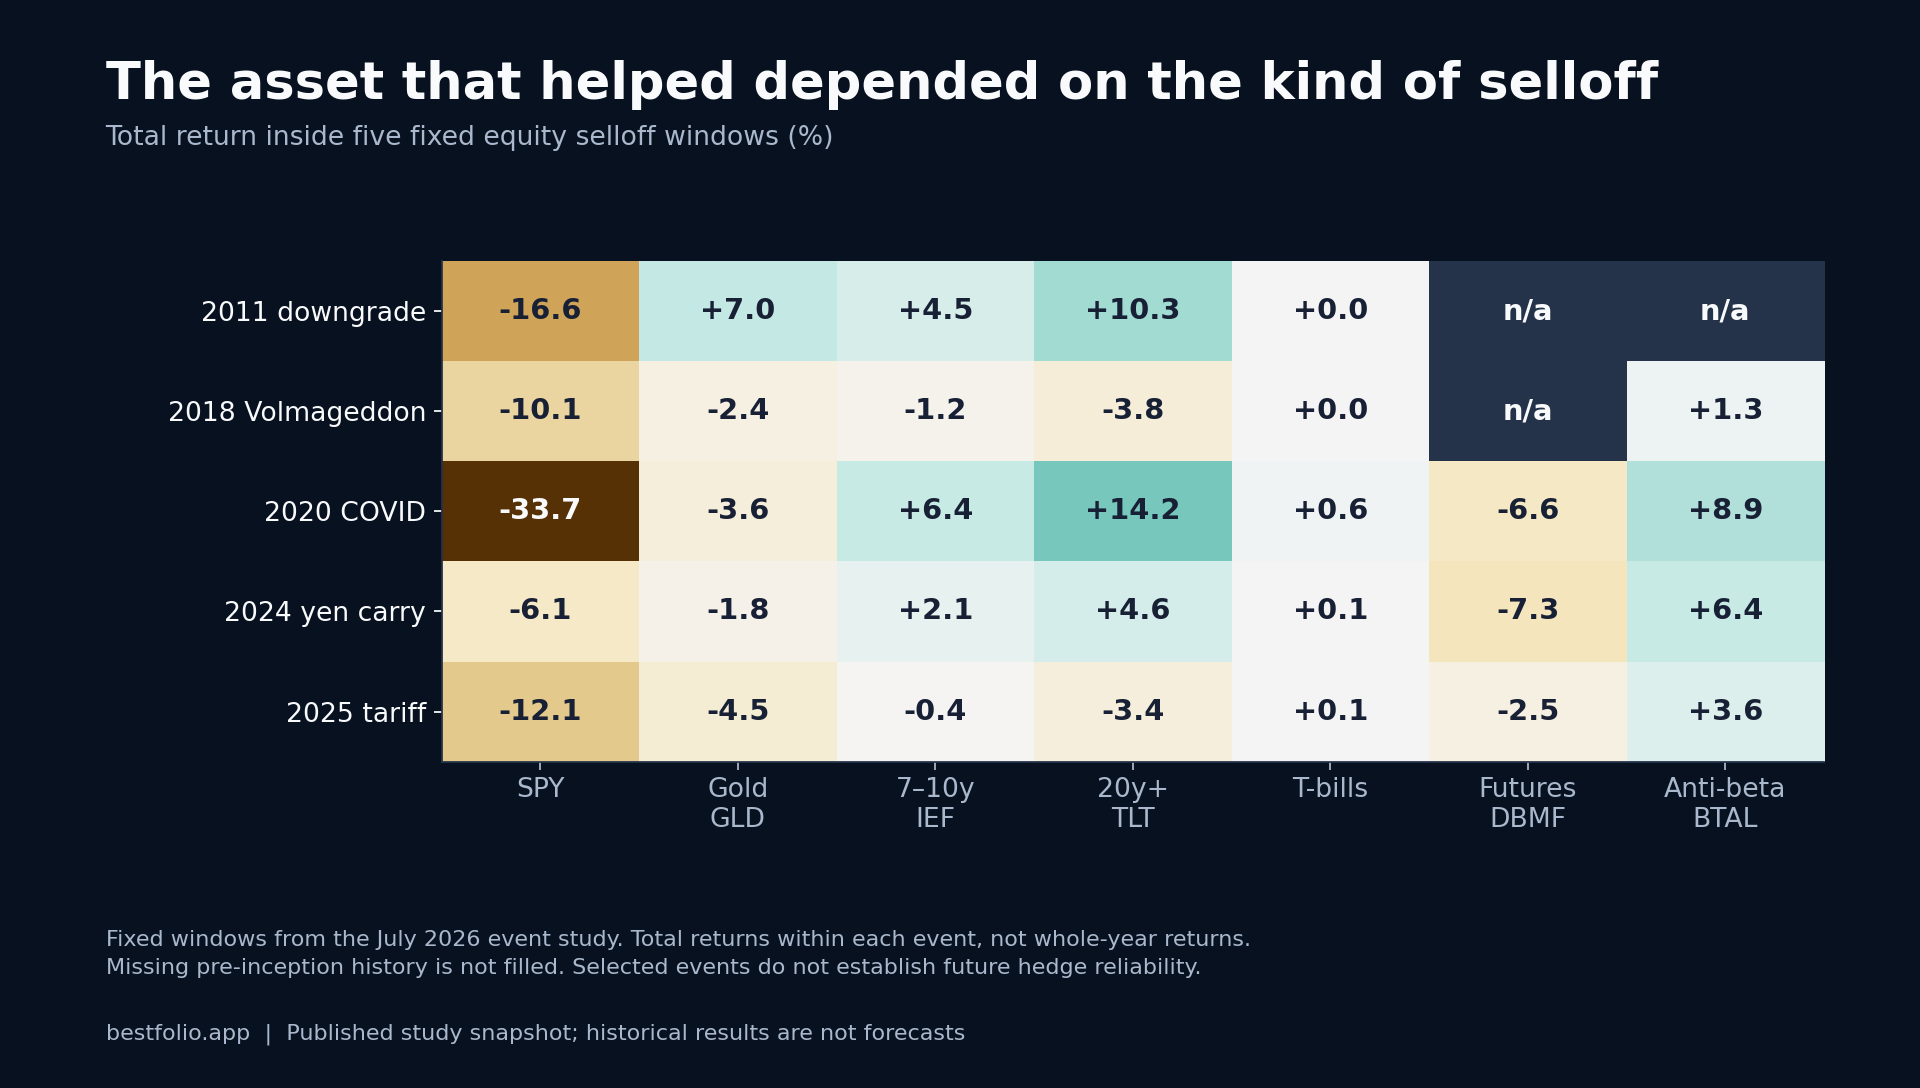
Every retirement calculator assumes you hold a static allocation for 30 years. A r/AllocateSmartly thread asked the obvious question: what if you don't?
Read more →
Morningstar says a third of this year's ETF launches are leveraged and inverse trading tools. The DRAM mania shows why chasing a theme and running a momentum rule are opposite disciplines that look identical from outside.
Read more →
r/LETFs keeps asking for a 2x total-world fund. Four products get close, and they are much more different from each other than their names suggest. We ran all four through 18 years of data.
Read more →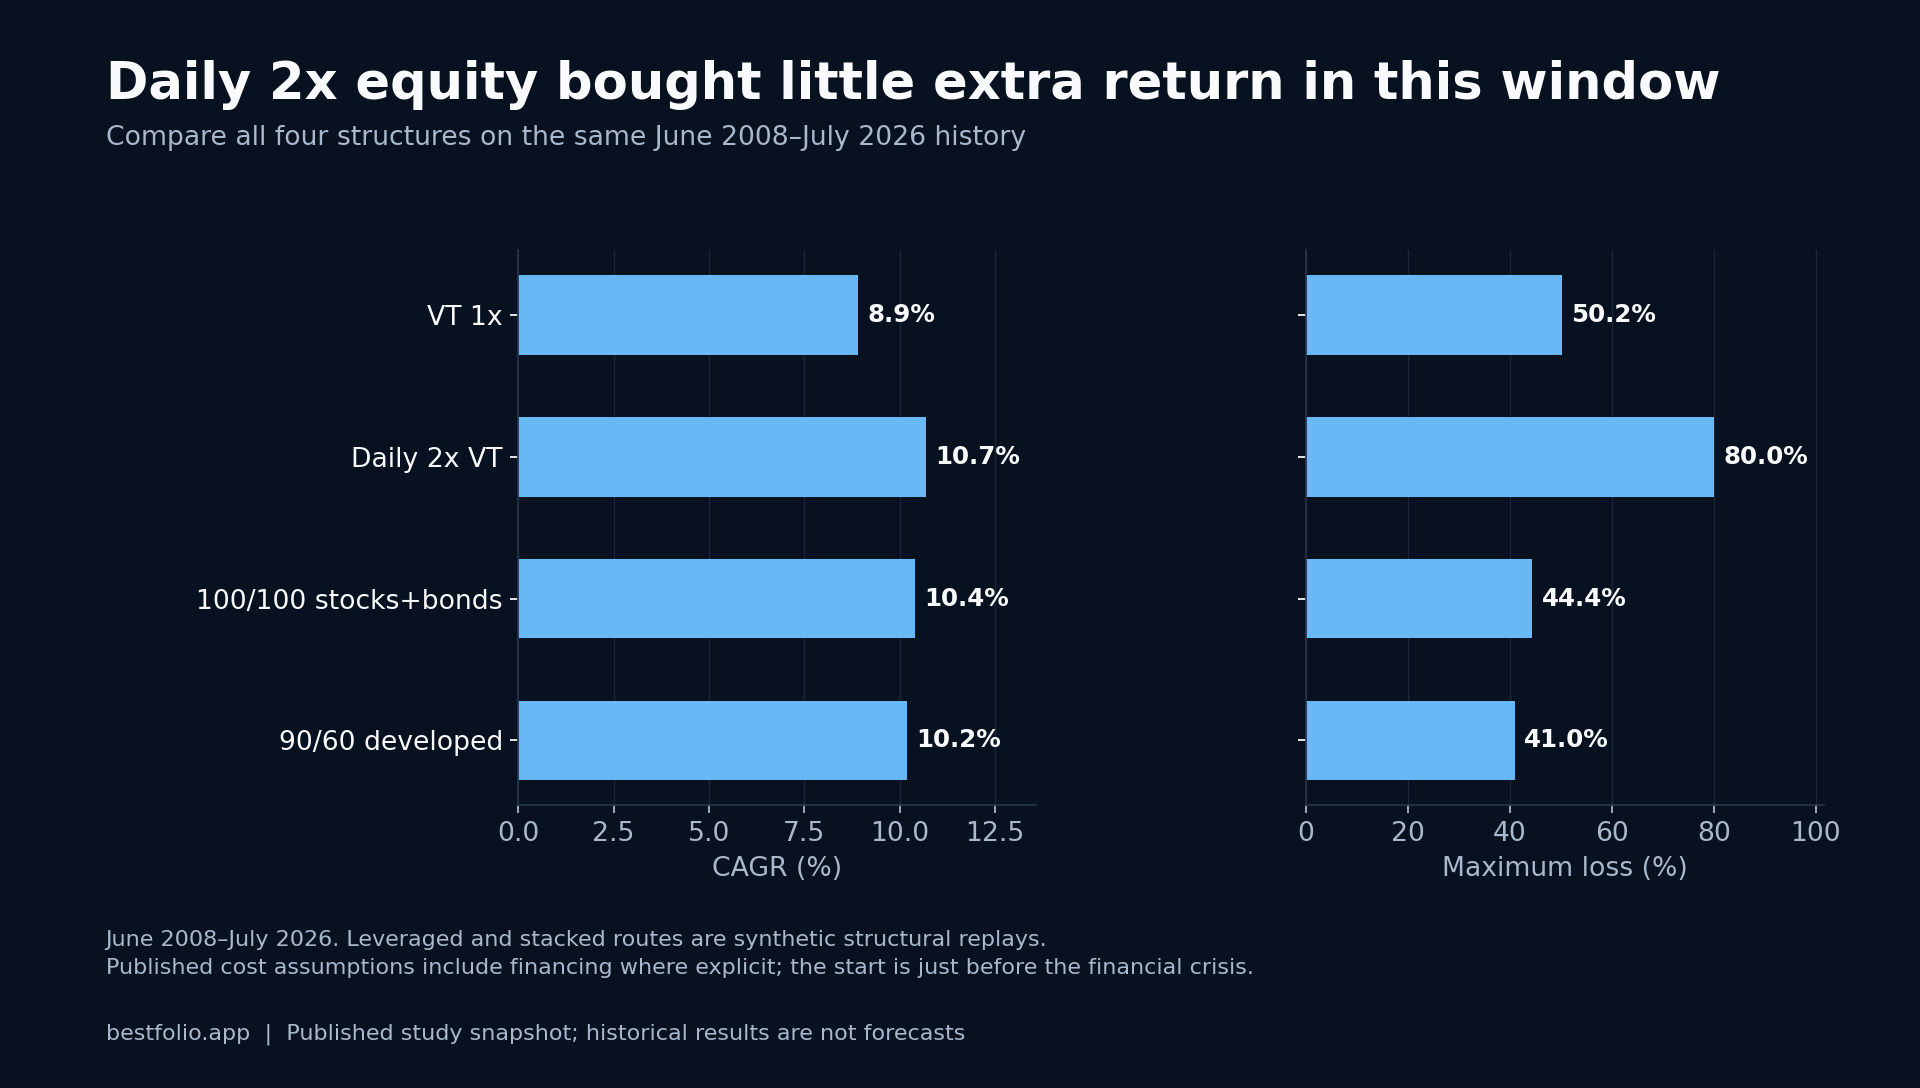
Beyond Passive asked how close you can get to a futures trend program with three plain ETFs and one monthly trend rule. I rebuilt it on our engine back to 1972: the drawdown cut is real, robust to the signal choice, and honest about where the edge comes from.
Read more →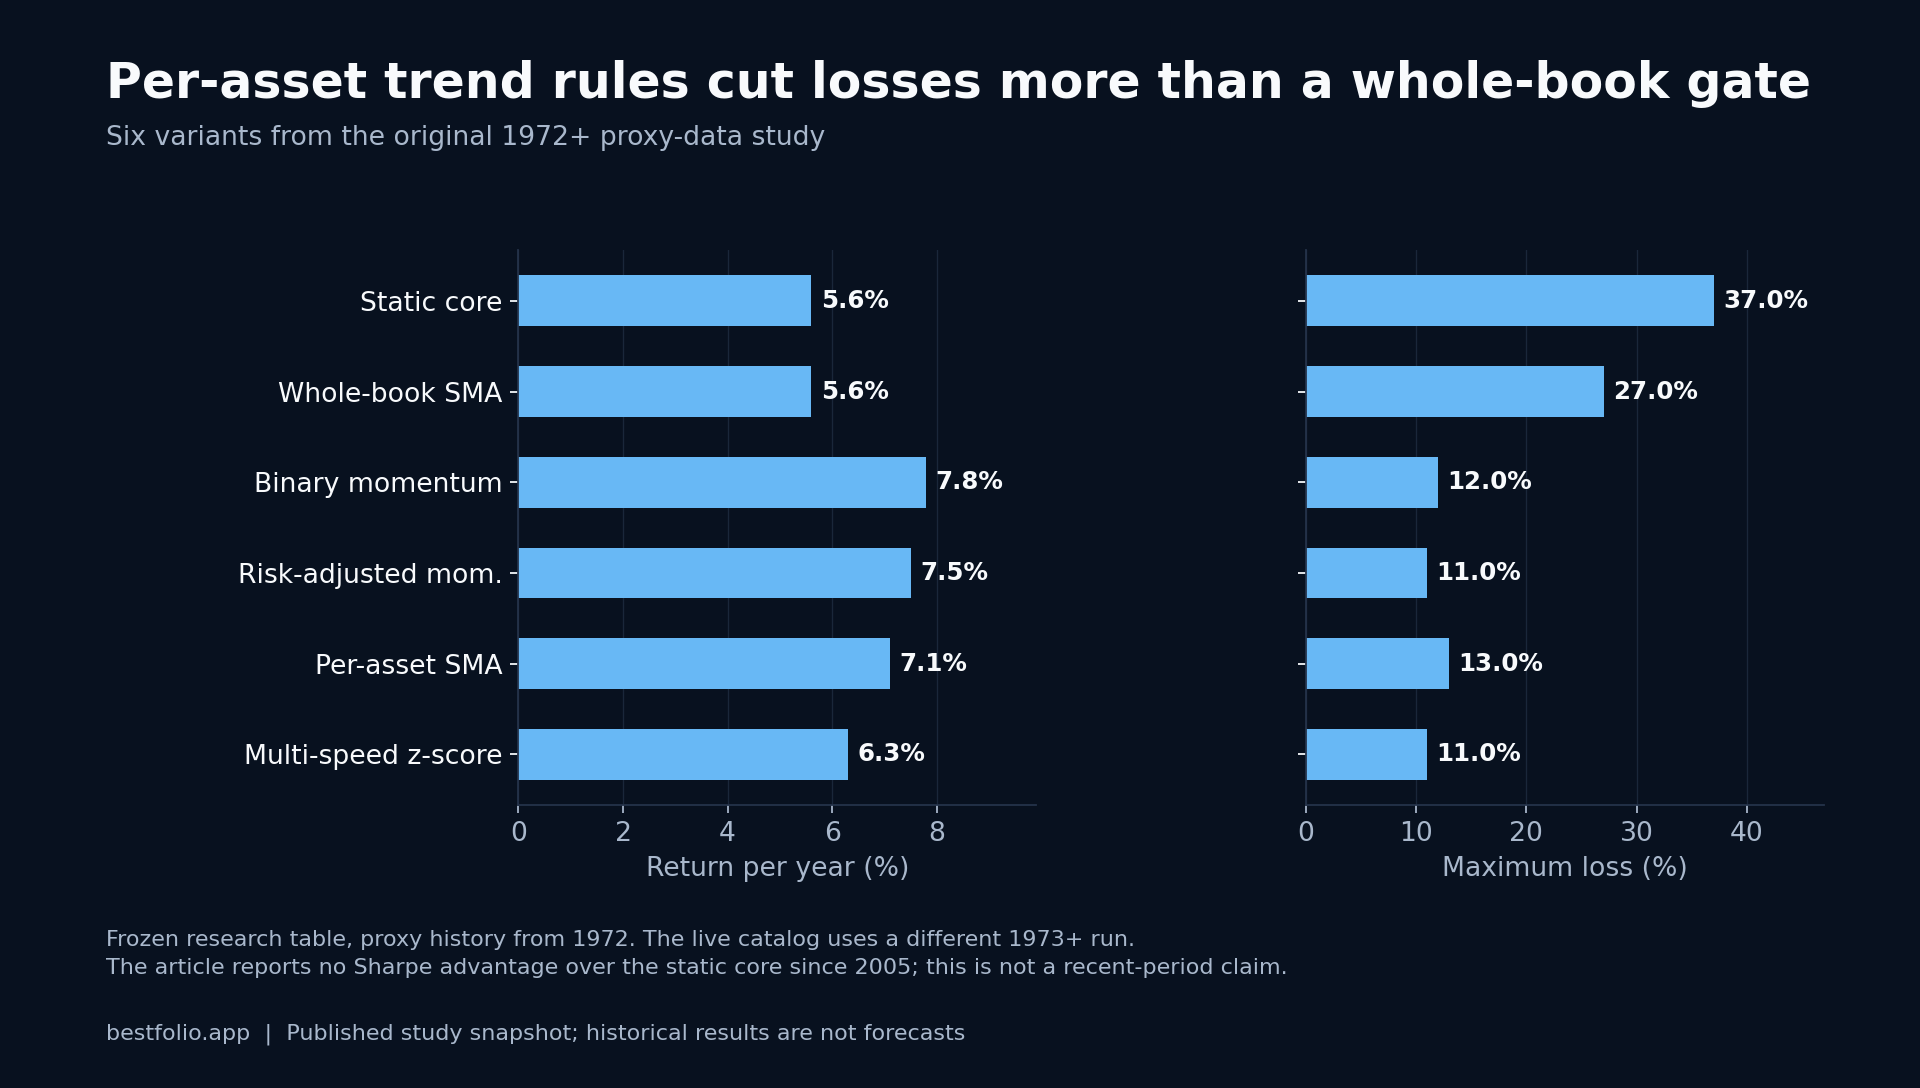
Our latest release is all momentum: five strategies that each measure trend a different way. Three we built in-house, including one we ran back to 1928 to see how a momentum-plus-trend rule survives a full century of crashes. Here is the batch, the backtests, and how they fit together.

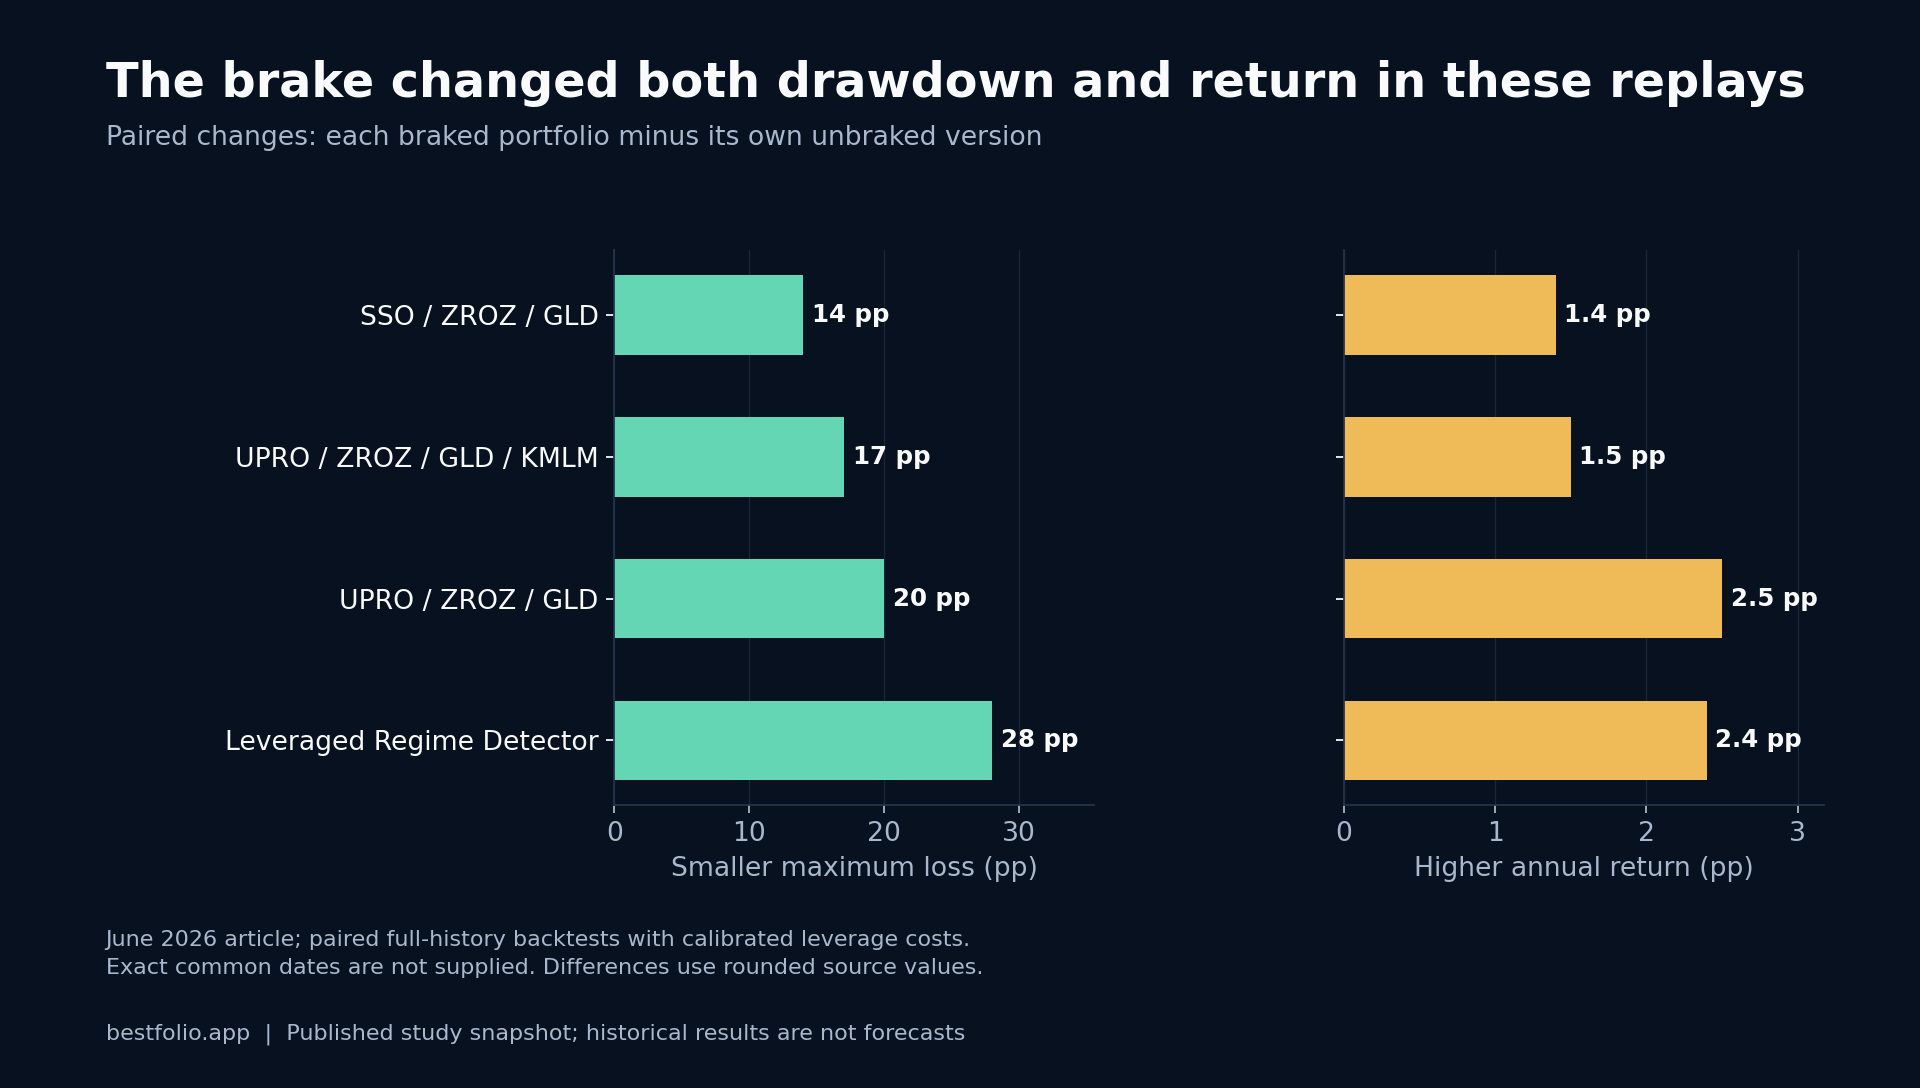
Leveraged portfolios shine for years, then a long bear market can erase a decade of gains. Here is a simple, well-worn trend rule that sidesteps the worst of it, and the braked versions of four popular portfolios we just added.
Founders can now plug Claude or ChatGPT into their strategies, signals, and portfolios, and use an expanded read-only API. Here is what it does and how to switch it on.
Read more →
One sleeve that carries the leverage and the exit at the same time. Plus the UCITS version EU investors asked for the moment I posted it.
Read more →%20with%20the%20king%20of%3C%2Ftext%3E%3Ctext%20x%3D%2236%22%20y%3D%22238%22%20fill%3D%22%23fff%22%20font-family%3D%22Arial%2Csans-serif%22%20font-size%3D%2225%22%20font-weight%3D%22600%22%3Ereturn%20stacking%20(RSST)%3C%2Ftext%3E%3Cg%20fill%3D%22%23eaaa78%22%20color%3D%22%23eaaa78%22%3E%3Crect%20x%3D%22444%22%20y%3D%22127%22%20width%3D%22119%22%20height%3D%22150%22%20rx%3D%2214%22%20fill%3D%22none%22%20stroke%3D%22currentColor%22%20stroke-width%3D%227%22%2F%3E%3Cpath%20d%3D%22M468%20163H539M468%20188H539M468%20213H514%22%20stroke%3D%22currentColor%22%20stroke-width%3D%227%22%2F%3E%3Cpath%20d%3D%22M493%20245L507%20258L543%20223%22%20fill%3D%22none%22%20stroke%3D%22currentColor%22%20stroke-width%3D%227%22%2F%3E%3C%2Fg%3E%3Ctext%20x%3D%2236%22%20y%3D%22368%22%20fill%3D%22%23dce5ee%22%20font-family%3D%22Arial%2Csans-serif%22%20font-size%3D%2213%22%3ERules.%20Evidence.%20Implementation.%3C%2Ftext%3E%3C%2Fsvg%3E)
Pull any strategy's monthly signal as JSON or CSV with an API key, and feed it straight into QuantConnect, an IBKR bot, or a spreadsheet.
Read more →
Rotating into whatever strategy performed best recently is the most requested feature in tactical investing, and the most dangerous one. A deep dive into walk-forward optimization: the rolling out-of-sample engine, the 8 ranking criteria, the max-weight cap, and a real portfolio that runs on it.
Read more →
A few weeks ago we measured safe withdrawal rates across 50+ tactical strategies, and the fairest critique was that our data started in 1990. So we extended HAA's backtest to 1974, through the stagflation that nearly broke the 4% rule. The safe rate came down, and that makes it more believable.
Read more →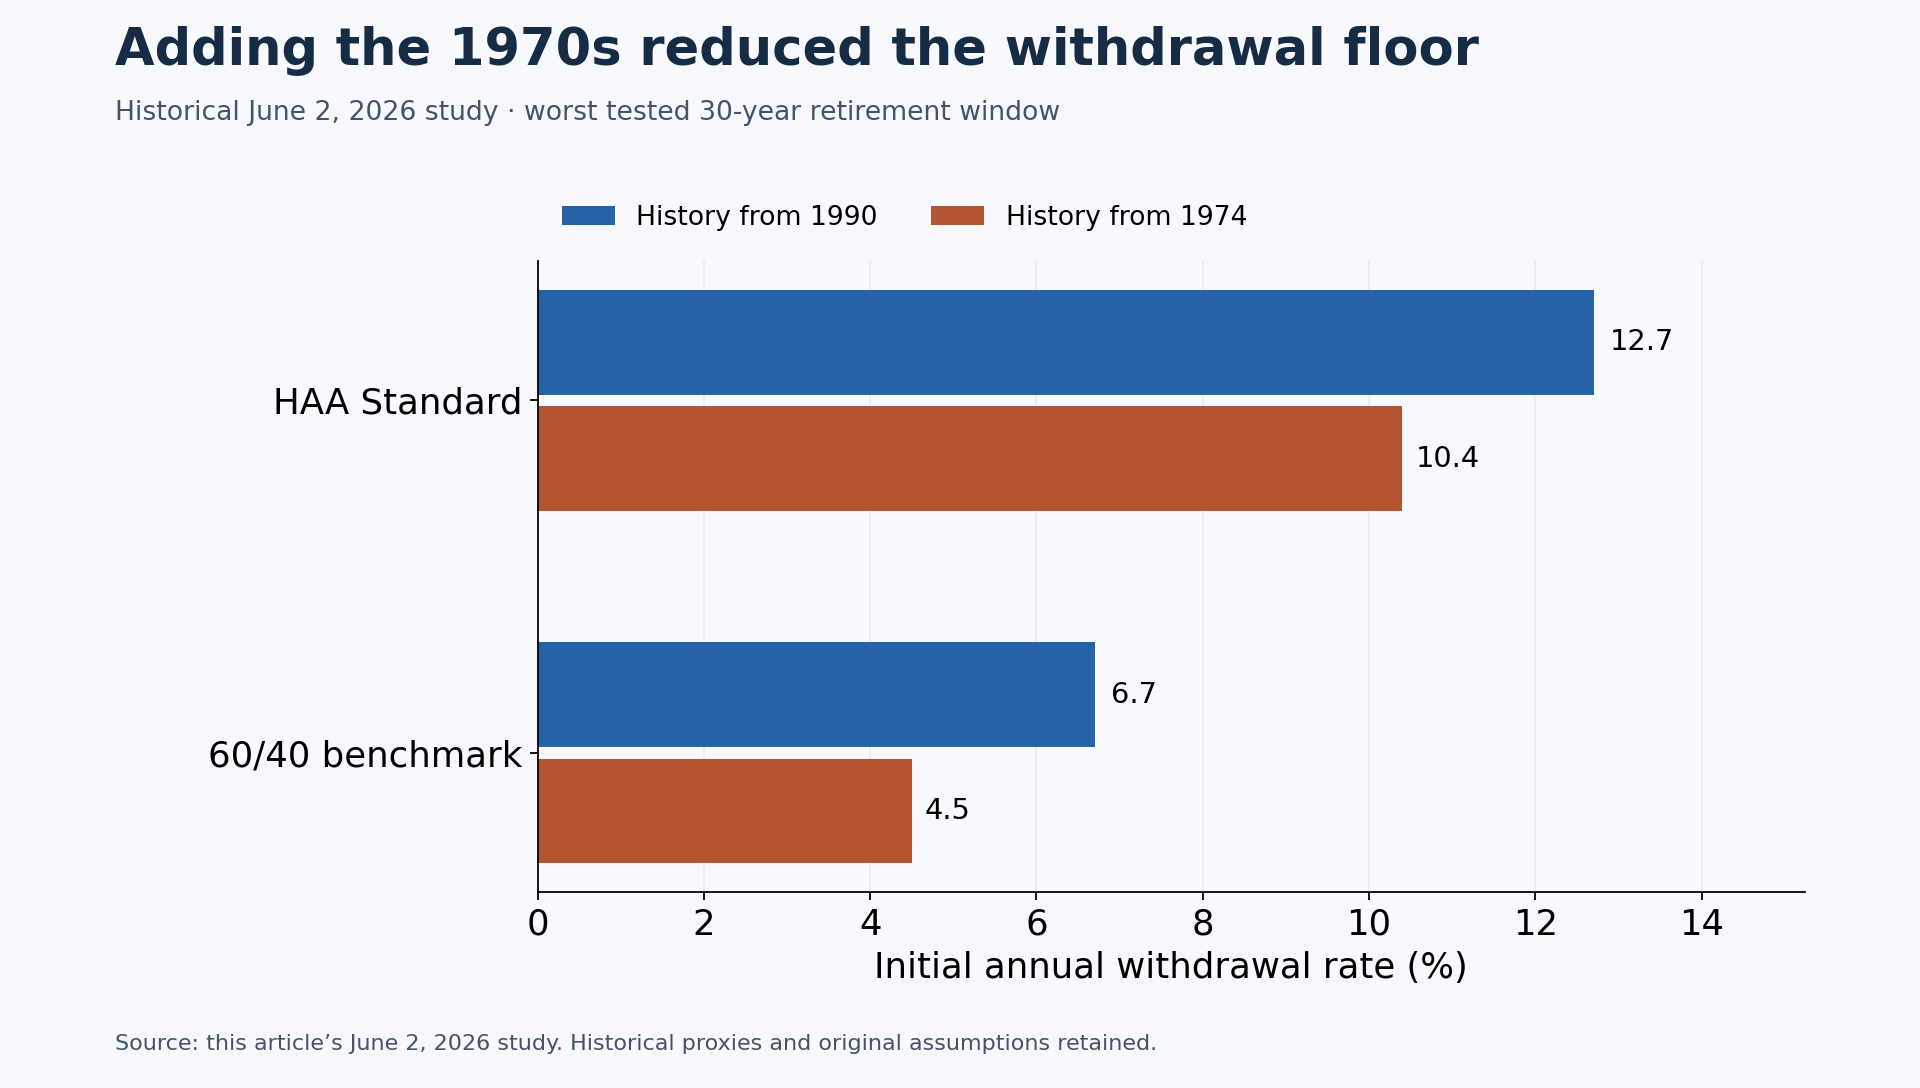
Seven new strategies in the catalog today, six of them leveraged. They span the named names in the r/LETFs community (RNAProf, u/Wongkok, u/Low-Initiative-1327), a published author (David Alan Carter), and two r/LETFs-classic ideas (200d-SMA TQQQ trend and RSI/SMA dip-buying) that BestFolio has stabilized into shipping form. The point of this writeup is not a sales pitch. It is the rule set, what each one does well, and what breaks it. Kelly 3sig/6sig/9sig deliberately held back: the 9sig 99.73% dot-com drawdown makes that family unsuitable for a wider release.
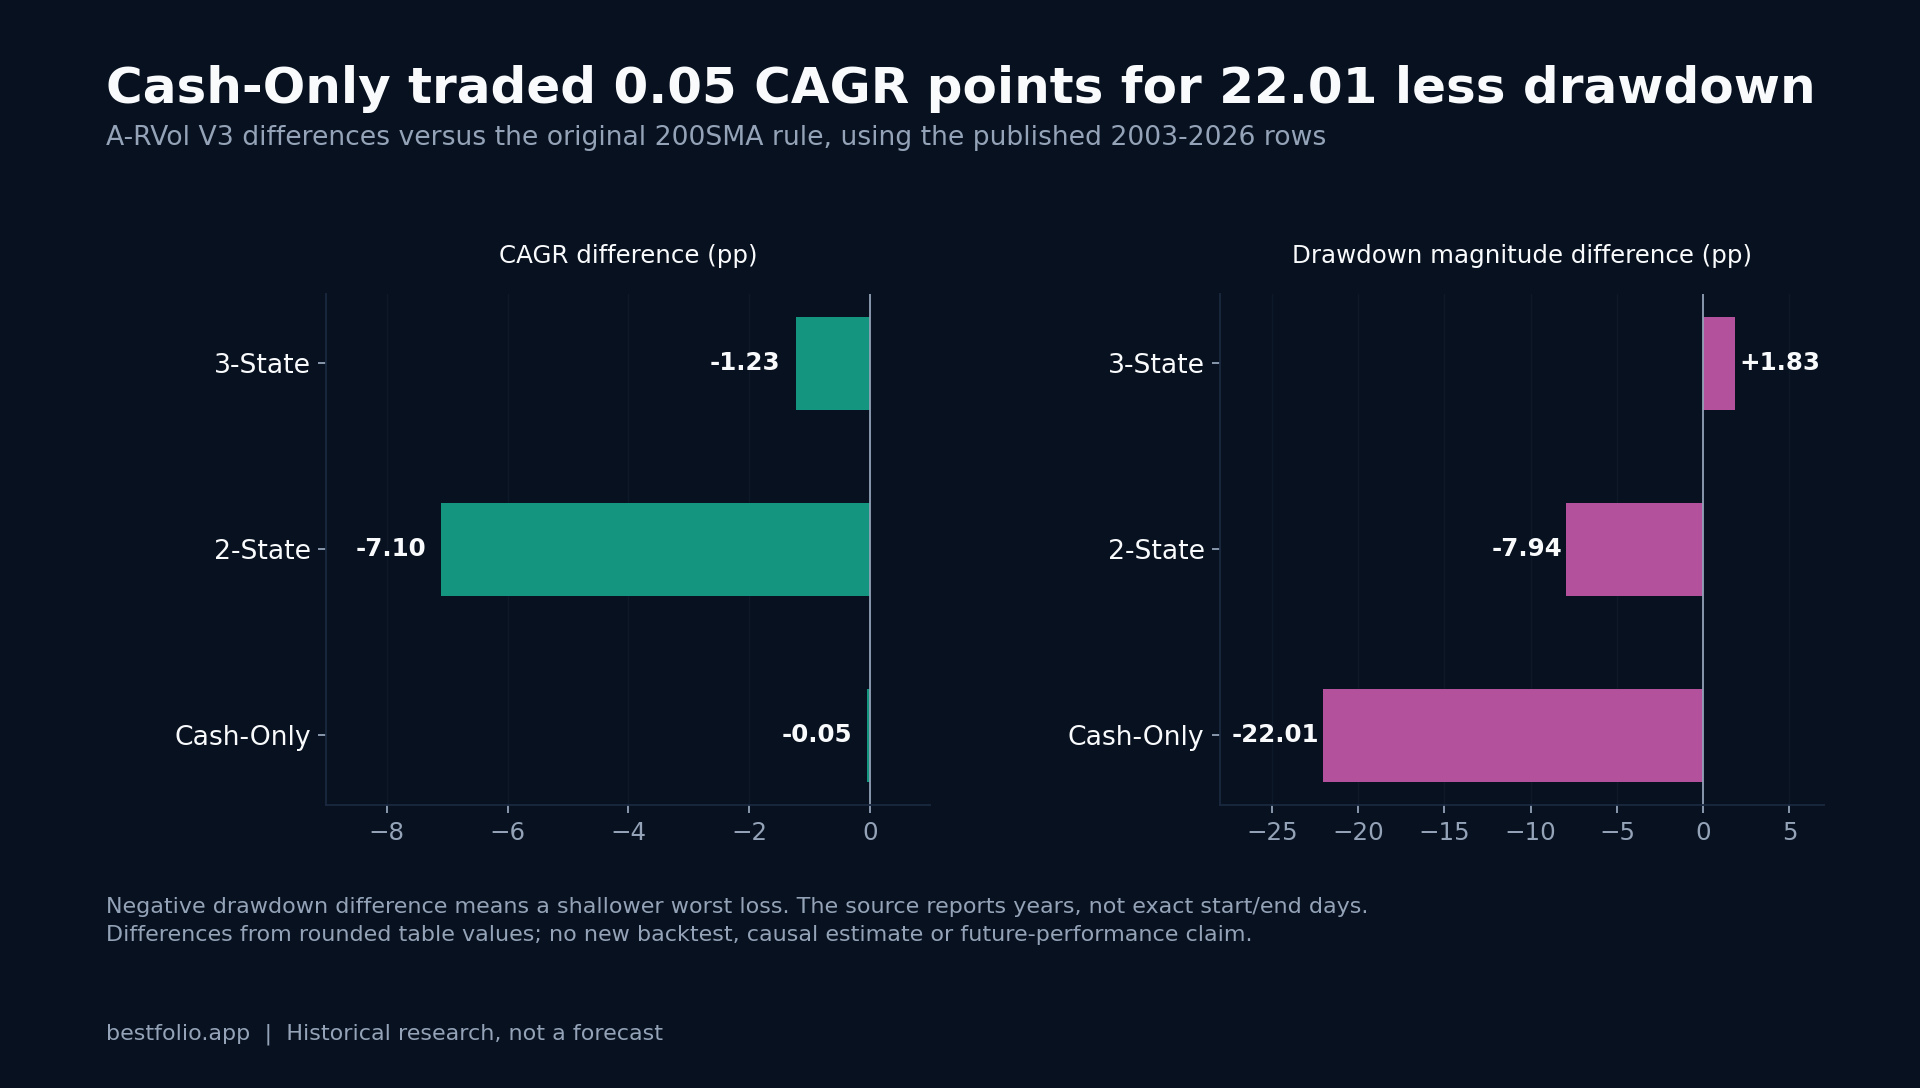
PRIIPs blocks EU retail from AVUV, DBC and most US-domiciled ETFs, so running a US TAA strategy in Europe means substituting UCITS funds. We map every sleeve to a verified UCITS ticker with its ISIN, grade the substitution tier by tier, and flag the ones where the European version is a different strategy.

We computed Bengen-style rolling 30-year safe withdrawal rates for 80 variants across 51 published TAA strategies. Every single one clears 4%. The best unleveraged TAA strategies (VAA-G4 SmartStack 15.3%, HAA SmartStack 14.2%) sustain real withdrawal rates 3-4x higher than Classic 60/40. Why TAA defeats sequence-of-returns risk, and four honest reasons you should still anchor your retirement plan closer to 4% than 15%.
%3C%2Ftext%3E%3Cg%20fill%3D%22%233bbda7%22%20color%3D%22%233bbda7%22%3E%3Crect%20x%3D%22436%22%20y%3D%22133%22%20width%3D%22131%22%20height%3D%22139%22%20rx%3D%2214%22%20fill%3D%22none%22%20stroke%3D%22currentColor%22%20stroke-width%3D%227%22%2F%3E%3Cpath%20d%3D%22M436%20170H567M468%20121V146M536%20121V146%22%20stroke%3D%22currentColor%22%20stroke-width%3D%227%22%2F%3E%3Ccircle%20cx%3D%22470%22%20cy%3D%22205%22%20r%3D%228%22%2F%3E%3Ccircle%20cx%3D%22507%22%20cy%3D%22205%22%20r%3D%228%22%2F%3E%3Ccircle%20cx%3D%22544%22%20cy%3D%22205%22%20r%3D%228%22%2F%3E%3Ccircle%20cx%3D%22470%22%20cy%3D%22241%22%20r%3D%228%22%2F%3E%3Ccircle%20cx%3D%22507%22%20cy%3D%22241%22%20r%3D%228%22%2F%3E%3C%2Fg%3E%3Ctext%20x%3D%2236%22%20y%3D%22368%22%20fill%3D%22%23dce5ee%22%20font-family%3D%22Arial%2Csans-serif%22%20font-size%3D%2213%22%3ERules.%20Evidence.%20Implementation.%3C%2Ftext%3E%3C%2Fsvg%3E)
Five strategies, two static cores plus three tactical satellites, blended at 60/40. The result is Sharpe 1.07 and a -19% maximum drawdown over 33 years, both better than any of the five components held alone. Includes a verified RSST simplification path.
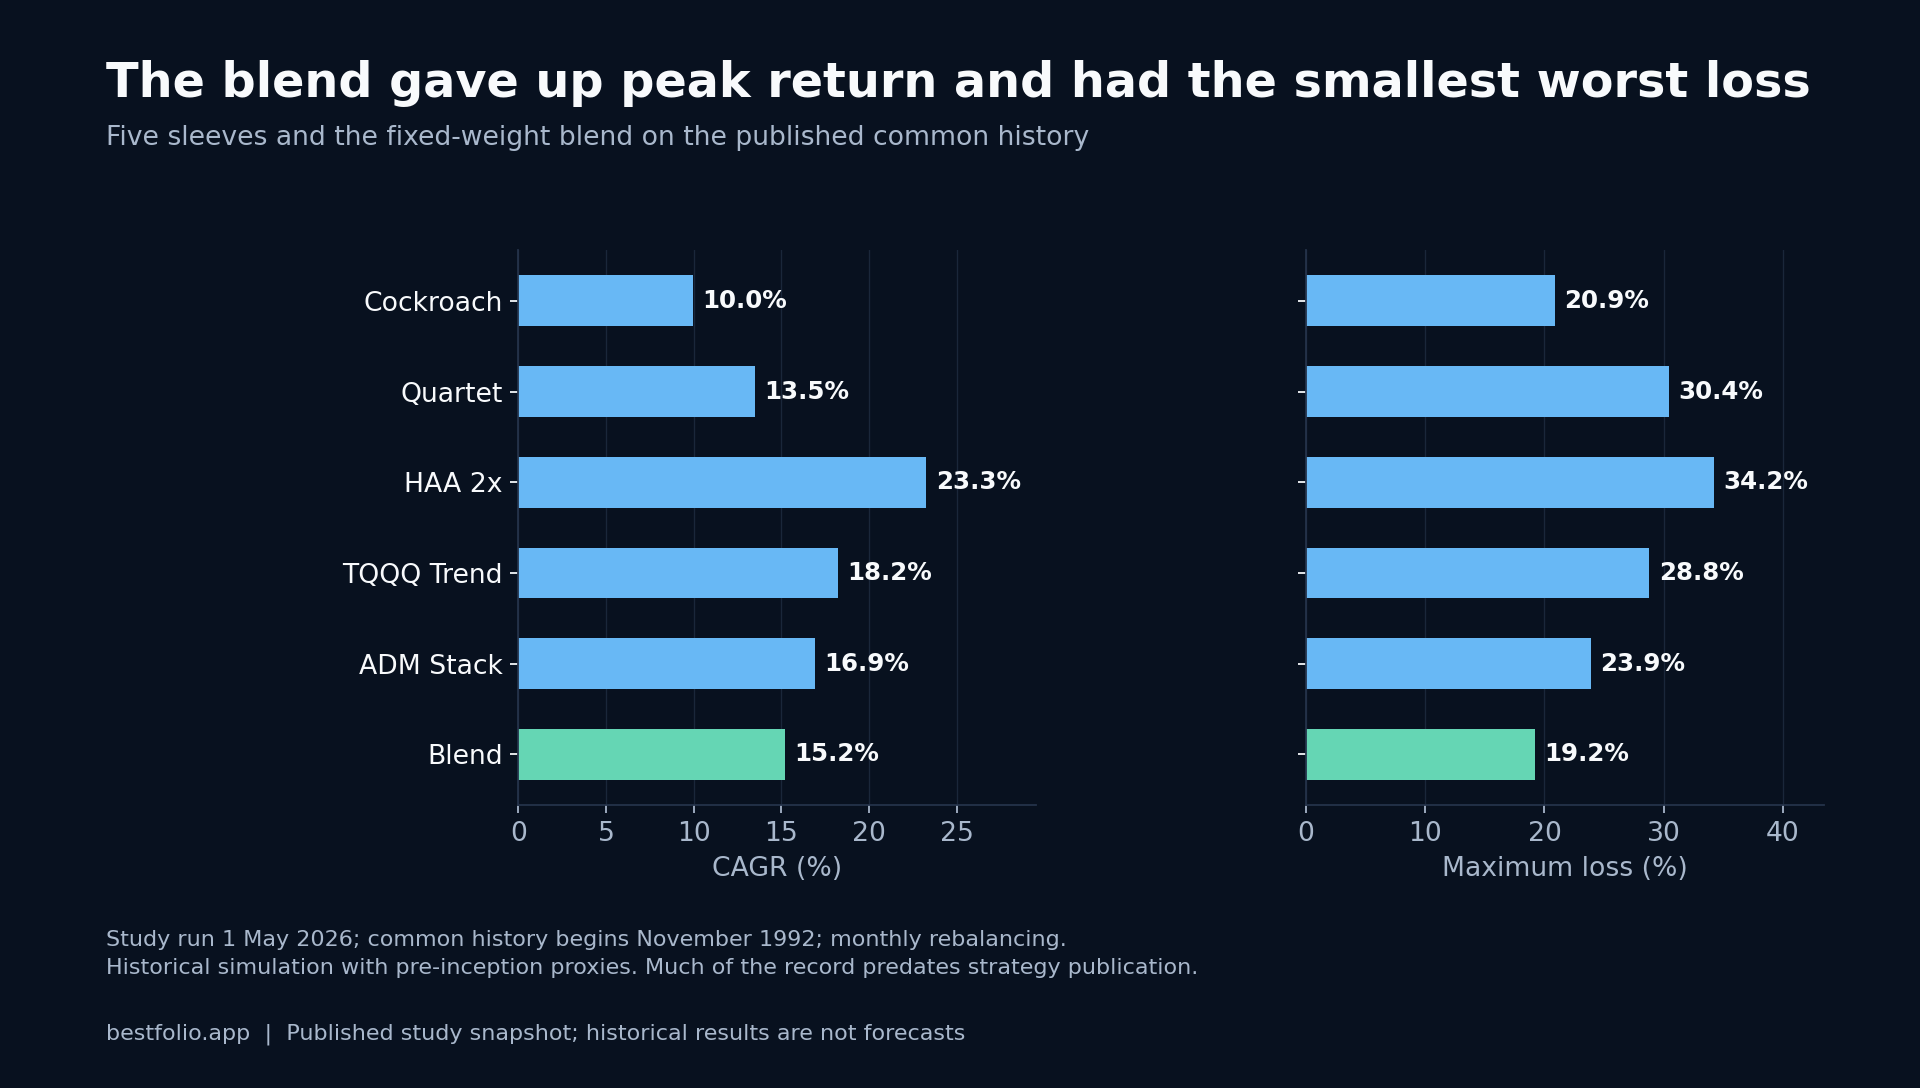
Once a month we ship a small batch of new strategies. May is diversification month. Five strategies, four classic ways a portfolio can fall apart, one BestFolio Original. Here is what we released, how each performs over 30 to 40 years, and how they complement each other in a blended portfolio.

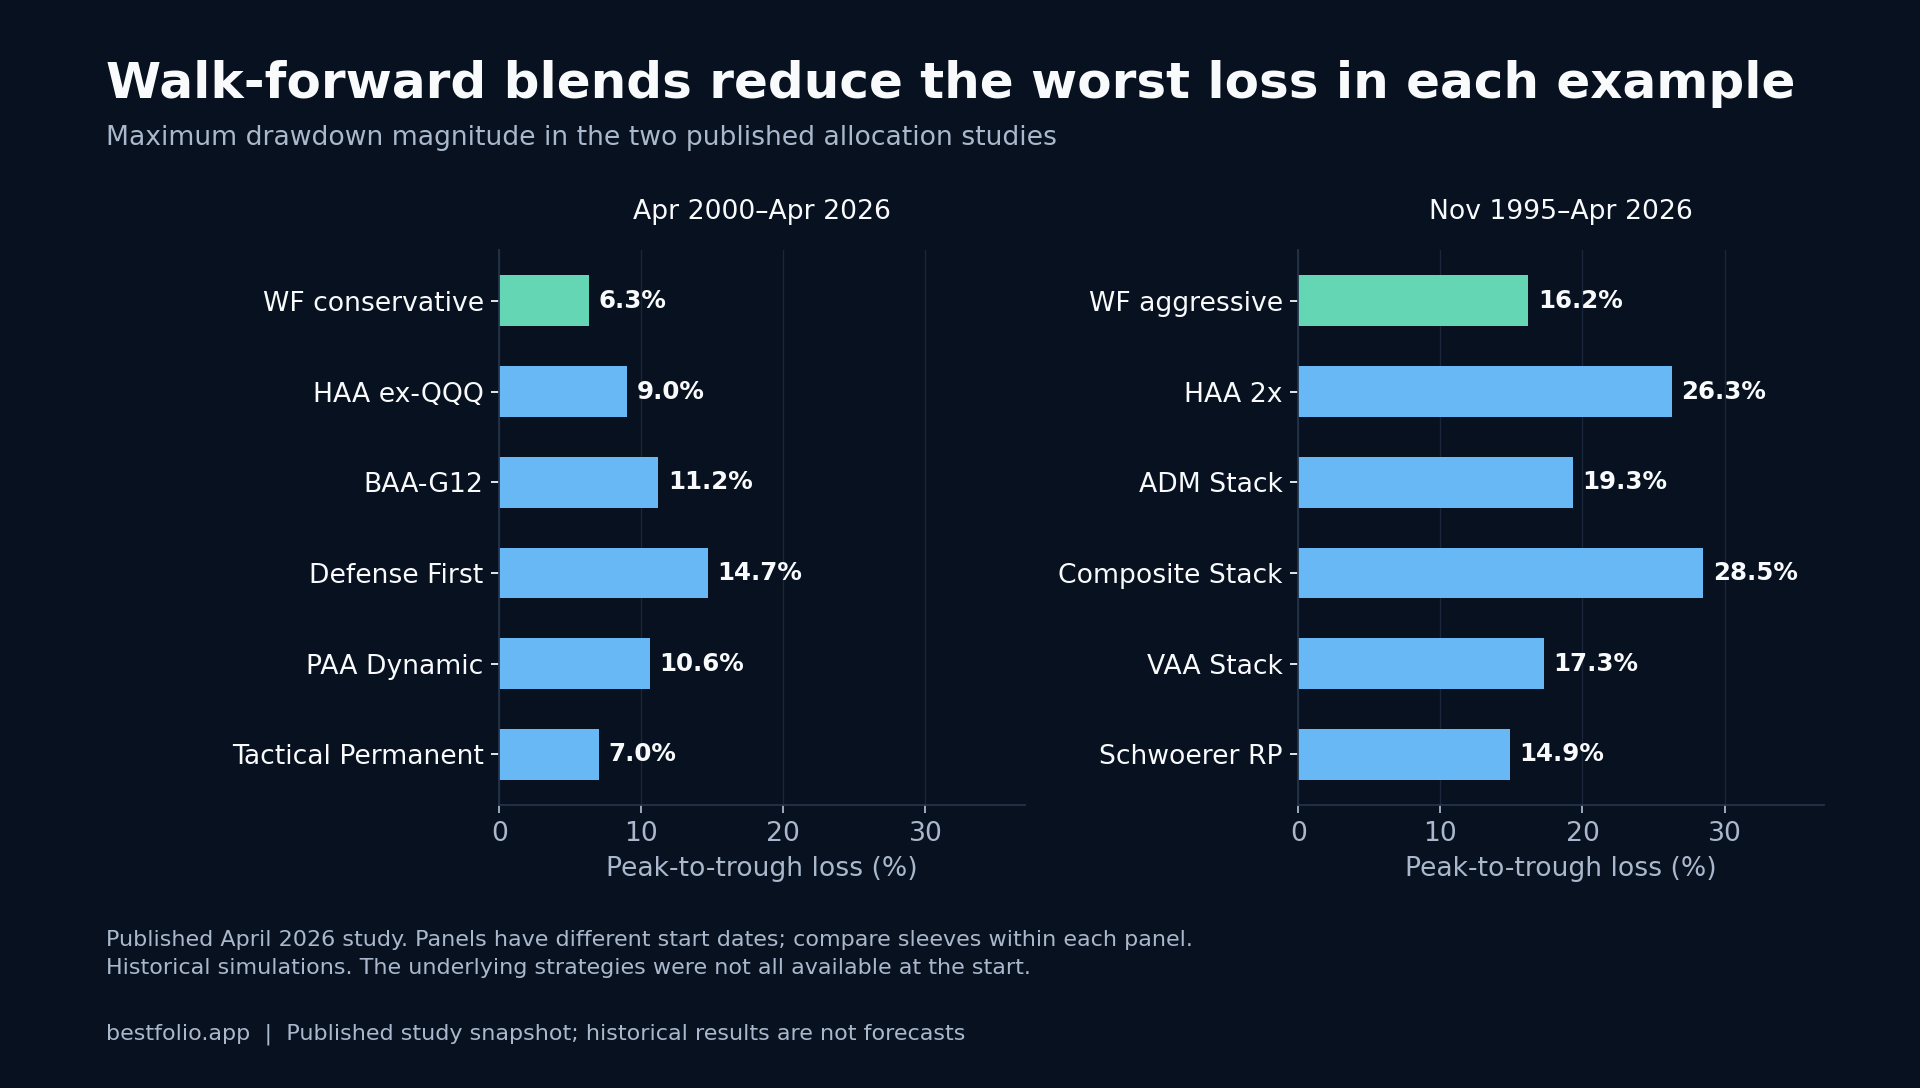
What if you ran five tactical strategies side by side and let the data decide every month which deserve more weight? Two real walk-forward portfolios, 26 to 30 years out-of-sample. Conservative sleeve: 9.3% CAGR with -6.3% max drawdown. Aggressive sleeve: 19.8% CAGR over 30 years.
2022 was the cleanest A/B test the tactical asset allocation community is ever going to get. Classic dual momentum strategies (GEM, ADM, CDM) lost between 10 and 24 percent. Three Keller canary-family strategies (BAA-G4, BAA-G12, HAA) closed the year with positive returns. Same tactical framework, completely different design choices, and a lesson about which defensive asset actually defends when the "safe haven" bond is the thing falling.

Portfolio Visualizer is the most-cited free portfolio research tool, and for good reason. But research and implementation are different problems. Here is an honest, side-by-side look at where Portfolio Visualizer excels, where BestFolio is built differently, and how to decide which tool fits your workflow.
Read more →
What is 9Sig and does it work? We ran Jason Kelly's rules on observed TQQQ and AGG since 2010 (39.4% CAGR) and on a pre-inception 3x QQQ simulation through the dot-com crash (99.7% drawdown). Full numbers, 2,000 bootstrap scenarios, and why it sits in our rejection log.
Read more →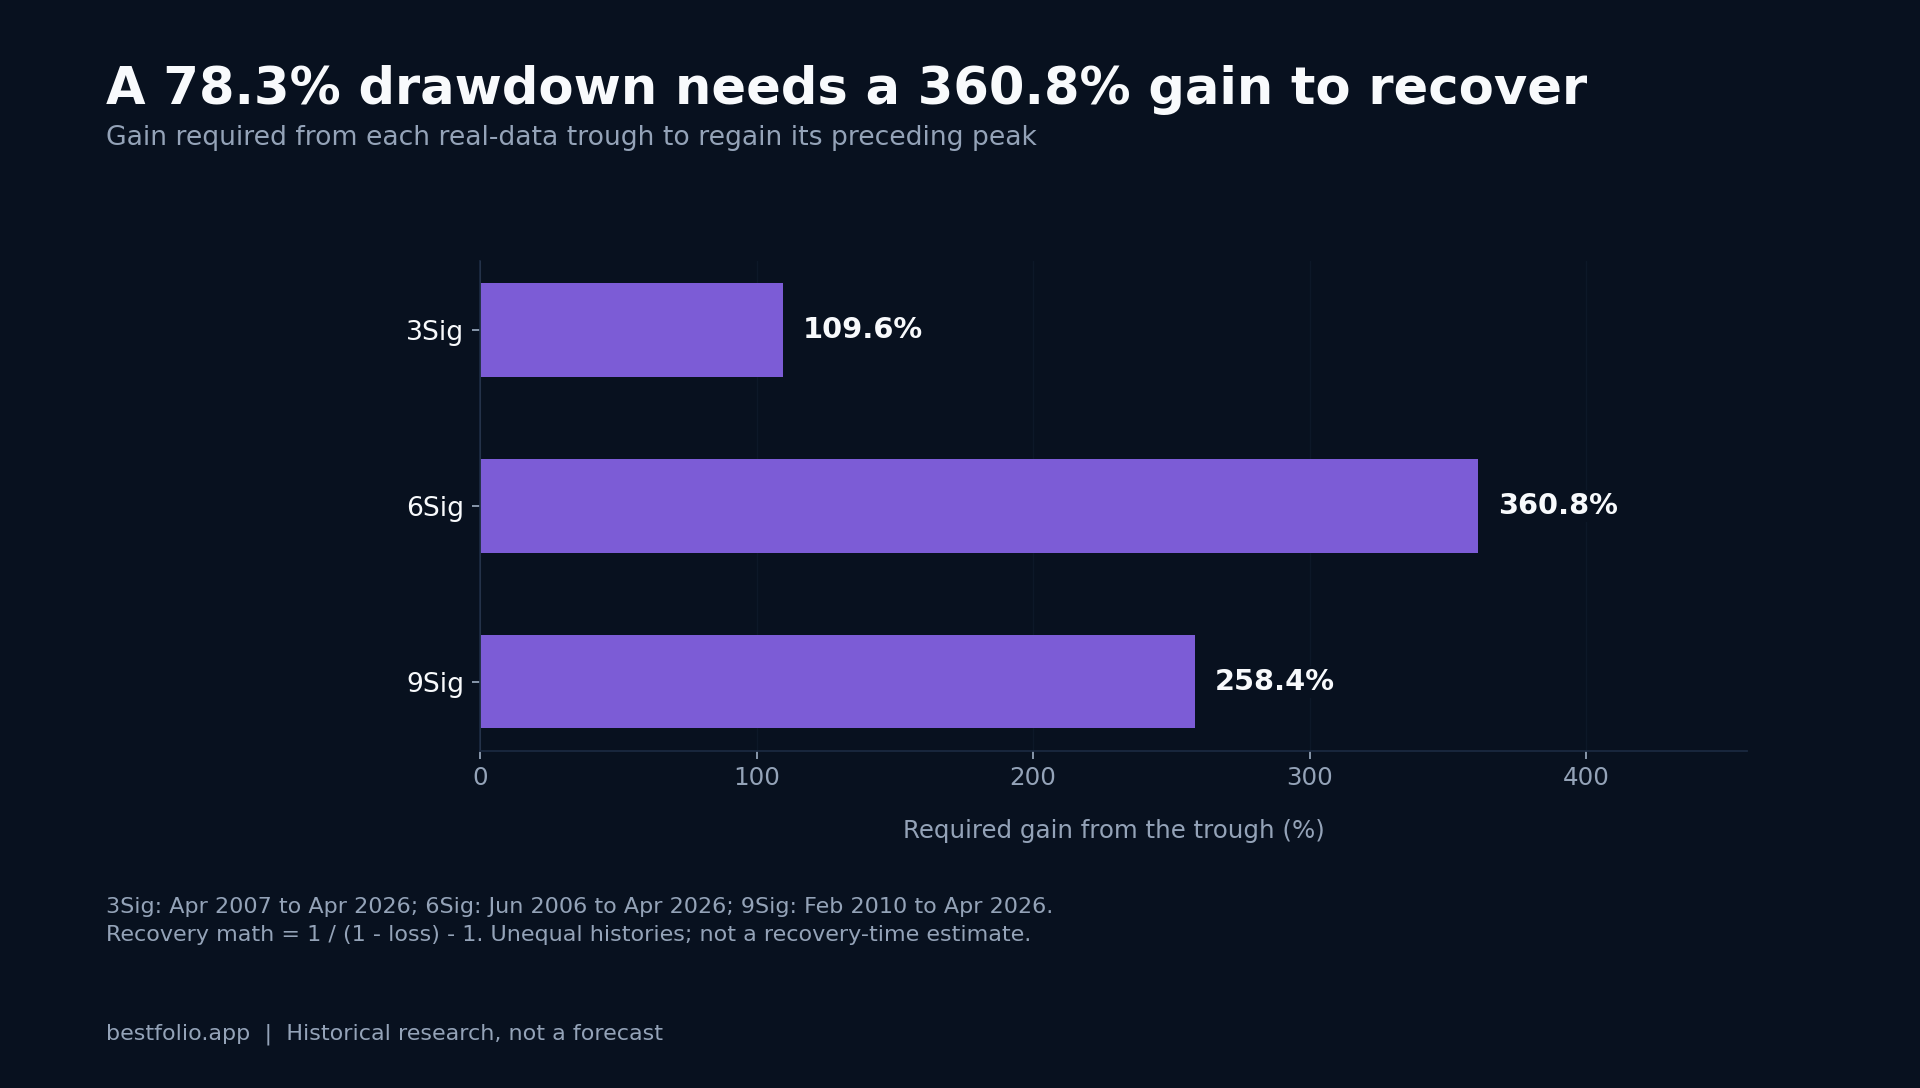
Classic diversification has felt like a tax for a decade — because funding it by selling equities in a bull run is the wrong question. A new Quantica Capital paper (March 2026) reframes it as a stacking problem, and spells out exactly why we built SmartStack™: layer gold and managed futures on top of any TAA strategy without selling what is working, using leveraged ETFs at fractional weight. No margin, no futures account.

Most investors have no idea what factor bets they are actually making. FactorLens runs a six-factor regression with US, developed-market, and emerging-market benchmarks, then shows where the portfolio's returns come from.
Read more →
We built four new strategies from scratch — including Composite Momentum, which achieves a Sharpe ratio above 1.0 over 25+ years. Plus a community-sourced Golden Ratio portfolio. Here is how we designed them.
Read more →
European TAA broker fees checked September 15, 2026: commissions, FX minimums, instrument availability and the cost of a monthly rebalance.
Read more →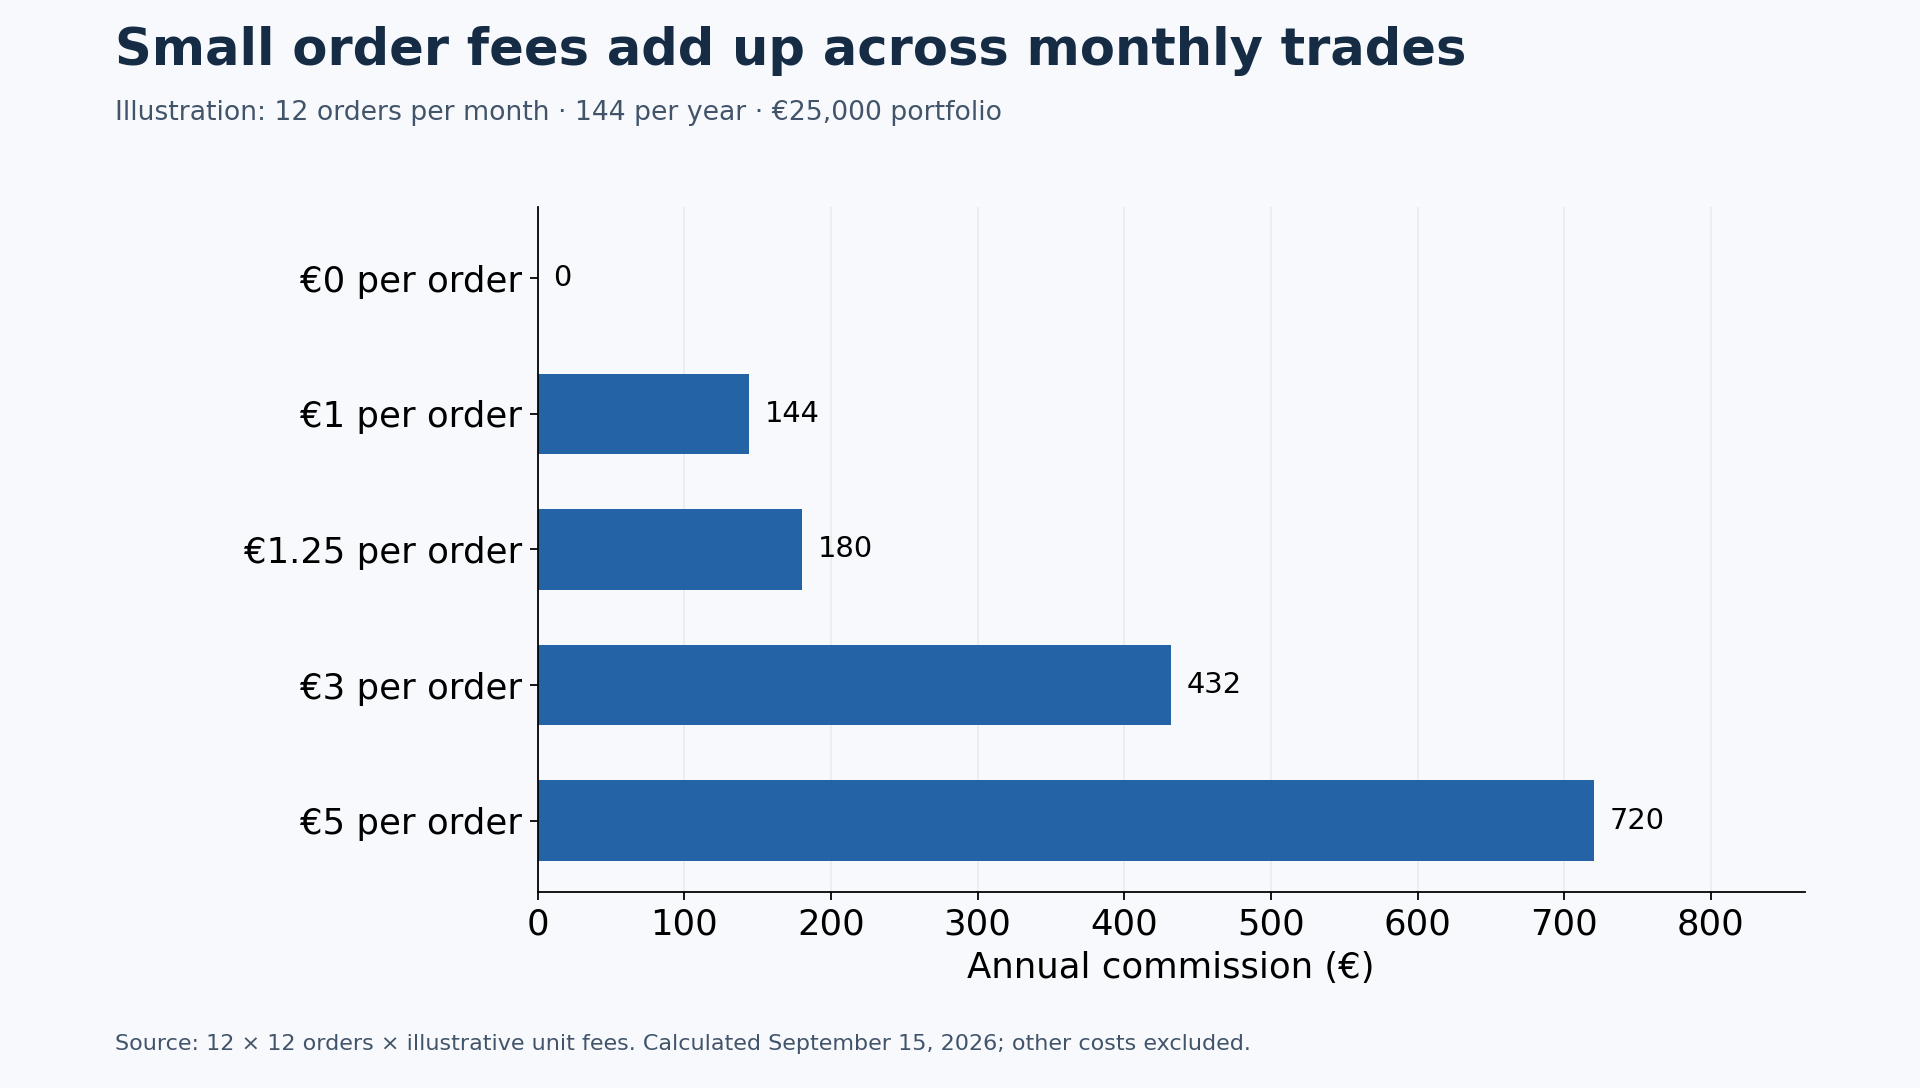
Tactical strategies involve more trades than buy-and-hold. Between commissions, spreads, subscription tools, and whole-share constraints, what is the smallest portfolio where TAA still makes sense? We run the numbers.

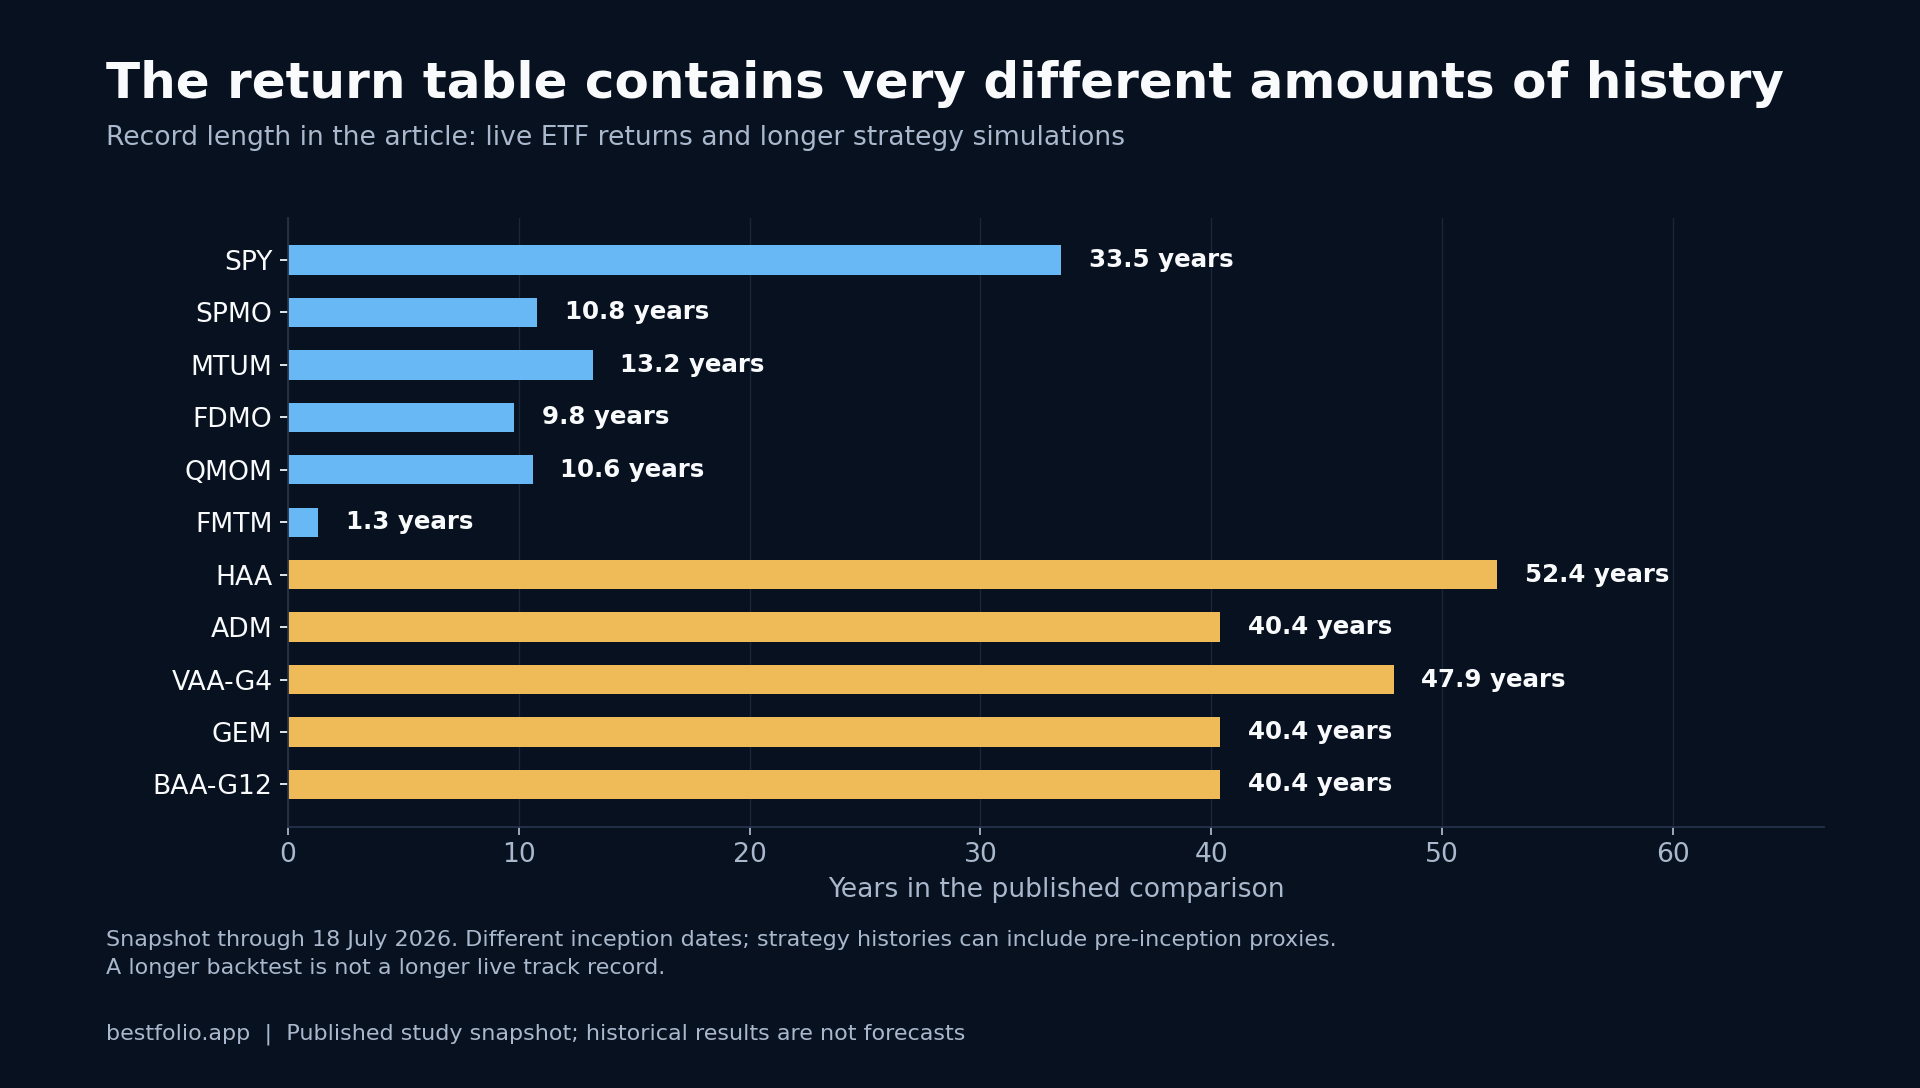
SPMO: 18.9% CAGR since 2015. FMTM is a MarketDesk fund launched in 2025, not Fidelity's FDMO. We match the live windows and compare both to tactical momentum.
The Golden Butterfly enhances Harry Browne's Permanent Portfolio by replacing the cash allocation with small cap value stocks — historically the highest-returning equity factor. With a 7.9% CAGR and just -19.9% max drawdown over 25 years, the Golden Butterfly offers a compelling middle ground between safety-first fixed allocations and aggressive growth strategies.
Read more →
The Permanent Portfolio divides your money equally among stocks, long-term bonds, gold, and cash — four assets designed to thrive in different economic environments. Created by Harry Browne in the 1980s, this fixed allocation strategy has delivered steady 7.1% annual returns with remarkably low drawdowns, making it a favorite among conservative investors seeking simplicity and resilience.
Read more →
Global Equities Momentum (GEM) is Gary Antonacci's flagship dual momentum strategy that rotates between U.S. stocks, international stocks, and bonds based on 12-month returns. With a backtest CAGR of 11.3% and a systematic approach to avoiding bear markets, GEM remains one of the most popular tactical asset allocation strategies for individual investors.
Read more →%20%E2%80%94%20The%20Dual%3C%2Ftext%3E%3Ctext%20x%3D%2236%22%20y%3D%22238%22%20fill%3D%22%23fff%22%20font-family%3D%22Arial%2Csans-serif%22%20font-size%3D%2225%22%20font-weight%3D%22600%22%3EMomentum%20Classic%20That%3C%2Ftext%3E%3Ctext%20x%3D%2236%22%20y%3D%22270%22%20fill%3D%22%23fff%22%20font-family%3D%22Arial%2Csans-serif%22%20font-size%3D%2225%22%20font-weight%3D%22600%22%3EChanged%20ETF%20Investing%3C%2Ftext%3E%3Cg%20fill%3D%22%23eaaa78%22%20color%3D%22%23eaaa78%22%3E%3Crect%20x%3D%22438%22%20y%3D%22137%22%20width%3D%2276%22%20height%3D%2276%22%20rx%3D%2210%22%2F%3E%3Crect%20x%3D%22524%22%20y%3D%22137%22%20width%3D%2246%22%20height%3D%2276%22%20rx%3D%2210%22%20opacity%3D%22.55%22%2F%3E%3Crect%20x%3D%22438%22%20y%3D%22223%22%20width%3D%2246%22%20height%3D%2246%22%20rx%3D%2210%22%20opacity%3D%22.55%22%2F%3E%3Crect%20x%3D%22494%22%20y%3D%22223%22%20width%3D%2276%22%20height%3D%2246%22%20rx%3D%2210%22%20opacity%3D%22.8%22%2F%3E%3C%2Fg%3E%3Ctext%20x%3D%2236%22%20y%3D%22368%22%20fill%3D%22%23dce5ee%22%20font-family%3D%22Arial%2Csans-serif%22%20font-size%3D%2213%22%3ERules.%20Evidence.%20Implementation.%3C%2Ftext%3E%3C%2Fsvg%3E)
Market crises are inevitable. Tactical asset allocation strategies use momentum, trend, and volatility signals to systematically reduce exposure before the worst damage is done. Here is how TAA performed during four major crises.

GEM, ADM and CDM compared from December 1987 through August 2026: shared-window returns, month-end drawdowns, rule differences and historical-proxy limits.
Read more →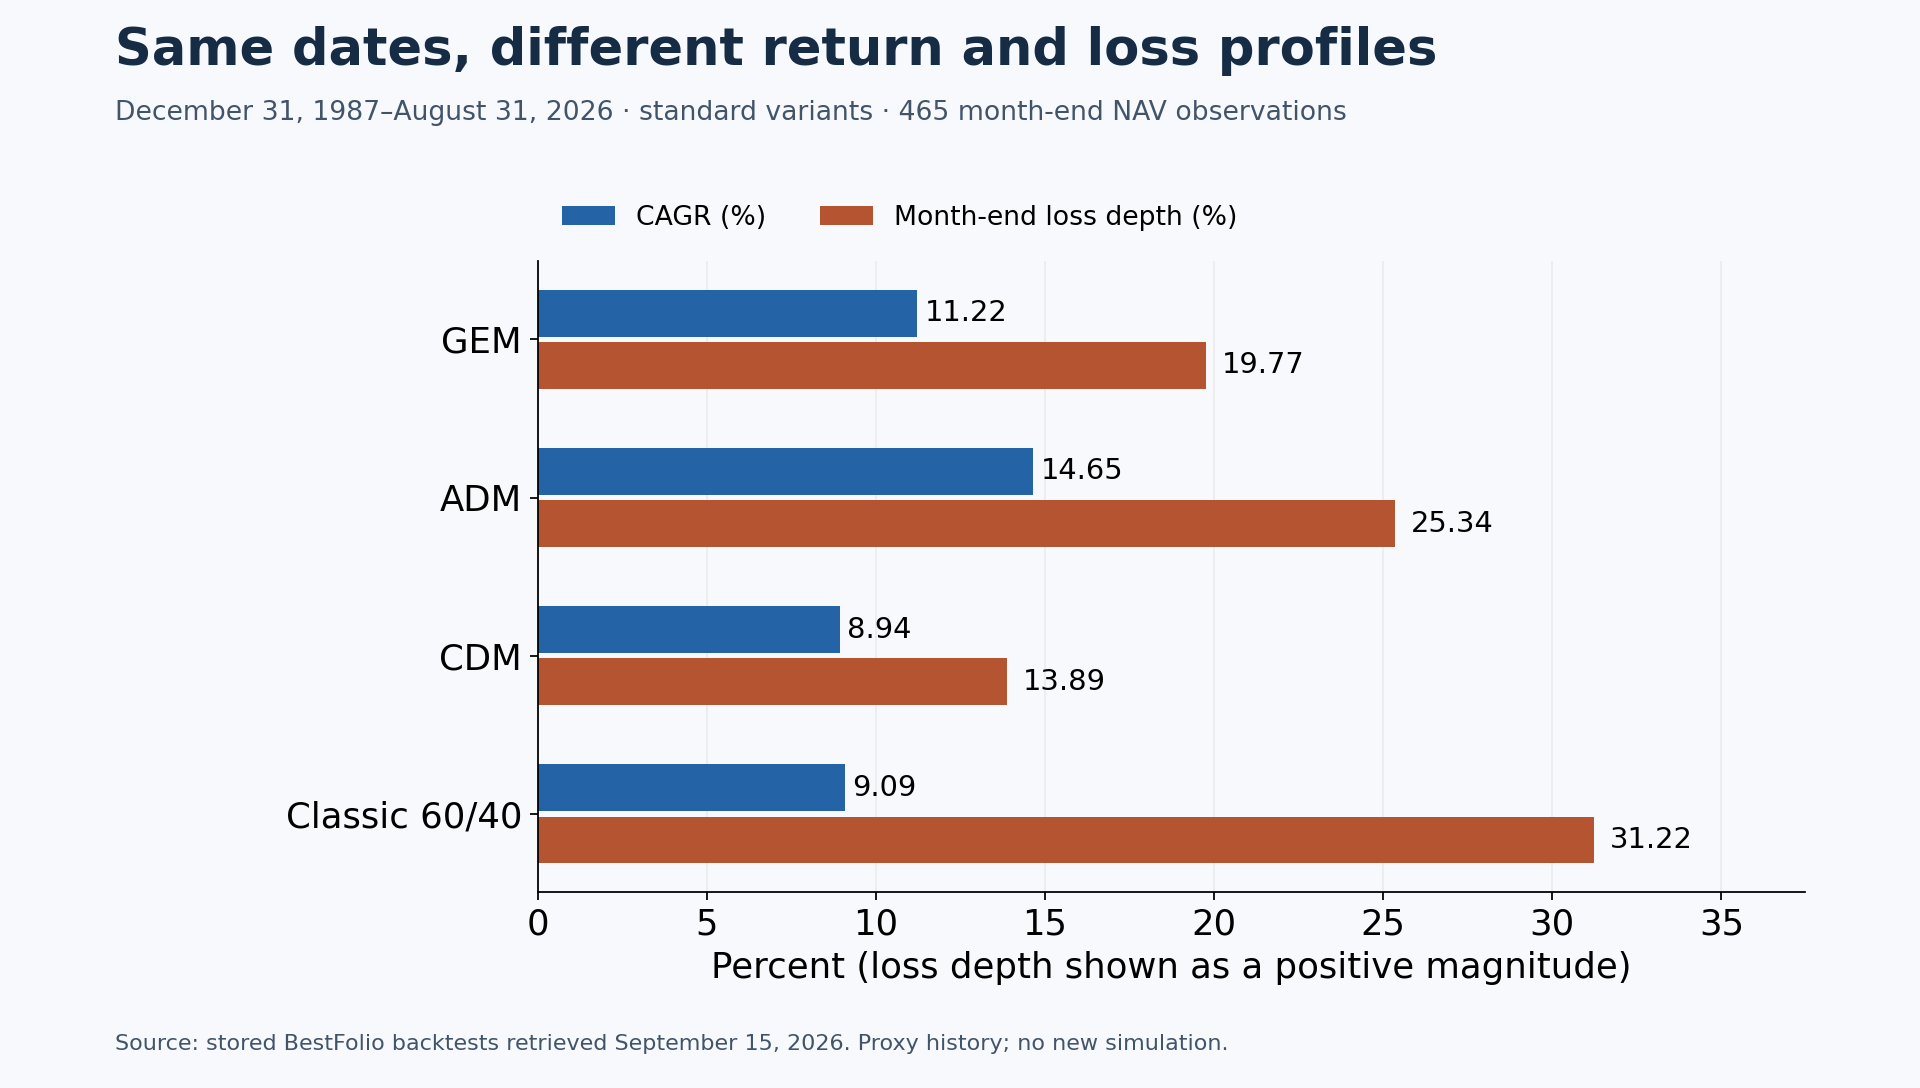
A practical, step-by-step guide to building your first tactical asset allocation portfolio. From choosing strategies to executing monthly rebalances.
Read more →
Three of the most popular fixed-allocation portfolios compared head-to-head. We break down historical performance, drawdowns, and who each portfolio is actually best for.
Read more →
BestFolio Pro is $29/mo vs AllocateSmartly from $49/mo. We compare coverage, walk-forward evidence, UCITS support, and what each does better.
Read more →
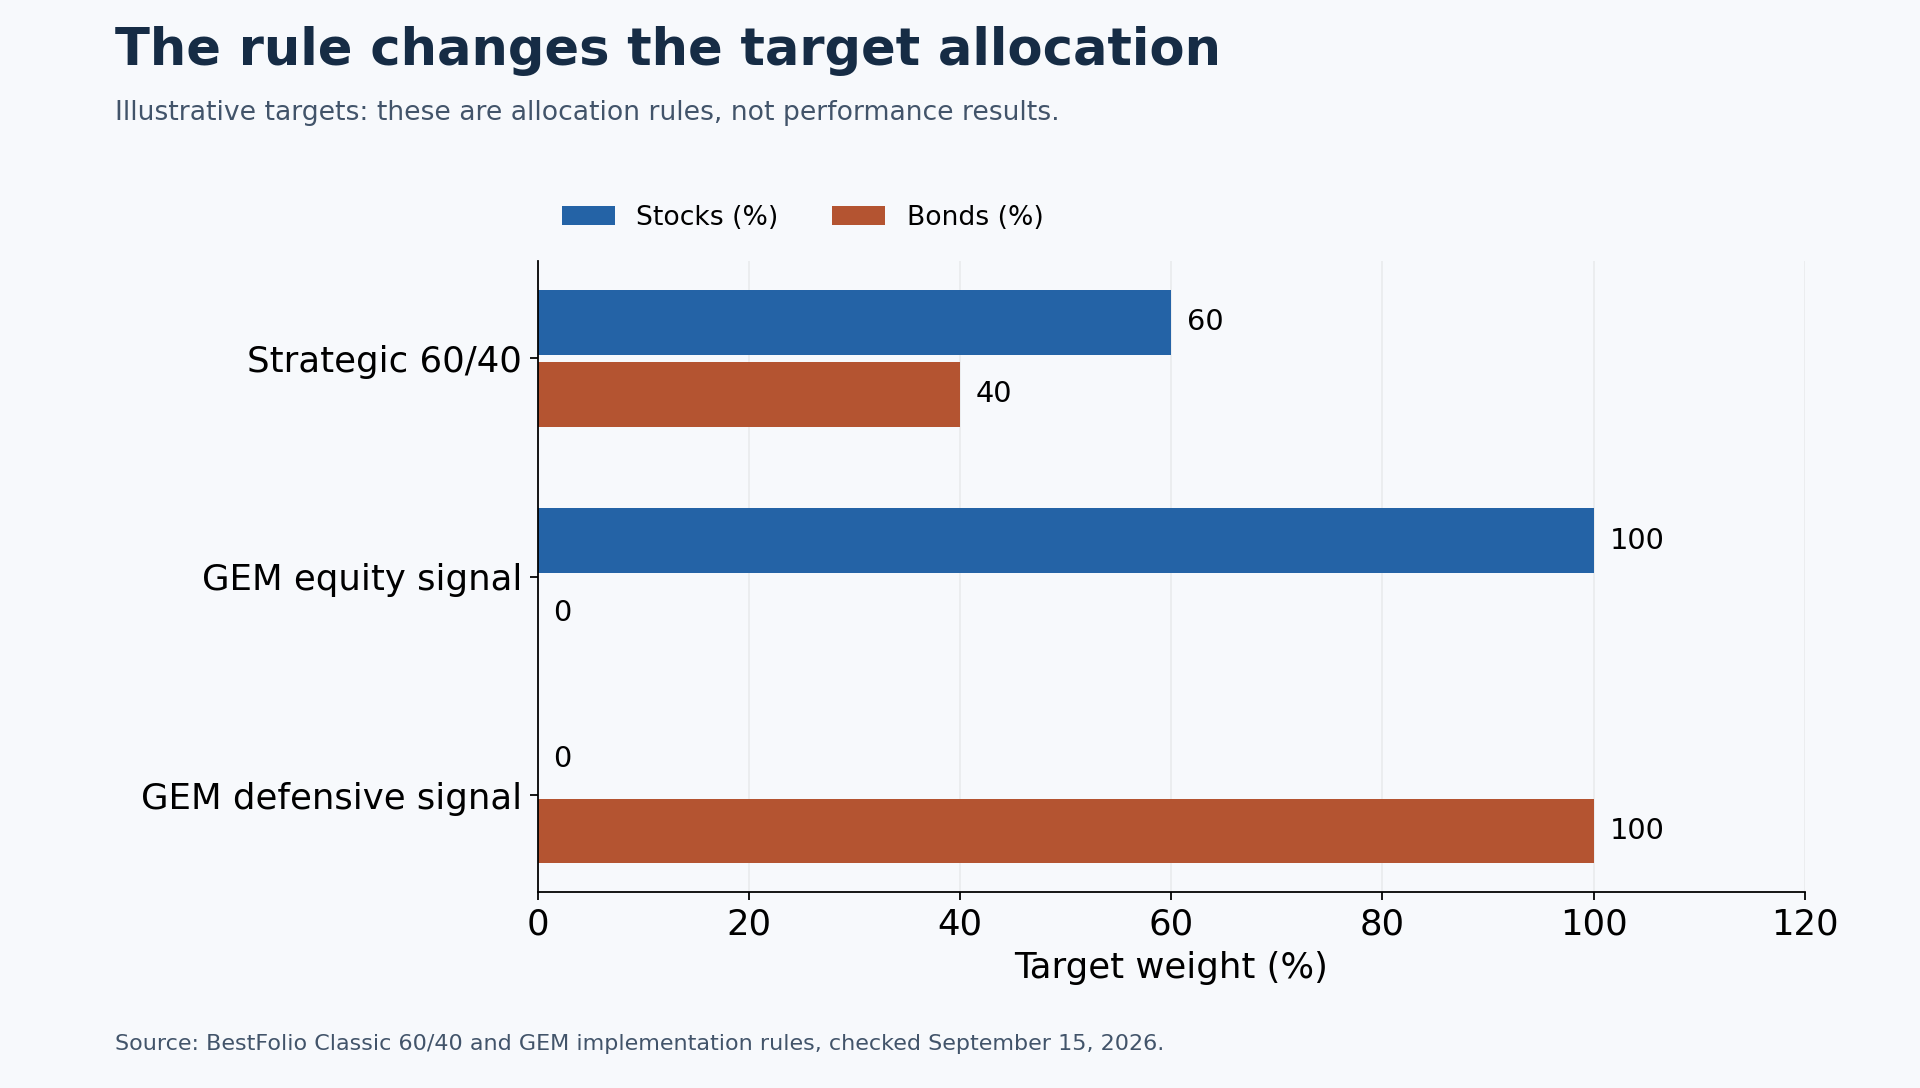
How tactical allocation changes portfolio weights, how it differs from a fixed 60/40 portfolio, and what to check before following a monthly signal.
Read more →