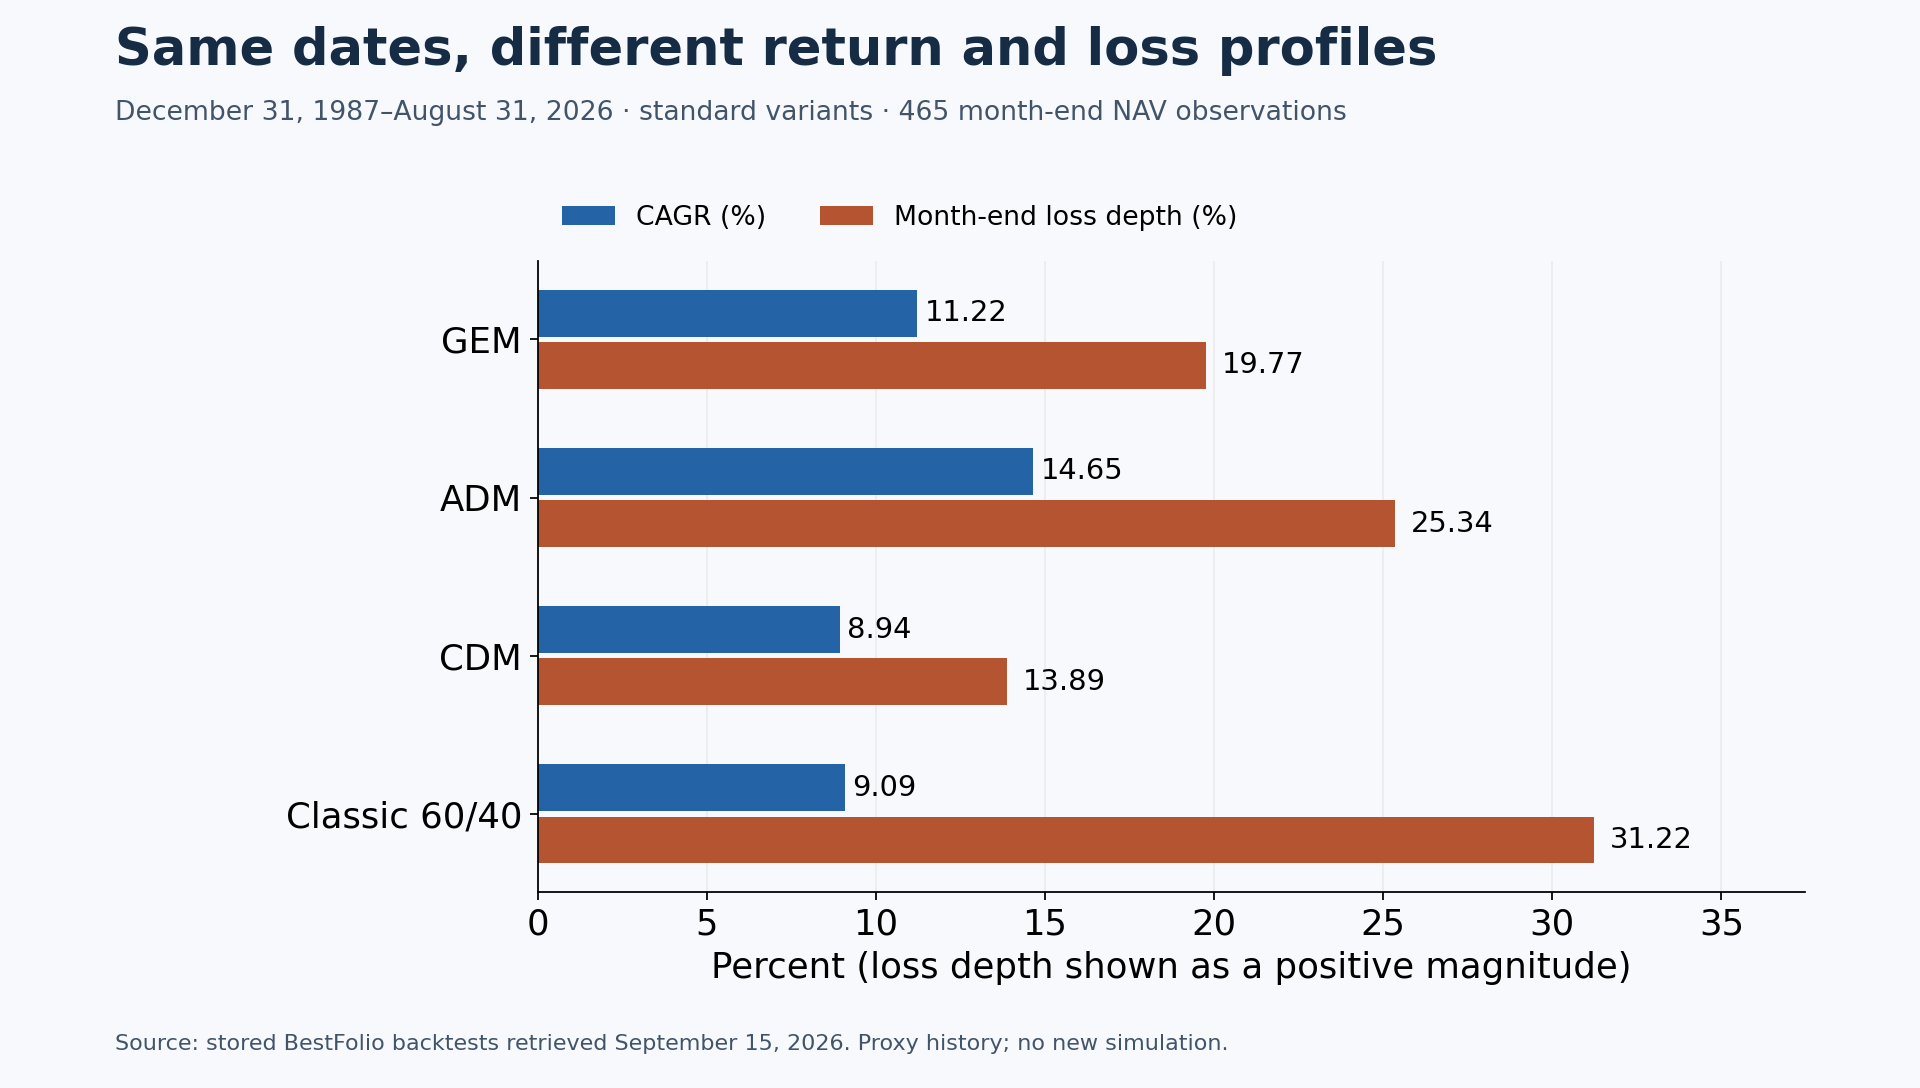
GEM, ADM and CDM all use momentum, but they make different bets. On the shared history below, ADM delivered the highest compound return and CDM the smallest month-end drawdown. Those results describe a historical test, not a ranking that will necessarily persist.
- GEM returned 11.22% a year with a 19.77% maximum loss measured at month ends.
- ADM returned 14.65% with a 25.34% month-end maximum loss.
- CDM returned 8.94% with a 13.89% month-end maximum loss.
A comparison on shared dates
All four rows start on December 31, 1987 and end on August 31, 2026. These are standard, unleveraged variants. Returns use stored NAV, meaning the portfolio value series from the existing backtest. This is a recalculation over a shared window, not a new strategy simulation.
| Strategy | CAGR | Month-end maximum drawdown |
|---|---|---|
| GEM | 11.22% | -19.77% |
| ADM | 14.65% | -25.34% |
| CDM | 8.94% | -13.89% |
| Classic 60/40 | 9.09% | -31.22% |
GEM: one equity winner or aggregate bonds
GEM uses a 12-month lookback. US equities must beat T-bills before the strategy holds the stronger of US and international equities. Otherwise it holds aggregate bonds. The standard implementation uses SPY, VEU, AGG and the BIL hurdle. It holds one fund at a time, so it is easy to inspect but concentrated in its selected exposure.
ADM: a faster equity score and a different defense
ADM averages the 1-, 3- and 6-month total returns of SPY and SCZ. A strictly stronger positive equity score selects that asset. Otherwise, including an equity-score tie, it chooses the stronger 1-month return of TLT and TIP. Faster lookbacks may react sooner, but can also produce reversals and extra turnover. Its higher return here came with a deeper month-end loss than GEM.
CDM: four separate decisions
CDM divides the portfolio into four 25% modules: equities, credit, real estate and economic stress. Each compares a pair using 12-month momentum, holding the winner only if it beats the cash hurdle; otherwise that module holds BIL. The standard pairs are SPY/EFA, LQD/HYG, VNQ/REM and gold/TLT. More modules spread the decisions, but the underlying assets can still fall together.
What this table can and cannot show
The calculation takes the last stored NAV observation in each common calendar month, giving 465 observations. CAGR is the endpoint growth annualized using actual elapsed days divided by 365.25. Drawdown is the largest decline from a previous peak in those month-end samples. It excludes losses and recoveries within a month; it must not be compared directly with a daily-drawdown number.
The stored histories extend before several ETFs existed, so they include historical proxies. This comparison inherits each backtest's data, execution and cost assumptions and makes no additional deduction for an individual's broker fees or taxes. The input runs were GEM 5172, ADM 5174, CDM 5179 and Classic 60/40 5248, retrieved September 15, 2026. Current strategy cards can change as their histories extend.
For an implementation choice, compare the actual instruments, turnover and drawdowns you can tolerate. Repeating this check across different windows is more useful than treating one full-period winner as a forecast. See the backtest methodology and the monthly workflow guide.
Educational research, not personalized investment advice. Backtests are hypothetical; past performance does not guarantee future results.