Global Equities Momentum (GEM) is one of the most influential tactical allocation strategies ever published. Gary Antonacci combined 2 kinds of momentum, relative strength and trend, into a rule any investor can run with 3 ETFs and one check a month. This guide covers the rules, the live backtest, where GEM fails, and how it compares with 2 later dual momentum designs, ADM and CDM, on the same dates.
Who created it
Gary Antonacci set out the method in Dual Momentum Investing: An Innovative Strategy for Higher Returns with Lower Risk (McGraw-Hill, 2014). His contribution was to put absolute momentum (is the asset beating cash?) and relative momentum (which asset is stronger?) into one practical system, built on the academic momentum research that goes back to Jegadeesh and Titman.
How GEM works
GEM makes one decision each month, from 12-month total returns. BestFolio's standard implementation uses SPY, VEU, AGG and BIL:
- Absolute momentum. Compare US equities (SPY) with T-bills (BIL). If US equities do not beat that hurdle, hold aggregate bonds (AGG) for the month.
- Relative momentum. If they do, hold the stronger of US equities (SPY) and international equities (VEU).
- Hold for one month, then repeat.
The portfolio holds one fund at a time and is always fully invested, in equities or in bonds. That makes it easy to inspect and cheap to run, usually 0 to 2 trades a month. It also means the whole portfolio rides on one exposure.
The live backtest
On the GEM strategy page, the Standard variant, backtested from February 1986 to 2 October 2026, shows a 13.4% CAGR, a 1.04 Sharpe ratio and a -33.7% maximum drawdown. The page updates as the history extends, so it is the place to check the current numbers.
GEM's strength is that the absolute momentum test can take it out of a long bear market. Its weakness is speed: a 12-month lookback reacts late to a sudden crash and can sell near a bottom, then buy back higher after a sharp reversal. That whipsaw is where most of its deepest losses come from.
GEM, ADM and CDM on the same dates
ADM and CDM are both dual momentum strategies, but they make different bets. To compare them fairly, I recalculated all 3 over a shared window, 31 December 1987 to 31 August 2026, using the stored NAV of each standard, unleveraged variant, with Classic 60/40 as the baseline.
| Strategy | CAGR | Month-end maximum drawdown |
|---|---|---|
| GEM | 11.22% | -19.77% |
| ADM | 14.65% | -25.34% |
| CDM | 8.94% | -13.89% |
| Classic 60/40 | 9.09% | -31.22% |
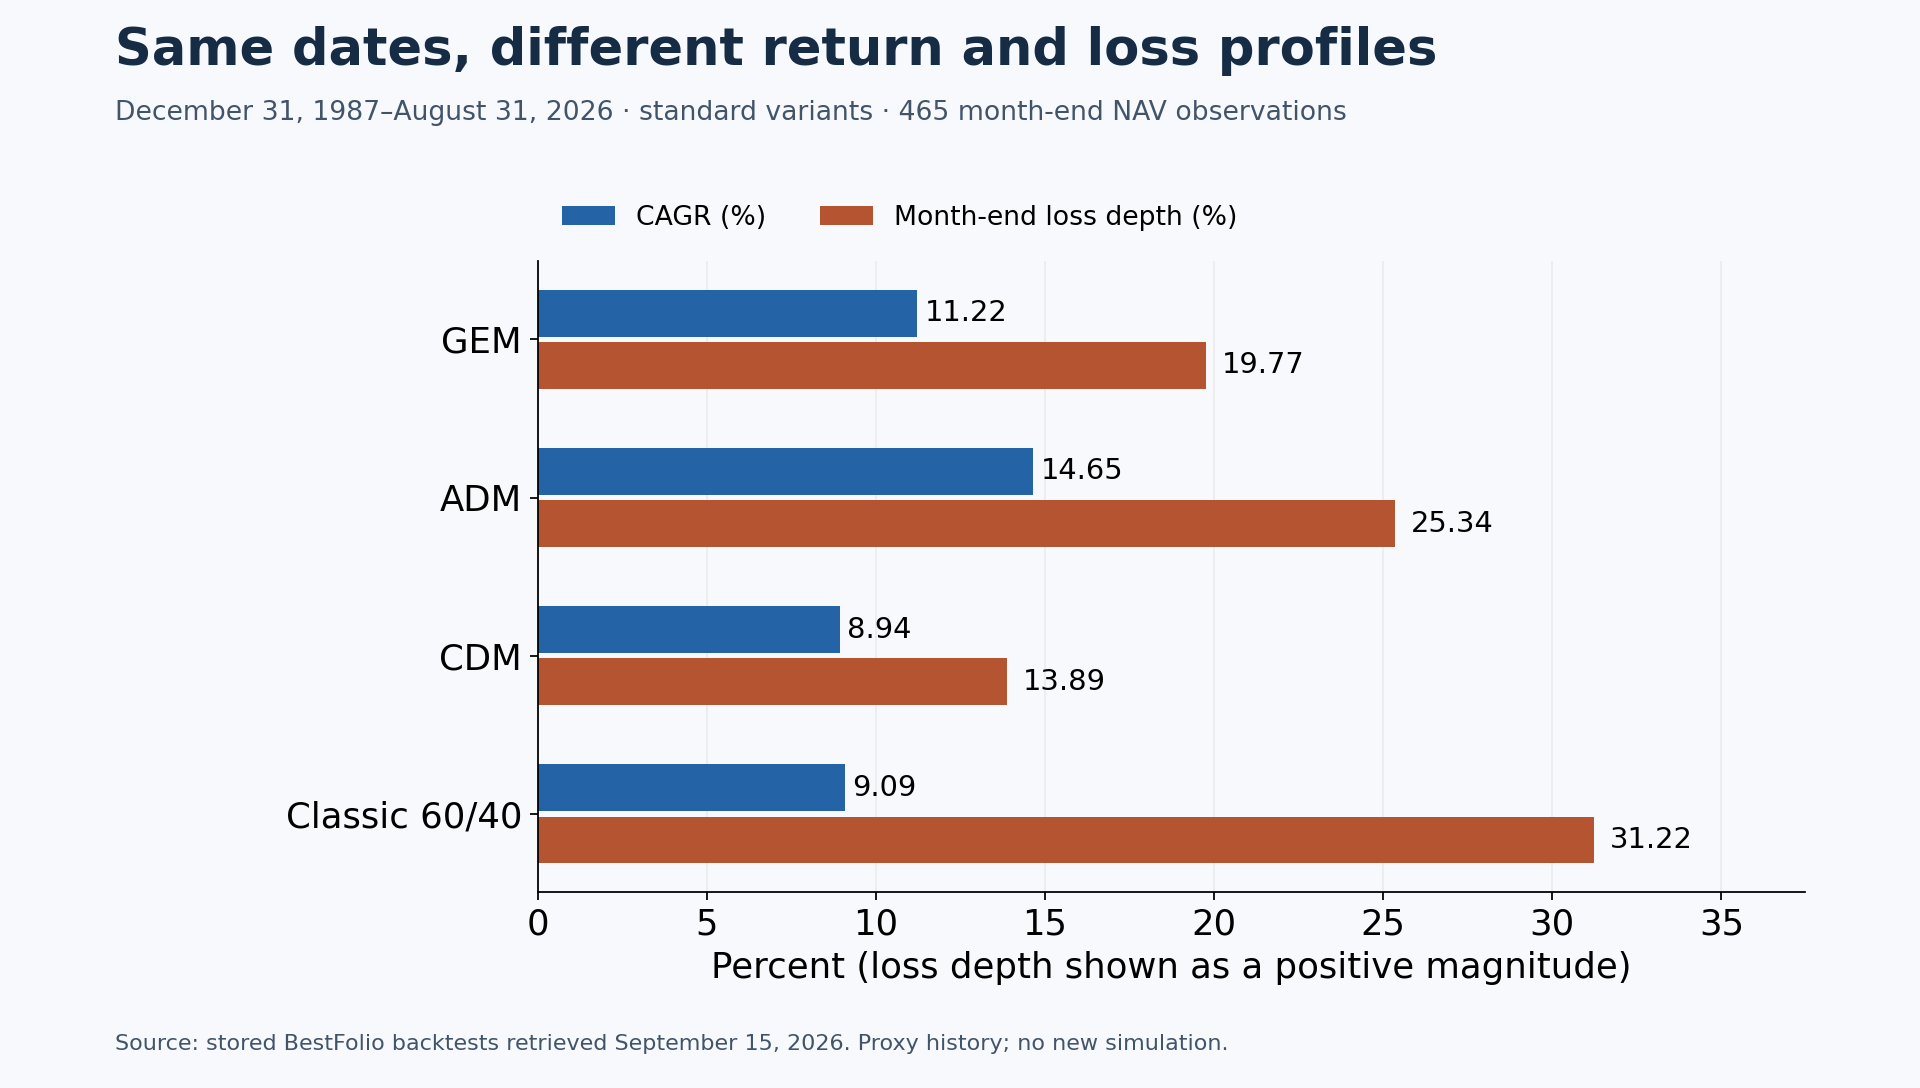
These drawdowns are not the same measure as the one on the strategy cards. The cards measure the worst fall on daily values; this table takes the last value of each month, 465 observations, so it misses losses and recoveries inside a month and reads shallower. That is why GEM shows -19.77% here and -33.7% on its card. CAGR here is endpoint growth annualized over actual elapsed days divided by 365.25.
ADM: a faster equity score and a different defense
ADM averages the 1, 3 and 6-month total returns of SPY and SCZ. A strictly stronger positive equity score selects that asset. Otherwise, including an equity-score tie, it holds whichever of TLT and TIP had the stronger 1-month return. Faster lookbacks can react sooner, but they also bring reversals and extra turnover. Its higher return in this window came with a deeper month-end loss than GEM.
CDM: 4 separate decisions
CDM splits the portfolio into 4 modules of 25%: equities, credit, real estate and economic stress. Each compares a pair on 12-month momentum and holds the winner only if it beats the cash hurdle; otherwise that module holds BIL. The standard pairs are SPY/EFA, LQD/HYG, VNQ/REM and gold/TLT. More modules spread the decisions, but the underlying assets can still fall together.
What the comparison can and cannot show
The stored histories reach back before several of these ETFs existed, so they include historical proxies. The comparison inherits each backtest's data, execution and cost assumptions and makes no extra deduction for your broker's fees or your taxes. The input runs were GEM 5172, ADM 5174, CDM 5179 and Classic 60/40 5248, retrieved on 15 September 2026.
For an implementation choice, compare the instruments you can actually buy, the turnover and the drawdowns you can live with. Repeating the check over different windows tells you more than treating one full-period winner as a forecast. The backtest methodology explains how every number here is computed.
Strengths and weaknesses
GEM's appeal is its simplicity: 3 ETFs, one check a month, one holding and very little turnover. The absolute momentum test gives it a built-in exit from long bear markets, which is the main reason it became the reference rule for dual momentum.
The same design has costs. Holding 100% of one asset is uncomfortable, and the 12-month lookback is late on fast crashes and can switch at the wrong moment in choppy markets. Bonds are its only defense, so when stocks and bonds fall together, as in 2022, aggregate bonds do not protect; the 2022 dual momentum study shows what that year did to GEM, ADM and CDM. In a taxable account, the switches between asset classes can also realize short-term gains.
Try it
GEM is one of the free strategies on BestFolio: the full backtest, the monthly signal and the current allocation need no subscription. View GEM on BestFolio, or read the wider guide to tactical asset allocation.
Educational research, not personalized investment advice. Backtests are hypothetical; past performance does not guarantee future results.