Tactical asset allocation (TAA) changes a portfolio's target weights using a rule tied to market data. A rule might hold an equity fund while its trend is positive and switch to a defensive asset when that condition fails. The purpose is to make the decision repeatable. It cannot promise an early exit from every crash.
Strategic and tactical allocation
A strategic portfolio can rebalance regularly while keeping the same long-term target. A tactical portfolio changes the target itself. Neither approach removes investment risk.
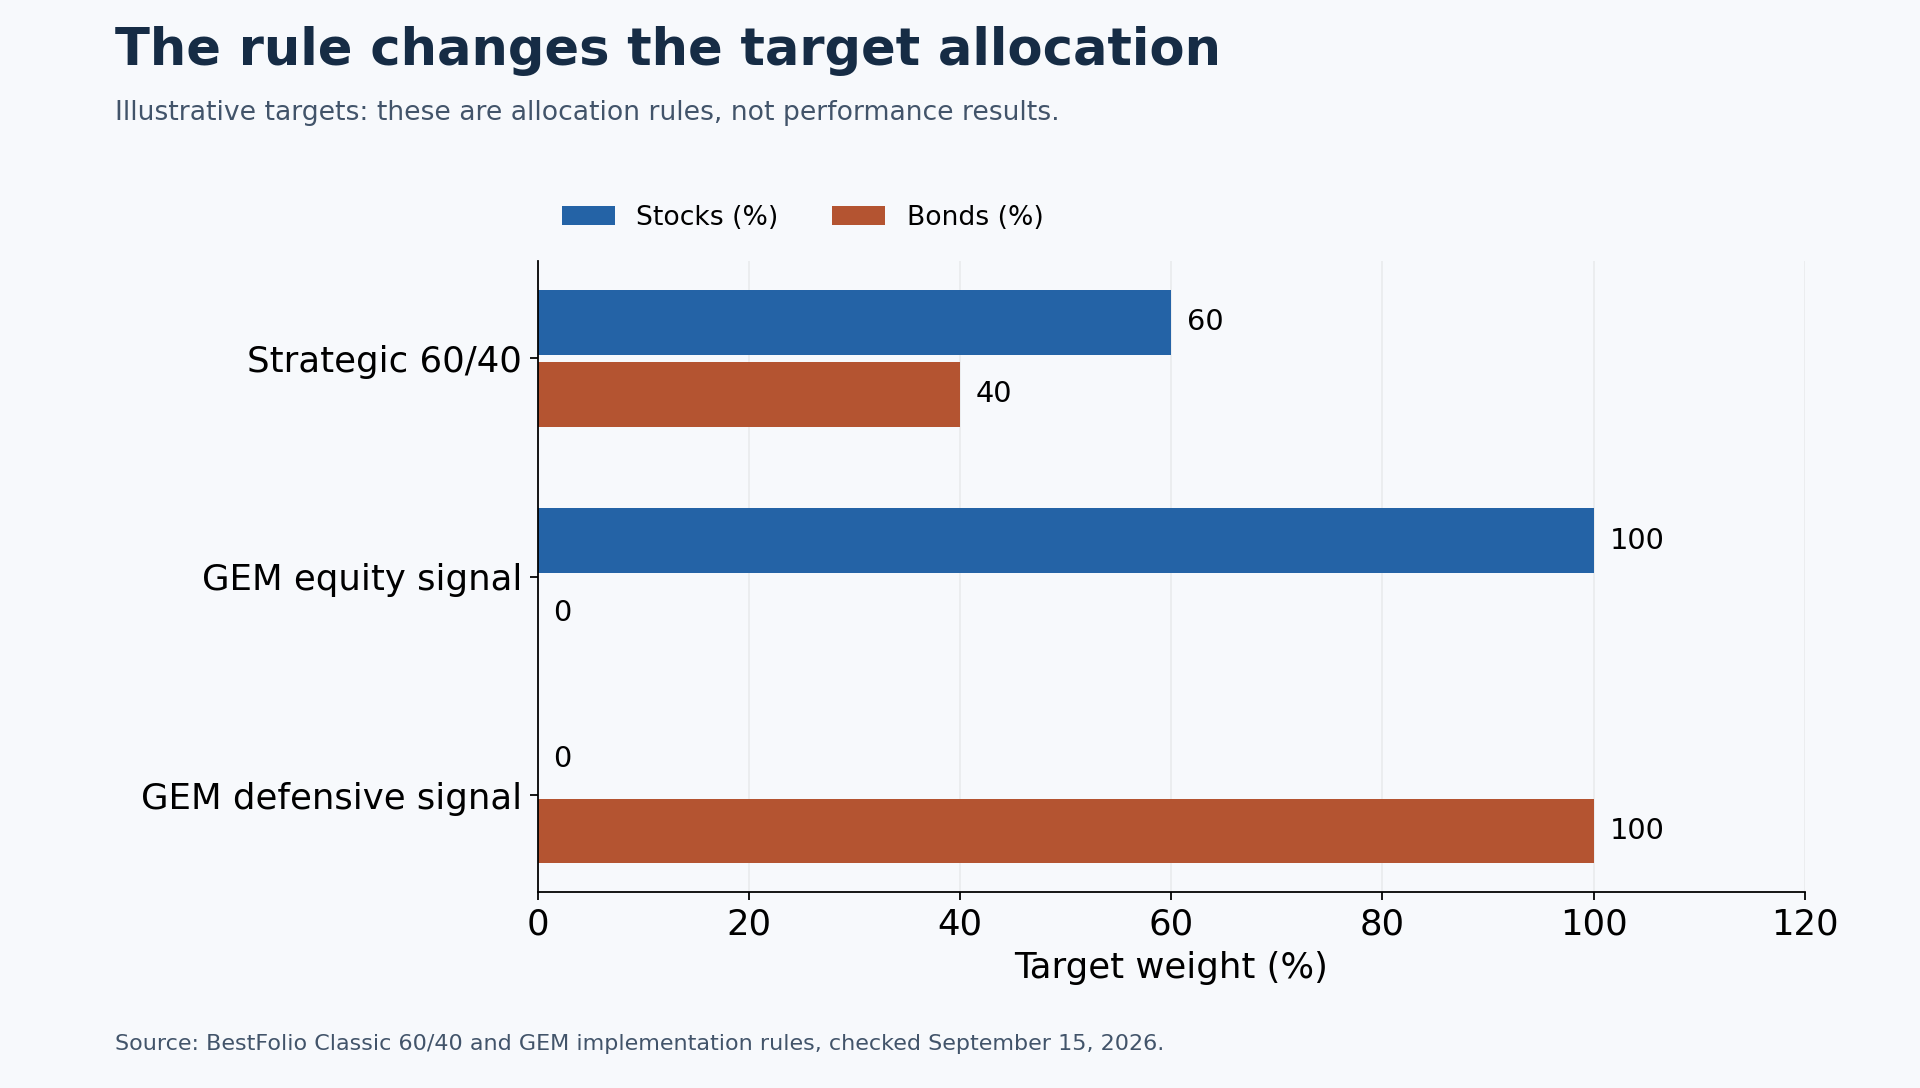
| Example | Equity target | Bond target | What changes it? |
|---|---|---|---|
| Classic 60/40 | 60% | 40% | Rebalance back to fixed weights |
| GEM equity signal | 100% | 0% | Equity momentum passes its rule |
| GEM defensive signal | 0% | 100% | Equity momentum fails its rule |
A concrete example: GEM
BestFolio's standard GEM implementation compares the 12-month total return of US equities with T-bills. If US equities beat that hurdle, it holds the stronger of US and international equities. Otherwise it holds aggregate bonds. The rule is evaluated monthly, and the portfolio holds one asset at a time.
That last point matters. Defensive bonds can lose money. The signal can react after a loss has begun, and it can switch out just before a rebound. Other tactical methods use faster momentum, trend filters, volatility weights or several separate sleeves. Their risks differ even when they share the TAA label.
What to check in a backtest
- Compare strategies and the passive benchmark on the same start and end dates.
- Read the drawdown alongside the return. A monthly chart can hide deeper losses between month ends.
- Separate observed fund prices from pre-inception proxies and synthetic histories.
- Check how trading costs, distributions, cash returns and execution timing were modeled.
- Look for tests beyond the period used to design the rule. Selecting the best historical variant can overstate what a new investor should expect.
The GEM, ADM and CDM comparison gives a worked example using shared dates. The Classic 60/40 page provides a simple baseline.
Make a plan you can follow during a drawdown
A rule only defines the portfolio you actually hold if you keep following it. Before investing, write down the chosen variant, the source of its signals, when you review them, the allowed assets and the costs you can accept. Decide how much loss your overall finances can absorb. A strategy's worst historical loss is not a ceiling on future losses.
After a difficult month, distinguish an implementation problem from an uncomfortable but valid signal. Check whether the data arrived, the rule ran and the trades matched the intended weights. A missed trade or a changed financial need can justify action. Recent underperformance alone does not establish that the rule stopped working.
Use a scheduled review to consider changing the strategy. Record the reason and compare alternatives over consistent windows, including the losing periods. Jumping to the latest winner after every setback makes it hard to tell whether the original rule or the switching decision caused the result.
Starting with a monthly workflow
- Choose a rule and inspect its holdings and limitations.
- Confirm the instruments, order sizes and costs available in your account.
- Wait for the confirmed signal and its stated execution date.
- Record the trades and check the resulting allocation.
- Review the process at the interval you set in advance.
A signal calculated from a market close cannot be assumed to have been known before that close. The execution-delay study explains why that distinction belongs in the plan.
Educational research, not personalized investment advice. Backtests are hypothetical; past performance does not guarantee future results.