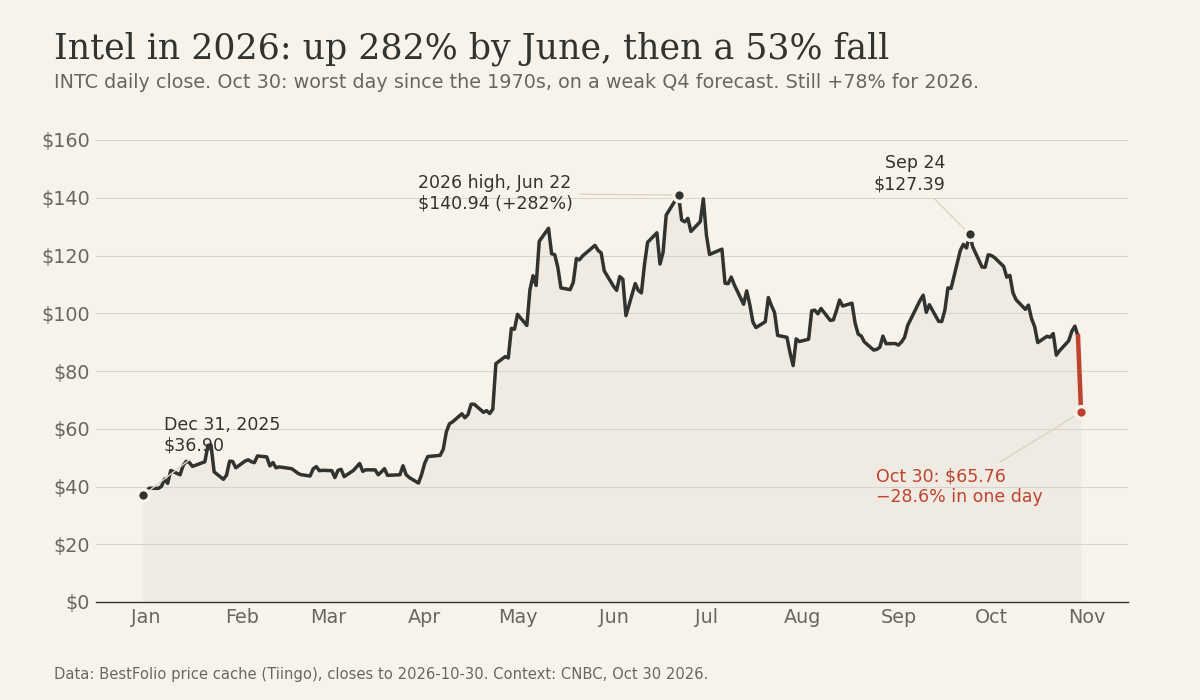
If you want one chart for the AI trade of 2026, take Intel's. On Friday, October 30, the stock had its worst day since the 1970s, according to CNBC, after a fourth-quarter forecast well below what analysts expected.
It closed at $65.76, −28.6% in one session. Intel guided Q4 revenue to $15 to $16 billion; analysts were at about $17.1 billion. And the path to that Friday is the whole year in miniature: $36.90 at the end of 2025, $140.94 on June 22 (up 282%), $127.39 again on September 24, then five weeks of selling. It's now 53% below the June high and still +78% for the year.
It wasn't only Intel. SOXL, the 3x semiconductor fund, lost 47.9% in October. SMH lost 14.2%, TQQQ 20.5%, QQQ 6.7%, and QQQ ended the month 9.1% below the record it set on October 6. The top post of the week on r/TQQQ was titled "ITS OVER sell everything now", with 393 comments. On r/LETFs, u/Gehrman_JoinsTheHunt's monthly update on his real-money leveraged plans blamed "concerns about AI valuations and debt".
I can't tell you whether this is the start of a long unwind or a correction inside a bull market. I can measure something narrower and more useful: if the AI trade does keep unwinding, does a tactical portfolio have to go down with it?
For most of the 224 published strategy variants on BestFolio, October says no. For the ones whose growth came only from QQQ or TQQQ, it says yes, and the trend filters most of them rely on didn't fire.
Is it even an unwind?
Look at what went up. The S&P 500 lost 0.9% in October, but the same 500 stocks at equal weight (RSP) gained 4.9%. Energy gained 13.9%, consumer staples 10.9%, utilities 10.1%, health care 9.8%, US value 5.5%. Long Treasuries (TLT) gained 5.6%, and TMF, the 3x version, 16.2%. Commodities (DBC) gained 4.0% and are now +50.3% for 2026.
Money moved more than it left. And 2 of the usual hedges didn't help: gold lost 6.6% in October and 12.9% over September and October, bitcoin (IBIT) 8.4%.
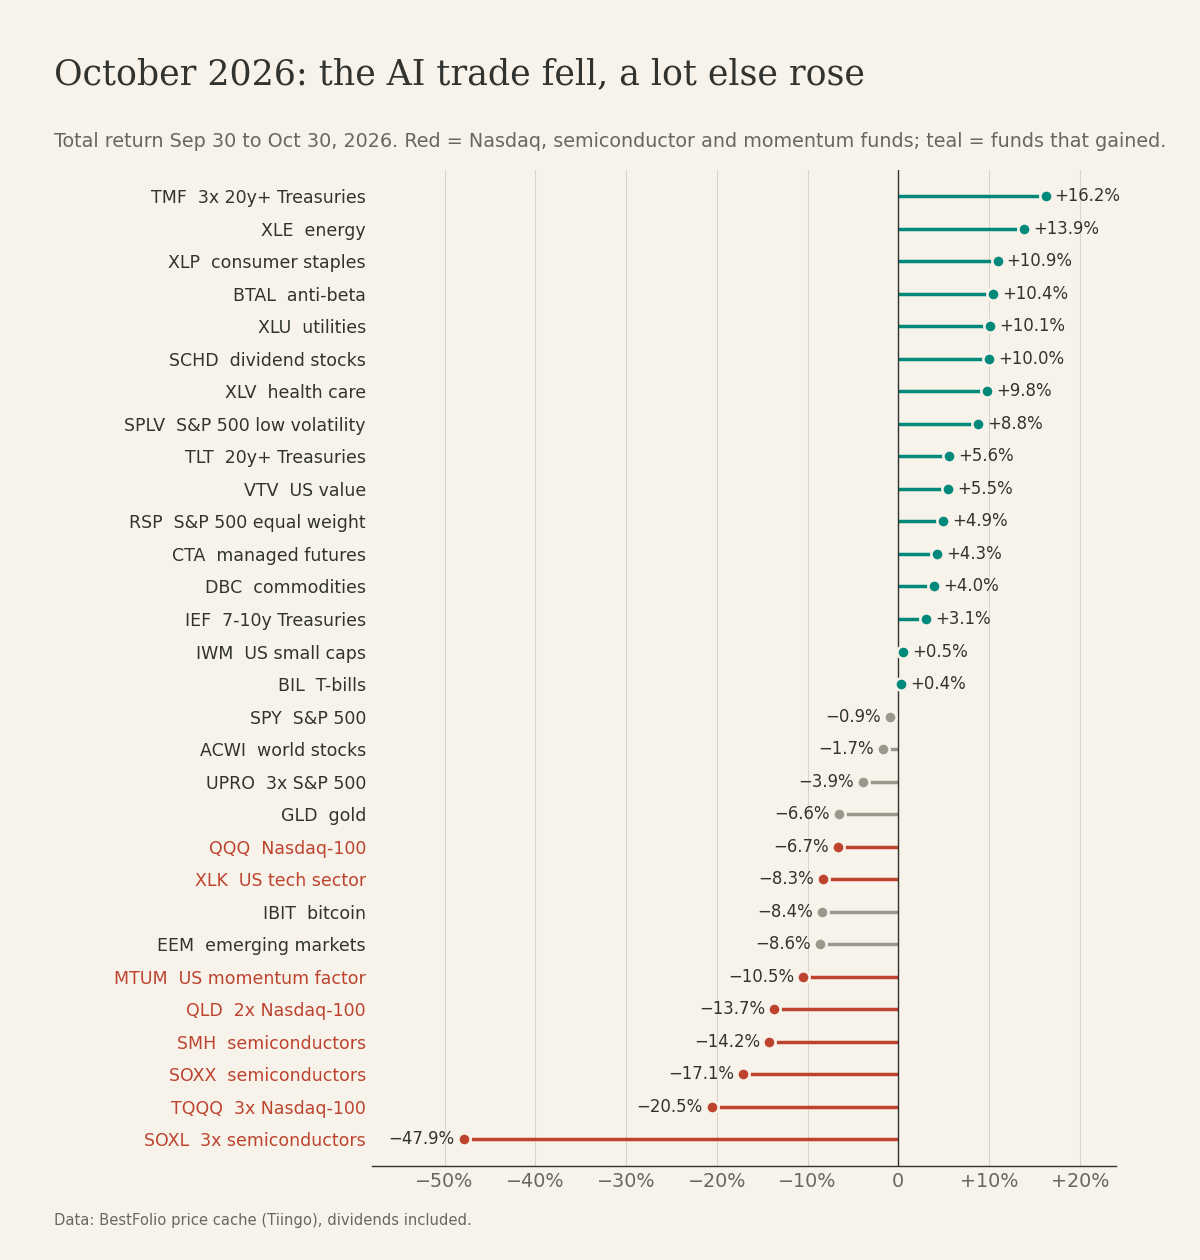
So a strategy that was allowed to own energy, staples, Treasuries or commodities had plenty to hold in October. One that could only choose between QQQ and cash didn't.
What 224 strategies did in October
I took every released strategy variant on the site, 224 of them, and measured October from their live model NAVs, the same series behind the strategy cards. 96 made money. 208 did better than QQQ. The median lost 0.5%.
Then I split them by what they held when October started. 173 held no Nasdaq-100, tech-sector or semiconductor fund on October 1: their median October was +0.10%, and 88 of them made money. 13 had half or more in those funds, and their median was −13.2%.
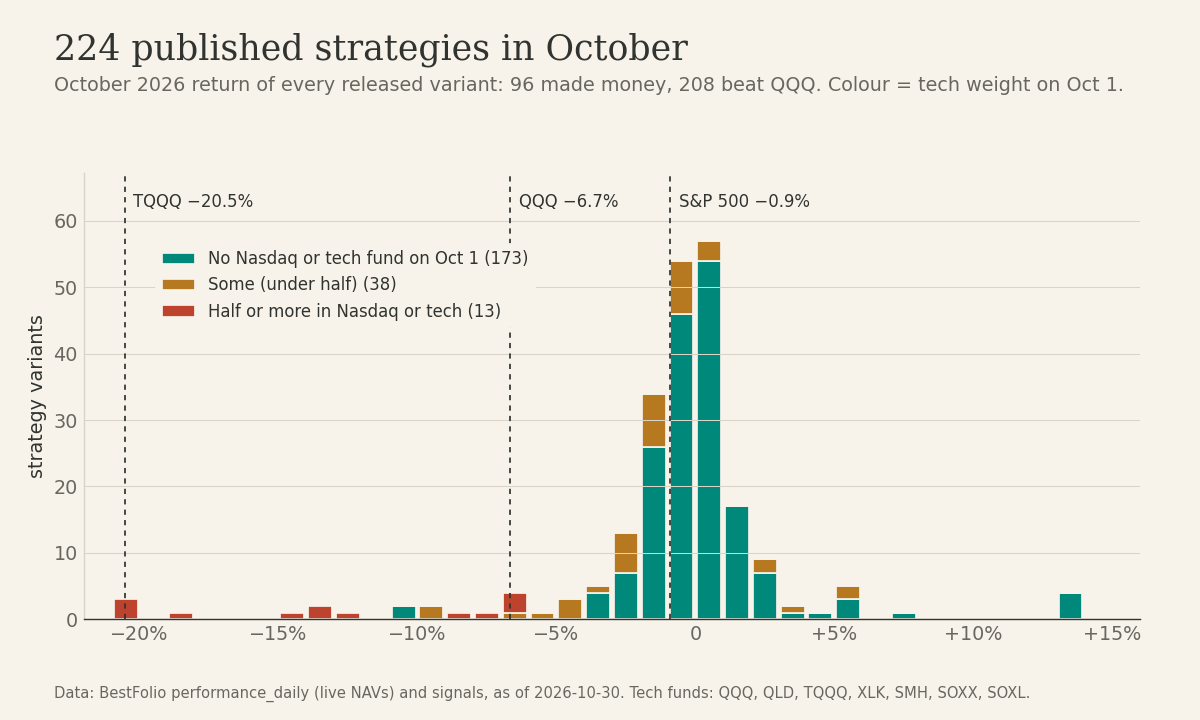
What separated them was the menu each strategy picks from.
The ones that made money, and what they held
Here are the 12 best strategies of October, one row each (its best variant), with what they held on October 1. The last column is the card: yearly return and worst fall over the full backtest.
| Strategy (best variant) | Held on Oct 1 | Sep | Oct | 2026 to Oct 30 | Card: yearly return / worst fall |
|---|---|---|---|---|---|
| Growth-Inflation Sector Timing (Concentrated) | energy (XLE) 100% | −3.3% | +13.9% | +42.5% | 15.9% / −38.9% (from 1987) |
| Inflation Compass (Standard) | energy (XLE) 100% | −3.4% | +13.9% | +35.2% | 17.4% / −36.4% (from 1950) |
| Holy Grail Dual Momentum (Toma Hentea's original, TLT) | 20y+ Treasuries (TLT) 100% | −5.4% | +5.6% | −7.1% | 11.8% / −42.6% (from 2005) |
| RP Gold+SCV (VBR version) | small-cap value (VBR) 100% | −5.4% | +5.4% | +6.2% | 10.4% / −24.2% (from 1985) |
| Cockroach Portfolio (5 x 20%) | staples (XLP) 20%, utilities (XLU) 20%, health care (XLV) 20%, Treasuries (GOVT) 20%, gold (GLDM) 20% | −4.0% | +5.3% | +6.6% | 10.2% / −21.8% (from 1985) |
| Sector Rotation, Faber top 3 | tech (XLK) 33%, energy (XLE) 33%, health care (XLV) 33% | +0.3% | +5.1% | +27.1% | 12.5% / −40.9% (from 1985) |
| Stoken's ACA (REIT sleeve) | REITs (VNQ) 100% | −6.2% | +4.8% | +9.2% | 10.1% / −36.6% (from 1985) |
| Chimeric Asset Allocation: Chimeric Asset Allocation Standard | 3x Nasdaq-100 (TQQQ) 25%, commodities (PDBC) 25%, ERX (ERX) 25%, T-bills (BIL) 25% | −1.3% | +2.9% | +20.0% | 28.1% / −52.7% (from 1981) |
| Verdad Countercyclical | corporate bonds (LQD) 50%, 7-10y Treasuries (IEF) 40%, small-cap value (IWN) 10% | −3.6% | +2.7% | +1.3% | 13.2% / −25.5% (from 1980) |
| Five-Asset Momentum Rotation | commodities (PDBC) 33%, US stocks (VTI) 33%, REITs (VNQ) 33% | −1.5% | +2.7% | +16.6% | 13.1% / −32.0% (from 1973) |
| Coffeehouse (7 funds) | bonds (AGG) 40%, S&P 500 (SPY) 10%, S&P 500 value (IVE) 10%, small caps (IJR) 10%, small-cap value (IJS) 10%, developed ex-US (EFA) 10%, REITs (VNQ) 10% | −3.5% | +2.4% | +7.8% | 9.1% / −38.1% (from 1985) |
| Adaptive Hedge | commodities (PDBC) 50%, US dollar (UUP) 50% | +2.9% | +2.3% | +4.7% | 9.3% / −32.0% (from 1973) |
| QQQ, buy and hold | +3.2% | −6.7% | +12.7% | ||
| TQQQ, buy and hold | +8.7% | −20.5% | +18.3% | ||
| S&P 500 | −0.3% | −0.9% | +11.8% |
Read the second column. Energy, Treasuries, small-cap value, staples and utilities, REITs, corporate bonds, commodities, the dollar. Momentum and trend rules buy whatever is rising, with no opinion on AI, and in 2026 commodities have been rising all year.
I'd be careful with the top 2 rows. Inflation Compass and the concentrated Growth-Inflation variant held one fund, XLE, so they got energy's month and nothing else. That works until energy has its own bad month, and their worst falls on the card (−36.4% and −38.9%) say it will come. One good month proves very little about a strategy.
Up in September and up in October
October flatters anything defensive. September was the mirror image: TQQQ gained 8.7%, Intel 34.3%, and long Treasuries lost 5.4%. Most of the October winners above lost money in September.
43 variants made money in both months, from 17 strategies. Here are the 9 with the best 2026 so far (one variant each), plus the library portfolio built from 3 of them. The other 8 did it mostly by sitting in T-bills. These are the ones I'd look at as a growth engine that doesn't depend on tech:
| Strategy (best variant) | Held on Oct 1 | Sep | Oct | Worst fall since August 1, 2026 | 2026 to Oct 30 |
|---|---|---|---|---|---|
| HAA-Simple Leveraged 3x (UPRO) | T-bills (BIL) 100% | +0.1% | +0.4% | −6.0% | +31.0% |
| Sector Rotation, Faber top 3 | tech (XLK) 33%, energy (XLE) 33%, health care (XLV) 33% | +0.3% | +5.1% | −1.7% | +27.1% |
| Chimeric Asset Allocation: Chimeric Asset Allocation Full Retreat | T-bills (BIL) 100% | +0.2% | +0.3% | −2.5% | +18.8% |
| Carlson's Adaptive 60/40 | S&P 500 (SPY) 60%, commodities (PDBC) 40% | +1.2% | +0.9% | −1.7% | +17.8% |
| PAA (Dynamic Protection) | 1-3y Treasuries (SHY) 83%, 6 others under 5% | +0.0% | +0.3% | −1.3% | +17.4% |
| BAA-G12 (Balanced) | T-bills (BIL) 67%, commodities (PDBC) 33% | +1.3% | +1.6% | −1.6% | +15.2% |
| EAA Golden Offensive (1.5x) | commodities (PDBC) 56%, T-bills (BIL) 30%, emerging (EEM) 7%, S&P 500 (SPY) 7% | +1.8% | +1.8% | −4.2% | +14.5% |
| Piard Annual Seasonality | Germany (EWG) 50%, T-bills (BIL) 50% | +0.3% | +0.8% | −1.0% | +7.4% |
| Defensive Rotation (7-asset trend basket) | T-bills (BIL) 68%, US dollar (UUP) 20%, managed futures (KMLM) 8%, 1 other under 5% | +0.9% | +0.5% | −0.4% | +7.2% |
| Open Momentum Trio (library portfolio) | HAA 40%, BAA-G4 30%, ADM 30% | +0.4% | +0.3% | −0.7% | +12.6% |
HAA is the interesting one, because it's also the one people run with leverage. Its canary is TIP, the inflation-protected Treasury fund. When TIP's momentum turns negative, HAA sells everything risky and holds the better of T-bills and 7-10 year Treasuries. That happened at the end of August, so every HAA variant, the 2x and 3x ones included, sat in T-bills through September and October.
The trigger was TIP falling as yields rose, which has nothing to do with chips, and HAA paid for it by missing TQQQ's September. But HAA Leveraged (2x) is +26.7% this year and HAA-Simple 3x (UPRO) +31.0%, against +18.3% for TQQQ, and neither held a single Nasdaq share in October.
Where it hurt: strategies built on QQQ and TQQQ
Our catalog has those too, and they had the month you'd expect.
| Strategy (worst variant) | Held on Oct 1 | Oct | Worst fall since August 1, 2026 | Card: yearly return / worst fall |
|---|---|---|---|---|
| RVol Shifter (Wongkok 200-day) | 3x Nasdaq-100 (TQQQ) 100% | −20.5% | −26.4% | 21.2% / −59.2% (from 2000) |
| TQQQ/QQQ 200-day Band (+4%/−3%) | 3x Nasdaq-100 (TQQQ) 100% | −20.5% | −26.4% | 27.4% / −95.8% (from 1985) |
| VIX Shield (Leveraged) | 3x Nasdaq-100 (TQQQ) 80%, managed futures (DBMF) 10%, 2x gold (UGL) 10% | −18.4% | −23.7% | 18.3% / −88.4% (from 1990) |
| TQQQ/TLT Dual-Gate | 3x Nasdaq-100 (TQQQ) 60%, 20y+ Treasuries (TLT) 40% | −12.9% | −17.5% | 18.6% / −72.9% (from 1986) |
| Century Momentum | S&P 500 momentum (SPMO) 100% | −10.1% | −12.0% | 16.5% / −46.8% (from 1928) |
| TQQQ Quadrant Stack | 3x Nasdaq-100 (TQQQ) 30%, intl small value (AVDV) 20%, stocks + managed futures (RSST) 20%, gold + stocks (GDE) 10%, gold (GLDM) 10%, managed futures (DBMF) 10% | −9.2% | −12.1% | 19.6% / −37.4% (from 1996) |
| Vol-Target 2x QQQ (Aggressive) | 2x Nasdaq-100 (QLD) 56%, T-bills (BIL) 44% | −8.4% | −11.4% | 11.2% / −36.0% (from 1999) |
| Carlson's Orthogonal Alpha (BTAL/QLD) | 2x Nasdaq-100 (QLD) 75%, anti-beta (BTAL) 25% | −7.6% | −11.0% | 15.7% / −26.4% (from 2003) |
| TQQQ Trend (Standard) (for comparison) | managed futures (CTA) 32%, managed futures (KMLM) 32%, 3x Nasdaq-100 (TQQQ) 25%, 3x S&P 500 (UPRO) 10% | −4.7% | −7.4% | 15.8% / −32.0% (from 1985) |
These are the 8 worst strategies of October, one row each (its worst variant), plus one for comparison. TQQQ Quadrant Stack holds 30% TQQQ next to 5 other funds and lost 9.2%. TQQQ Trend Standard, in the last row, had moved most of its money into managed futures and lost 4.7%. Same fund, a smaller dose, a much smaller hole.
Why the trend filters didn't fire
Most TQQQ timing rules leave when QQQ or the S&P 500 closes below its 200-day moving average, often with a buffer. A popular version buys 4% above the average and sells 3% below it; u/noletovictor tested the S&P 500 version against 762,960 alternatives on r/LETFs last week and found it sits on a broad, flat plateau of similar rules.
On October 30, QQQ closed at $690. Its 200-day average was $680, so it was still 1.6% above it. The band's exit line was at $659, another 4.5% lower. TQQQ, meanwhile, was already 28.9% below its June 2 high.
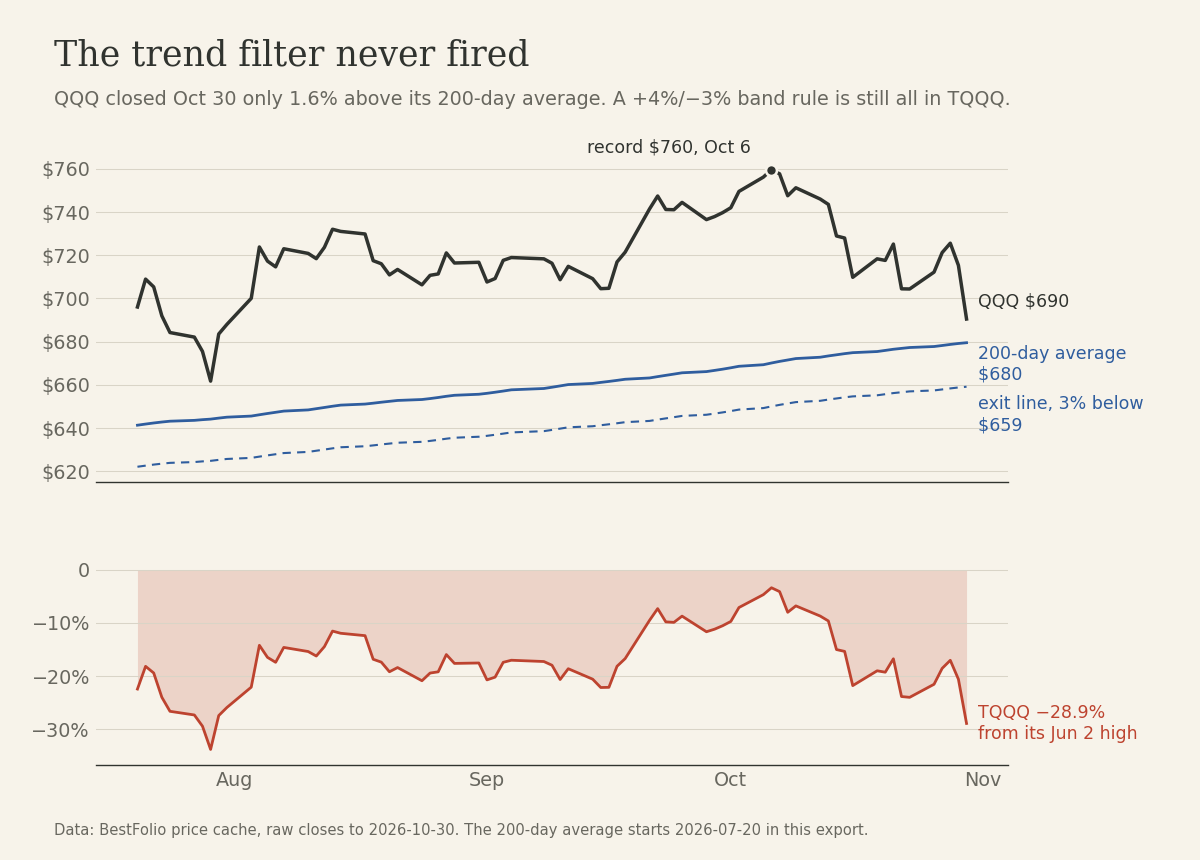
That's the filter doing its job. It's built for the falls that end strategies, like QQQ's roughly 80% from 2000 to 2002 or 35% in 2022, and it accepts a 10% correction as the price of not being shaken out of every dip. At 3x, a 9% correction costs you 20 to 30%. The TQQQ/QQQ band's own card shows the trade: 27.4% a year since 1985, with a worst fall of 95.8%.
There's a second detail in that chart. QQQ set its record on October 6, but TQQQ never got back to its June 2 high of $87.22. On October 6 it closed at $84.25. That's what a daily 3x reset does to you in a choppy year.
Half TQQQ, half something else
So what happens if TQQQ is half the portfolio and the other half is one of the 173 strategies that held no tech fund on October 1? I paired TQQQ with each of them, 50/50, set back to 50/50 at every month-end from December 31.
The median pair lost 10.2% in October, half of TQQQ's 20.5%. Its worst fall since August was 14.1%, against 26.4%. For the year it's +17.5%, against +18.3% for TQQQ alone, and 72 of the 173 pairs are ahead of TQQQ alone.
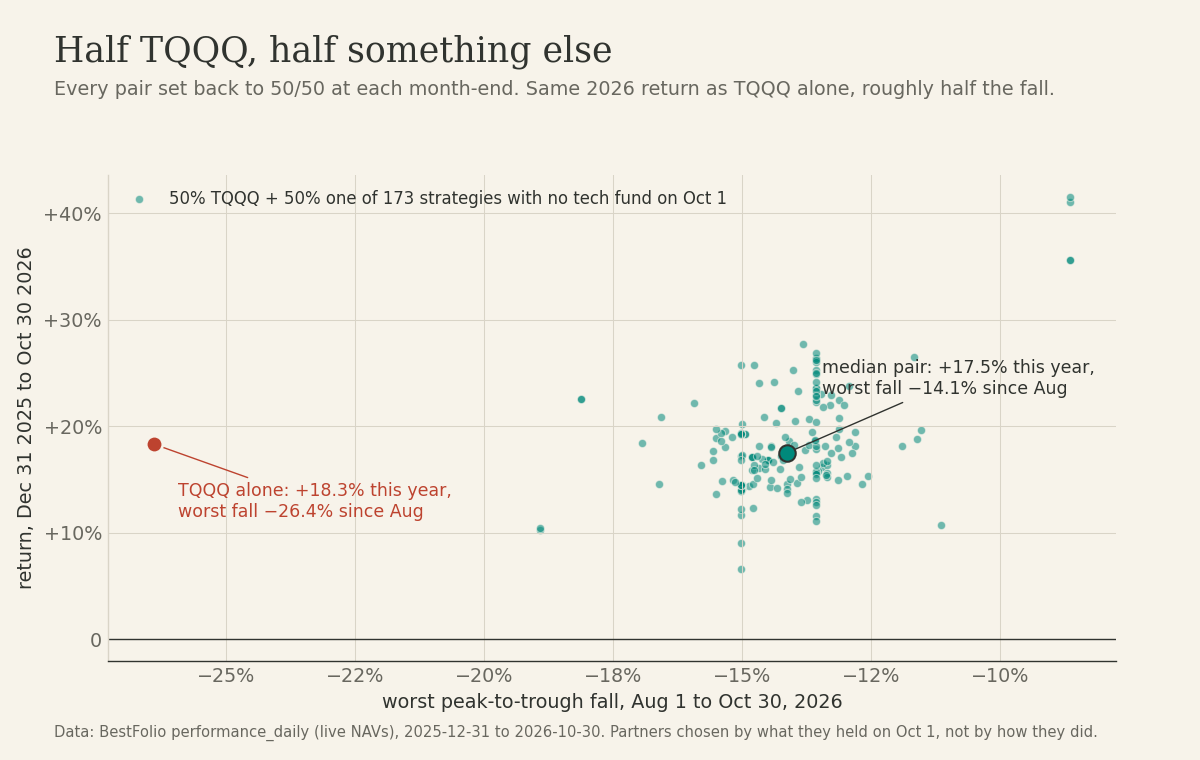
I picked the partners by what they held on October 1, before anyone knew how October would go, so this isn't a list of the month's winners. It's also only 10 months of data. But it's the shape I'd expect to keep: you give up a little in a tech rally and lose a lot less when it turns.
2026 so far
Pull back to the whole year and the engines that weren't built on tech kept pace anyway.
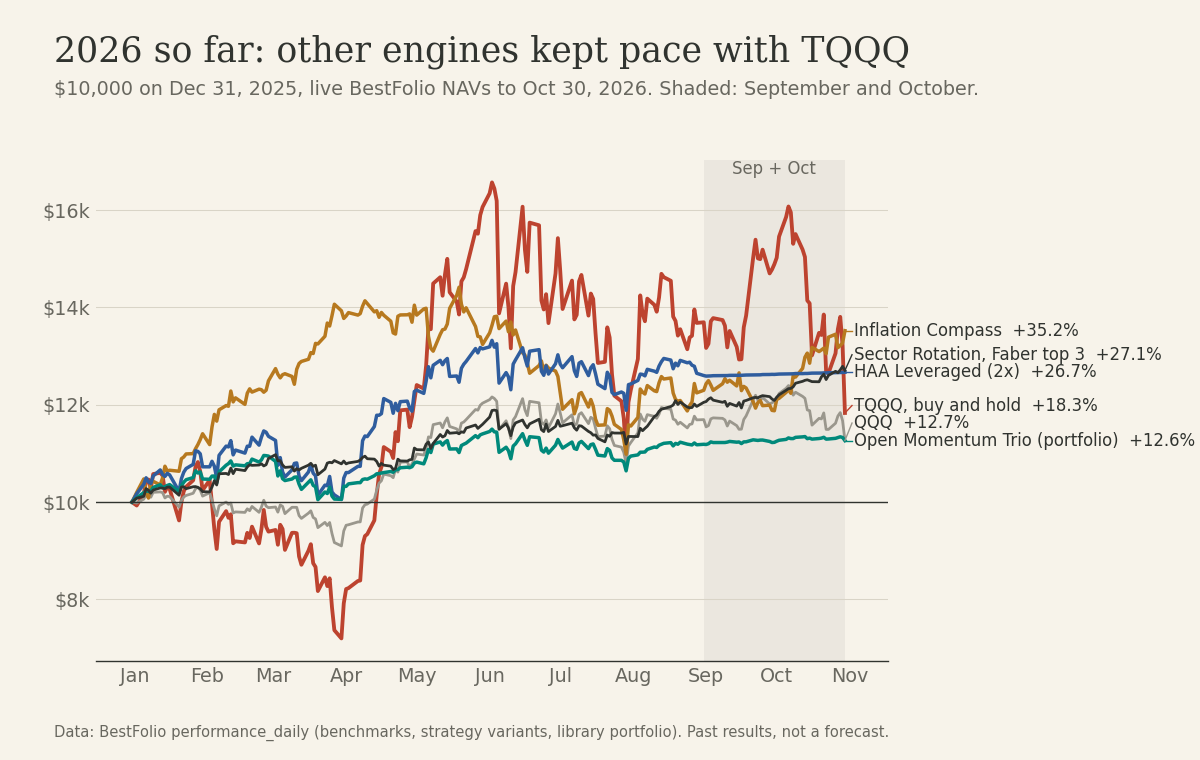
Inflation Compass is +35.2%, the Faber sector rotation +27.1%, HAA Leveraged (2x) +26.7%, TQQQ +18.3% and QQQ +12.7%. The quietest line is Open Momentum Trio, one of the public library portfolios (HAA 40%, BAA-G4 30%, ADM 30%): +12.6% for the year, +0.4% in September, +0.3% in October, and a worst fall of 0.7% since August. Its sibling Monthly Macro Rotation gained 2.5% in October and is +12.5% for the year.
What I'd do with this
- Count your tech. Add up QQQ, TQQQ, QLD, XLK, the semiconductor funds and the big AI names across every account. If one trade is most of your growth and you hold it at 3x, a 9% dip in QQQ is a 20 to 30% month for you.
- Give growth a second source. A rotation that can pick energy, commodities, value, small caps, bonds or T-bills (HAA, BAA, EAA, a sector rotation) will often own something else when tech turns. Not every month, as September showed.
- Keep your trend filter, and size TQQQ for the correction the filter won't catch.
- Don't chase October's winner. The 2 best strategies this month held a single fund each.
If the AI trade keeps unwinding, the portfolios with a second engine will probably do what they did in October, which is mostly shrug. The ones with everything on one index will keep feeling it at 3x.
How these numbers were made
Monthly figures are total returns from month-end to month-end (August 31, September 30, October 30, 2026). Fund returns include dividends. Strategy and portfolio figures are BestFolio's live model NAVs as of October 30, 2026: each strategy's published rules applied to daily prices with the site's default trading costs, trading at the close of the signal day. They're model results, not a real account. "Held on Oct 1" is the last signal on or before September 30. Card figures are the full published backtests (yearly return and worst daily peak-to-trough fall) as of November 2, 2026; before a fund existed, the backtests use index or proxy data. The Intel guidance figures are from CNBC's October 30 report. Past results, not a forecast or advice.