A Monte Carlo test is a way to build thousands of possible futures out of a strategy's own past. A block bootstrap, the version I use, means cutting the monthly return history into blocks, drawing blocks at random and gluing them into new 30-year paths. The block length decides how much of the real order of months survives.
A month ago I showed that this one setting barely moves the median return of a Classic 60/40 portfolio but moves its bad drawdown tail a lot. With 1-month blocks, 5% of 30-year paths fell more than 38.97%. With 36-month blocks, that line moved to 62.75%.
On r/BestFolio I asked what to test next, and this one got the votes: u/paragon_22, u/QuanTradin and u/HBCTIA all picked it. u/QuanTradin put the case for it in one line: on a tactical strategy that switches monthly, short blocks chop up exactly the runs that matter. u/HBCTIA asked for far more than 5,000 paths, to see whether a fat tail of catastrophic or exceptional outcomes hides at either end.
So I reran the same test on four monthly tactical strategies, plus one daily-signal strategy as a contrast, and ran 50,000 paths on every one of them. The answer surprised me. Block length matters a lot for a tactical strategy. It just pushes the tail the other way.
The setup
Nothing changed in the generator. It is the same moving-block bootstrap the Monte Carlo panel on every strategy page ran when I did this study, and I checked that my study copy produces bit-identical paths. Each setting draws 5,000 paths of 360 months (30 years) with seed 42. Only the block length changes: 1, 3, 6, 12, 24 or 36 months. A 1-month block shuffles single months. A 36-month block keeps 3-year stretches of history in their original order.
The inputs are the month-end returns of each strategy's live card, through September 2026:
| Strategy | How it switches | History used | Card CAGR | Card max drawdown (daily) | Max drawdown at month-end |
|---|---|---|---|---|---|
| HAA Standard | monthly | 1974-02 to 2026-09 | 16.36% | -19.53% | -11.74% |
| Triplet Standard | monthly | 1987-11 to 2026-09 | 13.80% | -17.66% | -12.35% |
| GEM Standard | monthly | 1985-02 to 2026-09 | 14.15% | -33.70% | -19.77% |
| BAA-G12 (Balanced) | monthly | 1985-02 to 2026-09 | 12.00% | -14.32% | -11.45% |
| Buy the Dip Standard | daily signal | 1985-11 to 2026-09 | 26.77% | -76.23% | -67.04% |
| Classic 60/40 | fixed weights | 1923-01 to 2026-09 | 8.70% | -63.18% | -63.18% |
The last column matters. The simulation works on month-end values, so it cannot see a fall that recovers inside the month. A simulated HAA drawdown should be compared with 11.74%, not with the daily 19.53% on the card.
Before the new runs I reproduced the published 60/40 table on its original window, 1923-01 to 2026-08. Every cell matched within 0.17 points. The small gap comes from the 60/40 card being re-run on 17 October.
The result: the tactical tails shrink
| Strategy | Median CAGR, 1-month to 36-month blocks | 95th-pct max drawdown, 1-month blocks | 36-month blocks | Change |
|---|---|---|---|---|
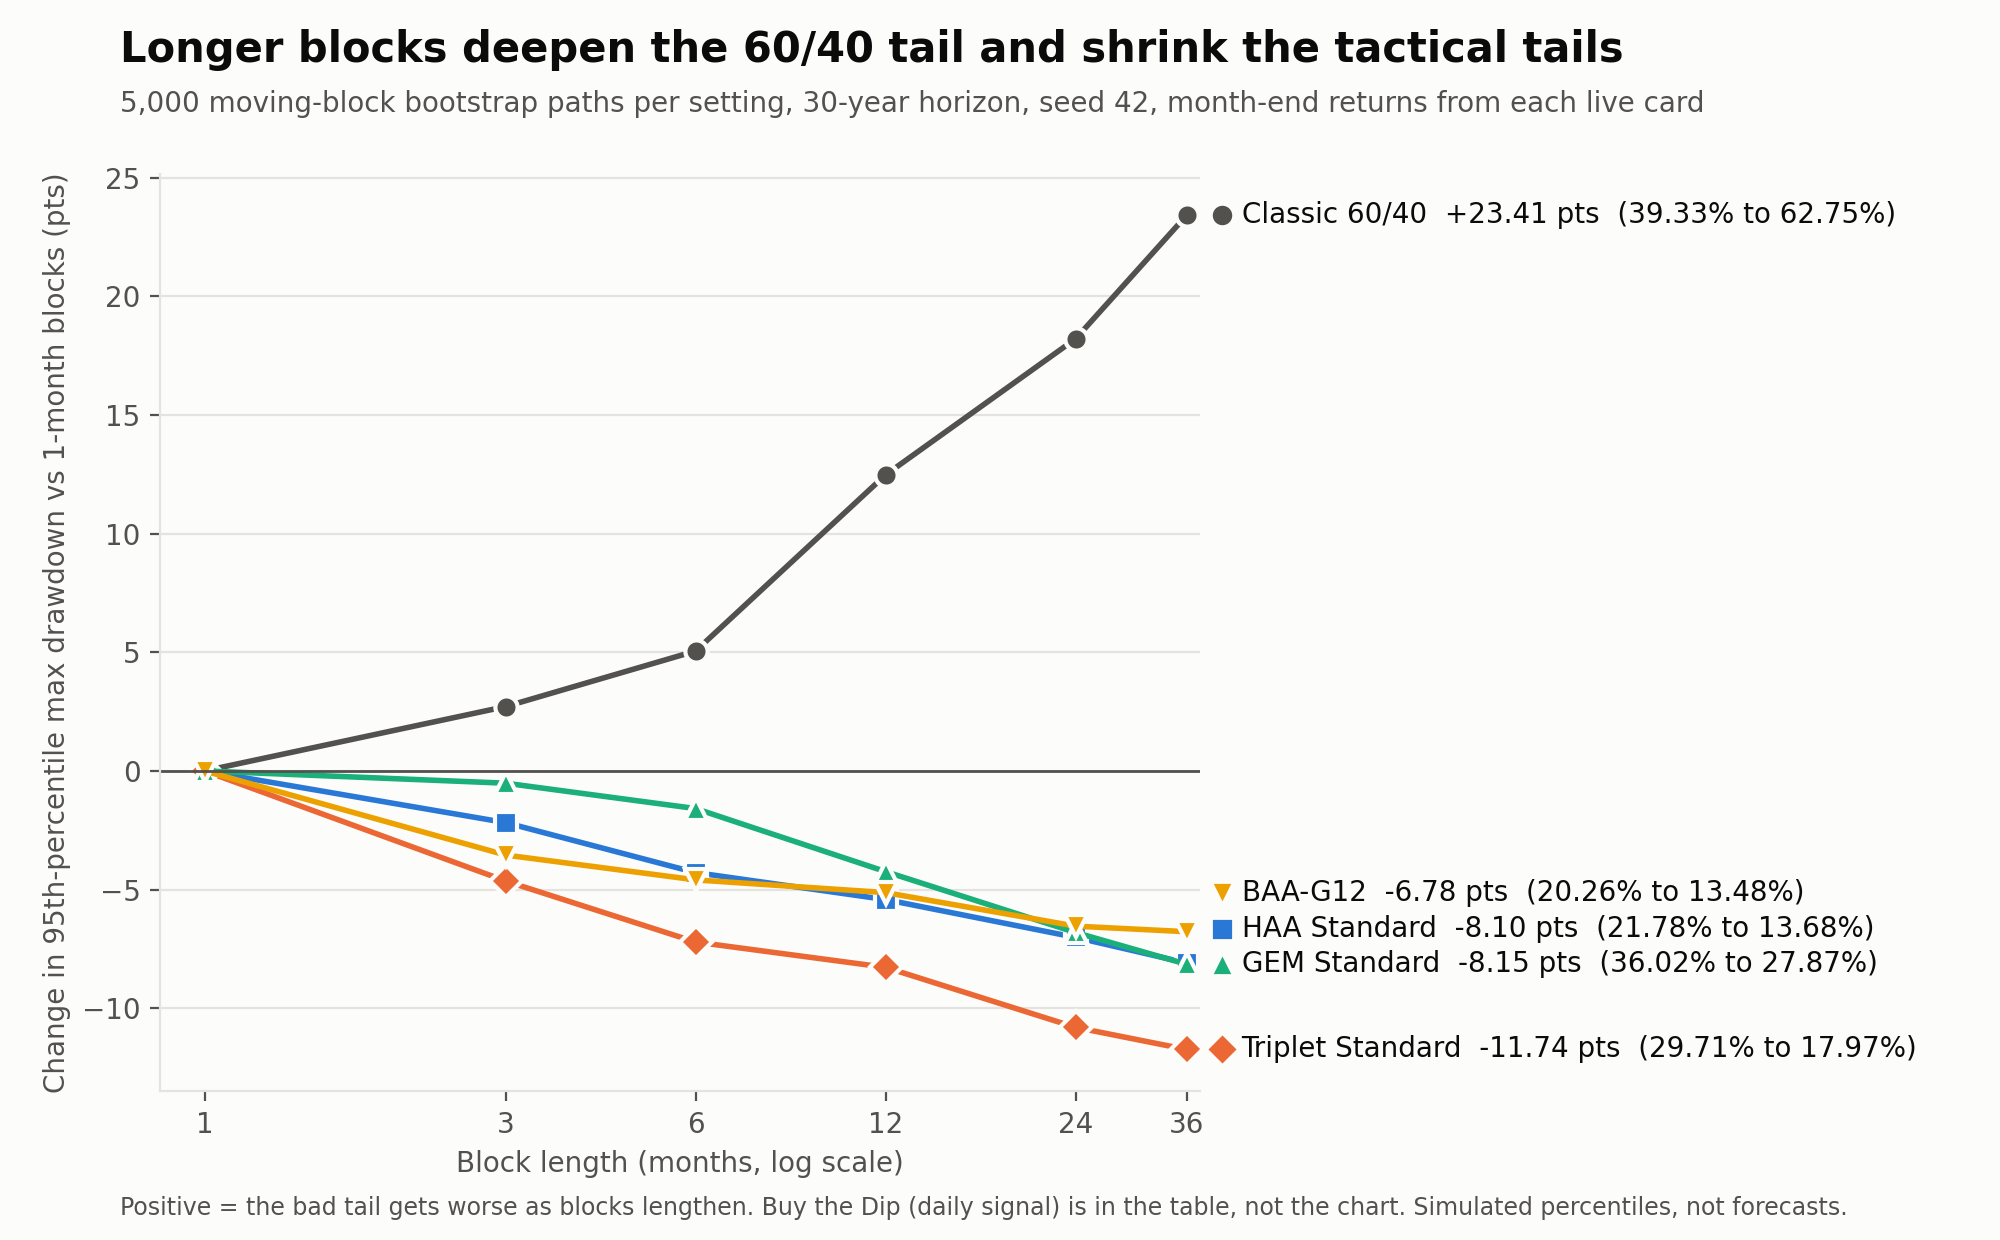
| Classic 60/40 | 8.69% to 8.81% | 39.33% | 62.75% | +23.41 pts |
| HAA Standard | 16.40% to 16.43% | 21.78% | 13.68% | -8.10 pts |
| Triplet Standard | 14.51% to 13.93% | 29.71% | 17.97% | -11.74 pts |
| GEM Standard | 14.20% to 12.77% | 36.02% | 27.87% | -8.15 pts |
| BAA-G12 | 11.88% to 11.18% | 20.26% | 13.48% | -6.78 pts |
| Buy the Dip Standard | 27.17% to 27.12% | 80.34% | 67.67% | -12.68 pts |
For 60/40, longer blocks make the bad tail worse, as before. For every tactical strategy they make it better. For the four monthly strategies the 95th percentile falls at every step from 1 to 36 months rather than jumping at one setting. Among them, Triplet loses the most tail: its 95th-percentile drawdown goes from 29.71% to 17.97%.
Is that noise? I ran every setting with 20 different seeds. The standard deviation of the 95th percentile was at most 0.55 points for the monthly strategies and 60/40, and 0.80 points for Buy the Dip. Every move in the table is more than 12 times the largest of those standard deviations.
Why the direction flips
A drawdown is a run of bad months that nothing interrupts. The bootstrap only changes how often such runs appear.
For 60/40, history is worse than a shuffle. Its bear markets are long clusters; 1929 to 1932 is the deepest in this history. The worst 1% of its historical 12-month returns is -25.07%. Shuffle the same months one at a time and the worst 1% of 12-month stretches is only -18.37%, because random good months keep interrupting the slide. Long blocks put the clusters back, so the tail gets worse.
A tactical strategy is built to do the opposite. Its typical history is a bad month, then the rule steps aside into bonds or cash. That sequence is the run that matters, and u/QuanTradin was right that short blocks chop it up. But chopping it does not hide risk. It invents risk: a 1-month bootstrap strings losing months together in orders the real record never contained, and the real record is where the rule's exits live.
| Strategy | Worst 1% of 12-month returns, history | Same months shuffled |
|---|---|---|
| Classic 60/40 | -25.07% | -18.37% |
| HAA Standard | -5.62% | -8.53% |
| Triplet Standard | -9.36% | -13.69% |
| GEM Standard | -12.45% | -16.88% |
| BAA-G12 | -5.88% | -8.71% |
For all four monthly strategies the real order of the months is kinder than a random order. That is the whole effect in one table.
Does it survive other bootstraps?
The moving-block bootstrap has a known quirk. With long blocks it draws months near the start and the end of the history less often, because fewer blocks can cover them. Most tactical histories start in 1985 to 1987, so this deserves a check. I reran everything with a circular block bootstrap, where blocks wrap from the last month back to the first and every month is equally likely, and with a stationary bootstrap, where block lengths are random around the same mean.
The direction held in both. HAA's 95th-percentile drawdown goes from 21.78% to 14.00% under the circular version, 60/40's from 39.33% to 61.99%.
The check did change one thing. In the table above, GEM's median CAGR drops 1.43 points at 36-month blocks, BAA's 0.70 and Triplet's 0.58. Under the circular bootstrap, none of the four monthly strategies or 60/40 moves its median CAGR by more than 0.12 points. That drift is the edge quirk, not the strategies. It also explains Buy the Dip's 36-month row: its worst month, October 1987, sits 23 months into a 491-month history, and a 36-month-block path contains it only 42% of the time against 52% with 1-month blocks. I would not read anything into that row.
Because of this quirk, the Monte Carlo panel on the strategy pages now uses the circular version, with the same 12-month default, so its figures move a little.
One more control. 60/40 has 1929 in its history and the tactical strategies do not. So I cut every series to the same window, 1987-11 to 2026-09. 60/40's 95th-percentile drawdown still rises with block length (28.30% to 36.61%), and every tactical strategy still falls. The result is not just the Depression.
50,000 paths: looking for the fat tail
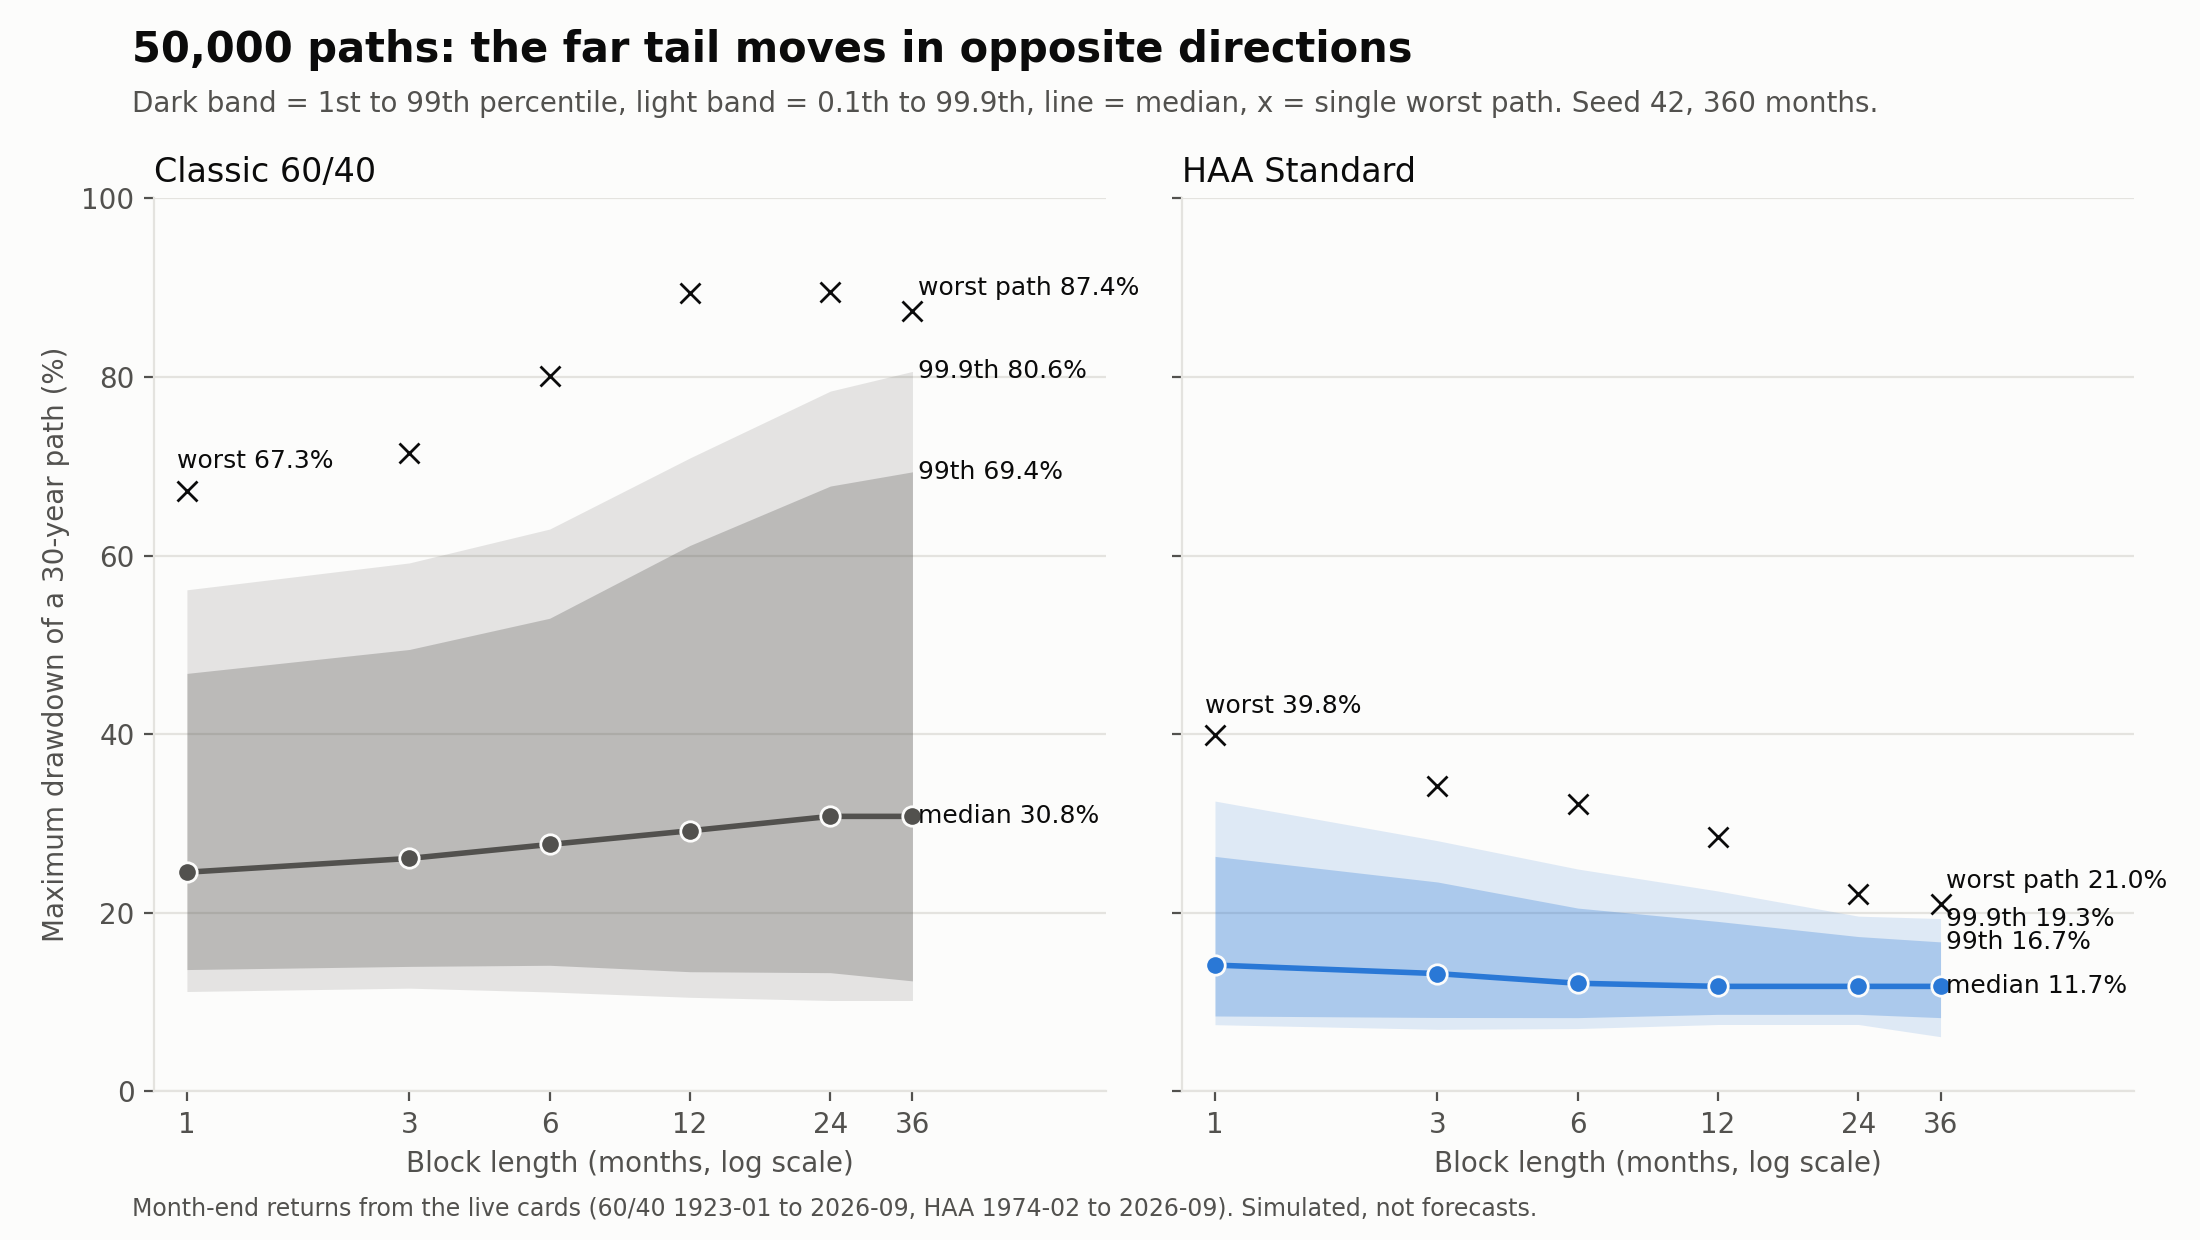
u/HBCTIA's question was whether something ugly hides past the 95th percentile. Here is HAA, the strategy with the longest tactical history, at the two ends of the block range:
| HAA Standard, 50,000 paths | 1-month blocks | 36-month blocks |
|---|---|---|
| CAGR, 0.1th percentile | 9.83% | 9.59% |
| CAGR, 1st percentile | 11.41% | 11.12% |
| CAGR, 99th percentile | 21.56% | 22.00% |
| CAGR, 99.9th percentile | 23.34% | 23.78% |
| Max drawdown, 99th percentile | 26.30% | 16.72% |
| Max drawdown, 99.9th percentile | 32.50% | 19.34% |
| Worst single path | 39.84% | 21.01% |
Across all four monthly strategies and all six block lengths, not one of the 50,000 paths lost money over 30 years. The 0.1th-percentile CAGR never fell below 5.88%. The share of paths with a drawdown deeper than 50% was zero for HAA and BAA, at most 0.01% for Triplet and at most 0.13% for GEM.
The two series that do have a fat left tail are the ones you would expect. For 60/40, 22.37% of 36-month-block paths fall more than 50% at some point, and the worst path loses 87.41%. For Buy the Dip, more than 40% of paths cross 50% at every block length, and the worst 1-month-block path loses 99.14%.
The extreme paths are worth opening, because they show what the far tail actually is:
- HAA's worst 1-month-block path (39.84%) is a 47-month slide built from 47 scattered single months, five of them drawn twice. History never put those months together.
- HAA's worst 36-month-block path (21.01%) is March to May 2000 followed by May and June 2010, two real stretches a decade apart joined at a block boundary.
- 60/40's worst 36-month-block path (87.41%) is three overlapping pieces of 1929 to 1932 in a row.
- Buy the Dip's worst path draws October 1987 six times.
At 50,000 paths the far tail is mostly a count of how many times the generator can redraw the same handful of bad months. That is useful to know, but it is a property of the sampler, not a hidden market regime. Going from 5,000 to 50,000 paths moved the 99th-percentile drawdown by at most 1.02 points for any series. Going from 1-month to 36-month blocks moved it by 7.34 to 22.58 points.
What the bootstrap cannot tell you
There is a cost to long blocks on short histories. With 40 to 50 years of data and 30-year paths, a 36-month bootstrap is close to history cut into 10 pieces and reshuffled. HAA's median drawdown at 12, 24 and 36-month blocks is exactly 11.74%, its own historical month-end maximum. The simulation can stack known bad stretches. It cannot produce a kind of bad stretch the strategy never lived through.
For a tactical strategy that is the risk that counts: the rule meeting a regime where its signals stop working. 2022, when stocks and bonds fell together, is the closest thing in these histories: GEM and BAA-G12 both set their month-end maximum drawdowns in the stretch that began then. No block length puts a regime into the data that the data does not contain.
A few more limits:
- Month-end only. Daily falls that recover within the month are invisible.
- Deep history is partly reconstructed. HAA's TIP canary before about 1998 runs on a synthesized series, and Buy the Dip's 1987 crash month comes from a simulated 3x Nasdaq leg.
- Politis and White's automatic rule asks for blocks under 4 months on raw monthly returns for every series here, because the returns are nearly uncorrelated. On absolute returns, which carry volatility clustering, it asks for 13 to 26 months for HAA, GEM and BAA-G12, only 3 for Triplet, and 61 for 60/40. For three of the four tactical cards, that supports a 12-month default more than a 1-month one.
What I take from it
The 60/40 lesson still holds: always look at a sensitivity table, never at one block length. But "use longer blocks to be conservative" is a 60/40 rule. For a monthly tactical strategy, the pessimistic setting is the short block, because it breaks the exits the strategy is built around.
The Monte Carlo panel on each strategy page defaults to 12-month blocks. For the four tactical strategies here, that sits between the two ends: HAA's 95th-percentile drawdown is 16.36% at 12 months, against 21.78% at 1 month and 13.68% at 36. If you want the cautious view of a tactical card, set the block to 1 month and read the tail there.
Thanks to u/paragon_22, u/QuanTradin and u/HBCTIA for picking this one. I am happy to run another strategy through it if you name one.
Method notes
- Generator: the production moving-block bootstrap, verified bit-identical. Blocks 1, 3, 6, 12, 24, 36 months. Horizon 360 months. Seed 42. 5,000 paths for the main tables, 50,000 for the tails, 20 seeds for the noise check.
- CAGR is each path's terminal value annualised over 30 years. Maximum drawdown is the largest fall from a running peak of the simulated month-end path.
- Inputs: month-end values of each strategy's current card backtest, through 2026-09.
- Robustness: circular block bootstrap, stationary bootstrap, a common 1987-11 window.
- References: Künsch (1989) and Politis and Romano (1994) on block bootstraps; Politis and White (2004) with Patton, Politis and White (2009) on automatic block length.
HAA, Triplet, GEM, BAA, Buy the Dip, Classic 60/40, and the original 60/40 block-length post.
Simulated percentiles, not forecasts. Past performance does not guarantee future results. Backtested results are hypothetical and do not represent actual trading.