Long Treasuries saved a portfolio during the 2011 downgrade, the COVID crash and the 2024 yen-carry unwind. They fell with stocks during Volmageddon and the April 2025 tariff shock. That split produced the obvious follow-up to our fast-crash study: could an investor have seen the bad Treasury cases coming?
A rolling stock-bond correlation sounds like the clean answer. When stocks and long bonds have already started moving together, perhaps TLT deserves a smaller defensive weight. We tested that rule before the same 5 selloffs. It gave the right answer twice.
The test we fixed in advance
We used daily total returns for SPY and TLT. On the last trading day before each selloff, we measured their trailing 60-session correlation. A reading above zero predicted that Treasuries would fail during the crash window. A reading at or below zero predicted that TLT would rise.
We also calculated a z-score against the trailing history available at that date, up to 3 years. The event dates stayed exactly as published in our original fast-crash study. No window moved to help the filter.
| Selloff | Pre-crash 60d correlation | TLT in crash | Filter call | Result |
|---|---|---|---|---|
| Aug 2011 downgrade | -0.427 | +10.26% | Treasuries help | Correct |
| Feb 2018 Volmageddon | -0.213 | -3.76% | Treasuries help | Miss |
| Feb-Mar 2020 COVID | -0.523 | +14.23% | Treasuries help | Correct |
| Aug 2024 yen carry | +0.351 | +4.56% | Treasuries fail | False alarm |
| Apr 2025 tariff shock | -0.004 | -3.37% | Treasuries help | Miss |
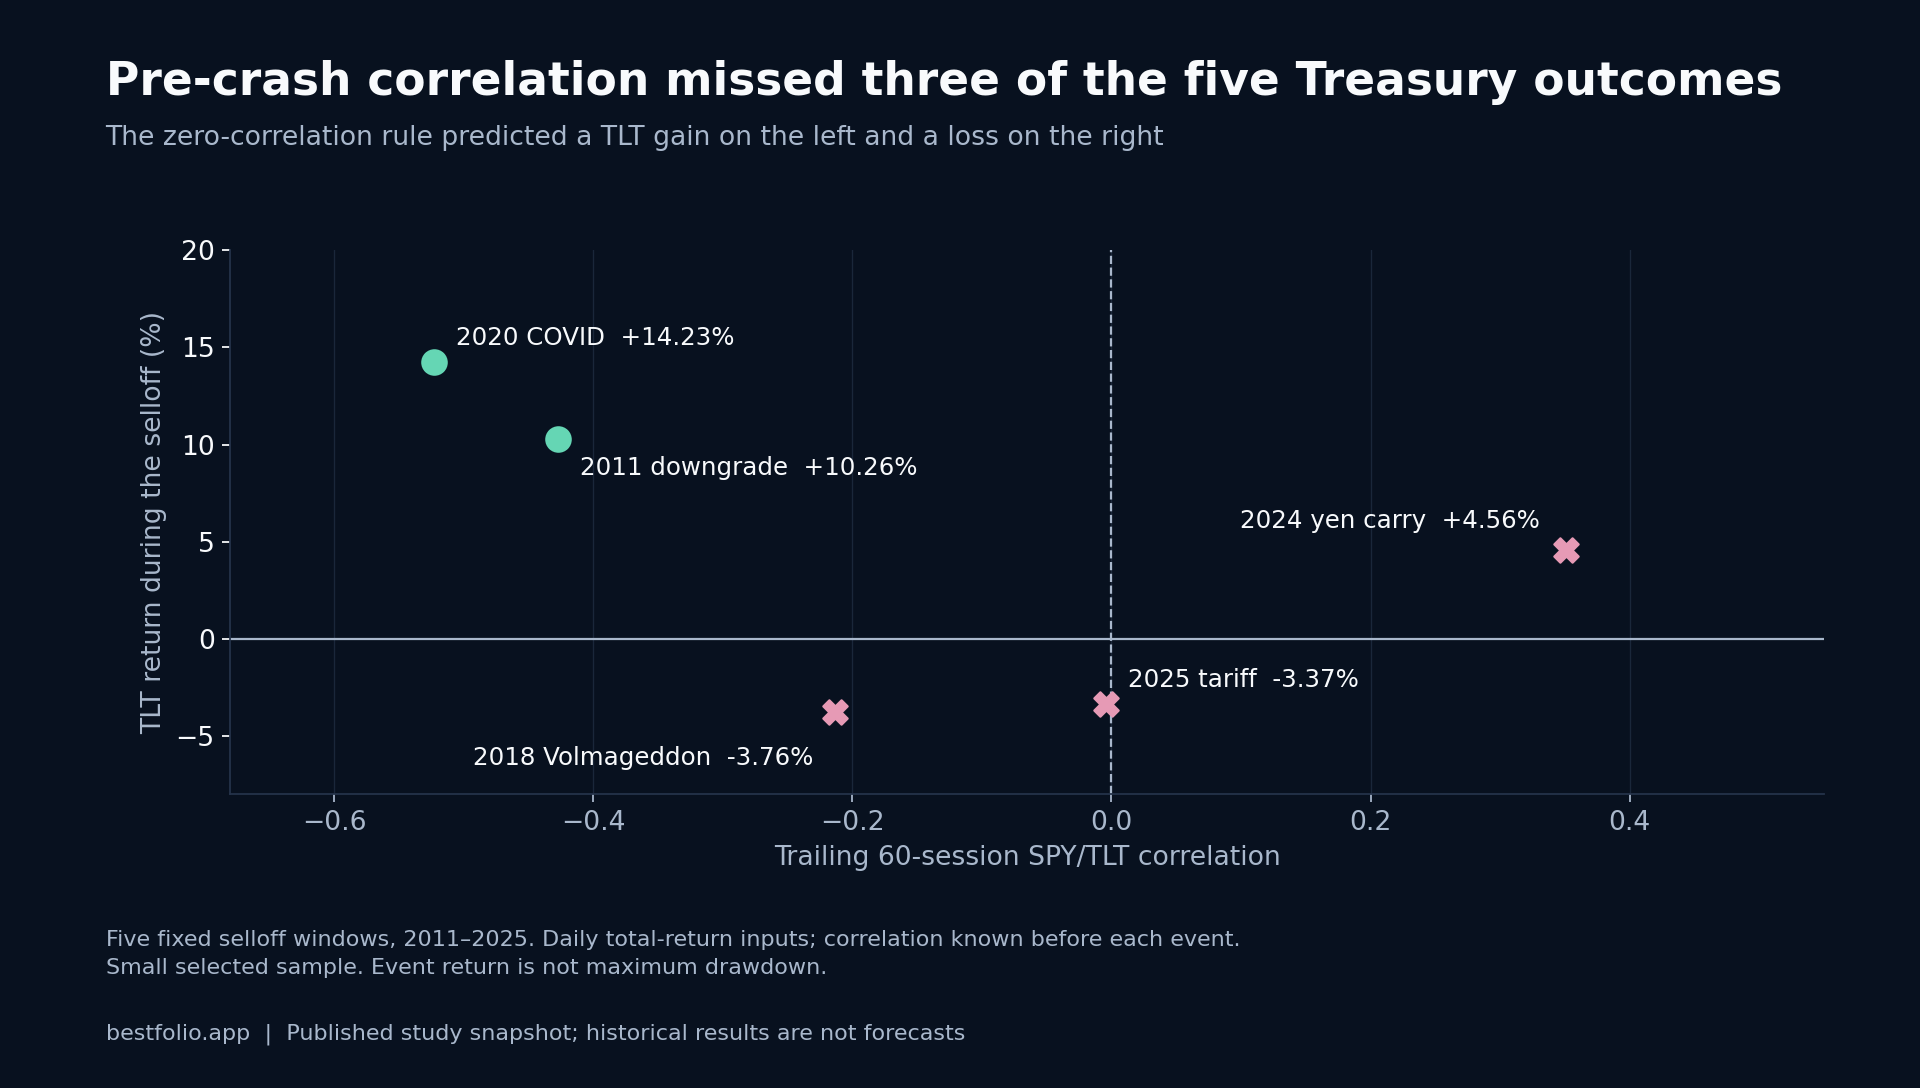
The 2024 case is the awkward one. Correlation had climbed to +0.351 and sat 1.23 standard deviations above its recent mean, exactly the setup the filter was built to flag. TLT then gained 4.56% while SPY fell 6.07%.
The April 2025 case failed from the other direction. Correlation was almost exactly zero at -0.004. TLT still lost 3.37% during the equity break.
The calm-period test is worse
Five events can make almost any indicator look clever. So we ran the zero threshold at every month-end from 2010 through June 2026. A warning counted as useful only when SPY suffered a 5% drawdown within the next 10 trading sessions.
The filter warned in 46 months. Only 2 warnings were followed by that drawdown. The other 44 were false positives, a 95.65% false-positive share.
Moving the threshold did little. At -0.10, the rule warned 62 times and 91.94% were false positives. At +0.10, it warned 35 times and 94.29% were false positives. The sign of recent correlation carried too little information about the next shock.
Why the backward window struggles
Stock-bond correlation describes the shocks that dominated the previous 60 sessions. A crash can change the dominant shock overnight.
Volmageddon arrived while inflation expectations and yields were already rising. The tariff break mixed an equity growth scare with a rates shock. The yen-carry unwind created a sudden demand for duration even though the prior correlation was positive. A trailing statistic had no direct view into any of those causes.
The z-score adds historical context, though it still reads the same rear-view window. In our sample, an unusually high correlation produced the clearest false alarm.
Where correlation still helps
Correlation remains useful for sizing a portfolio. A long period of positive stock-bond correlation tells you that a 60/40 mix has recently delivered less diversification. It can justify smaller duration exposure, more cash, or an extra defensive sleeve. The evidence here gives it little support as a binary crash switch.
That distinction matters for tactical rules. BAA ranks several defensive assets and applies a T-bill floor instead of betting the entire regime call on one stock-bond statistic. The mechanism has more moving parts, but it avoids asking a 60-day correlation to identify the cause of tomorrow's selloff.
Our sample is small by construction, and the five windows cover different kinds of shocks. A larger event list may change the exact hit rate. This fixed test still killed the simple version of the idea: positive recent stock-bond correlation did a poor job of predicting when long Treasuries would fail.
Related: Gold, Treasuries, or Managed Futures in the 5 Fastest Selloffs.