A monthly strategy calculates its signal at the close. The investor reads it later, places an order, and may trade one or 2 sessions after the backtest.
That operational delay sounds tiny beside a 12-month momentum lookback. It cost roughly 1 annual return point for HAA and BAA when we added 2 sessions across the full replay.
What delay zero means
The BestFolio engine calculates a month-end signal with data through the close of day D. The new allocation becomes active for the next trading session. We call that delay zero because it is the canonical implementation, even though the trade already occurs after the signal close.
Delay one pushes every signal one additional business session later. Delay 2 pushes it 2. Weekends are skipped, and exchange holidays resolve to the next date in the price series.
We ran the standard 1x versions of GEM, HAA and BAA-G12 from February 1999 through 14 July 2026. Every version paid a 10bp one-way base cost. The engine raises modeled cost during high-volatility periods, capped at 3 times the base.
The result
| Strategy | Canonical next session | Plus 1 session | Plus 2 sessions | 2-session change |
|---|---|---|---|---|
| GEM | 9.83% | 9.54% | 9.75% | -0.08 points |
| HAA | 13.39% | 12.72% | 12.37% | -1.02 points |
| BAA | 10.90% | 10.29% | 9.87% | -1.03 points |
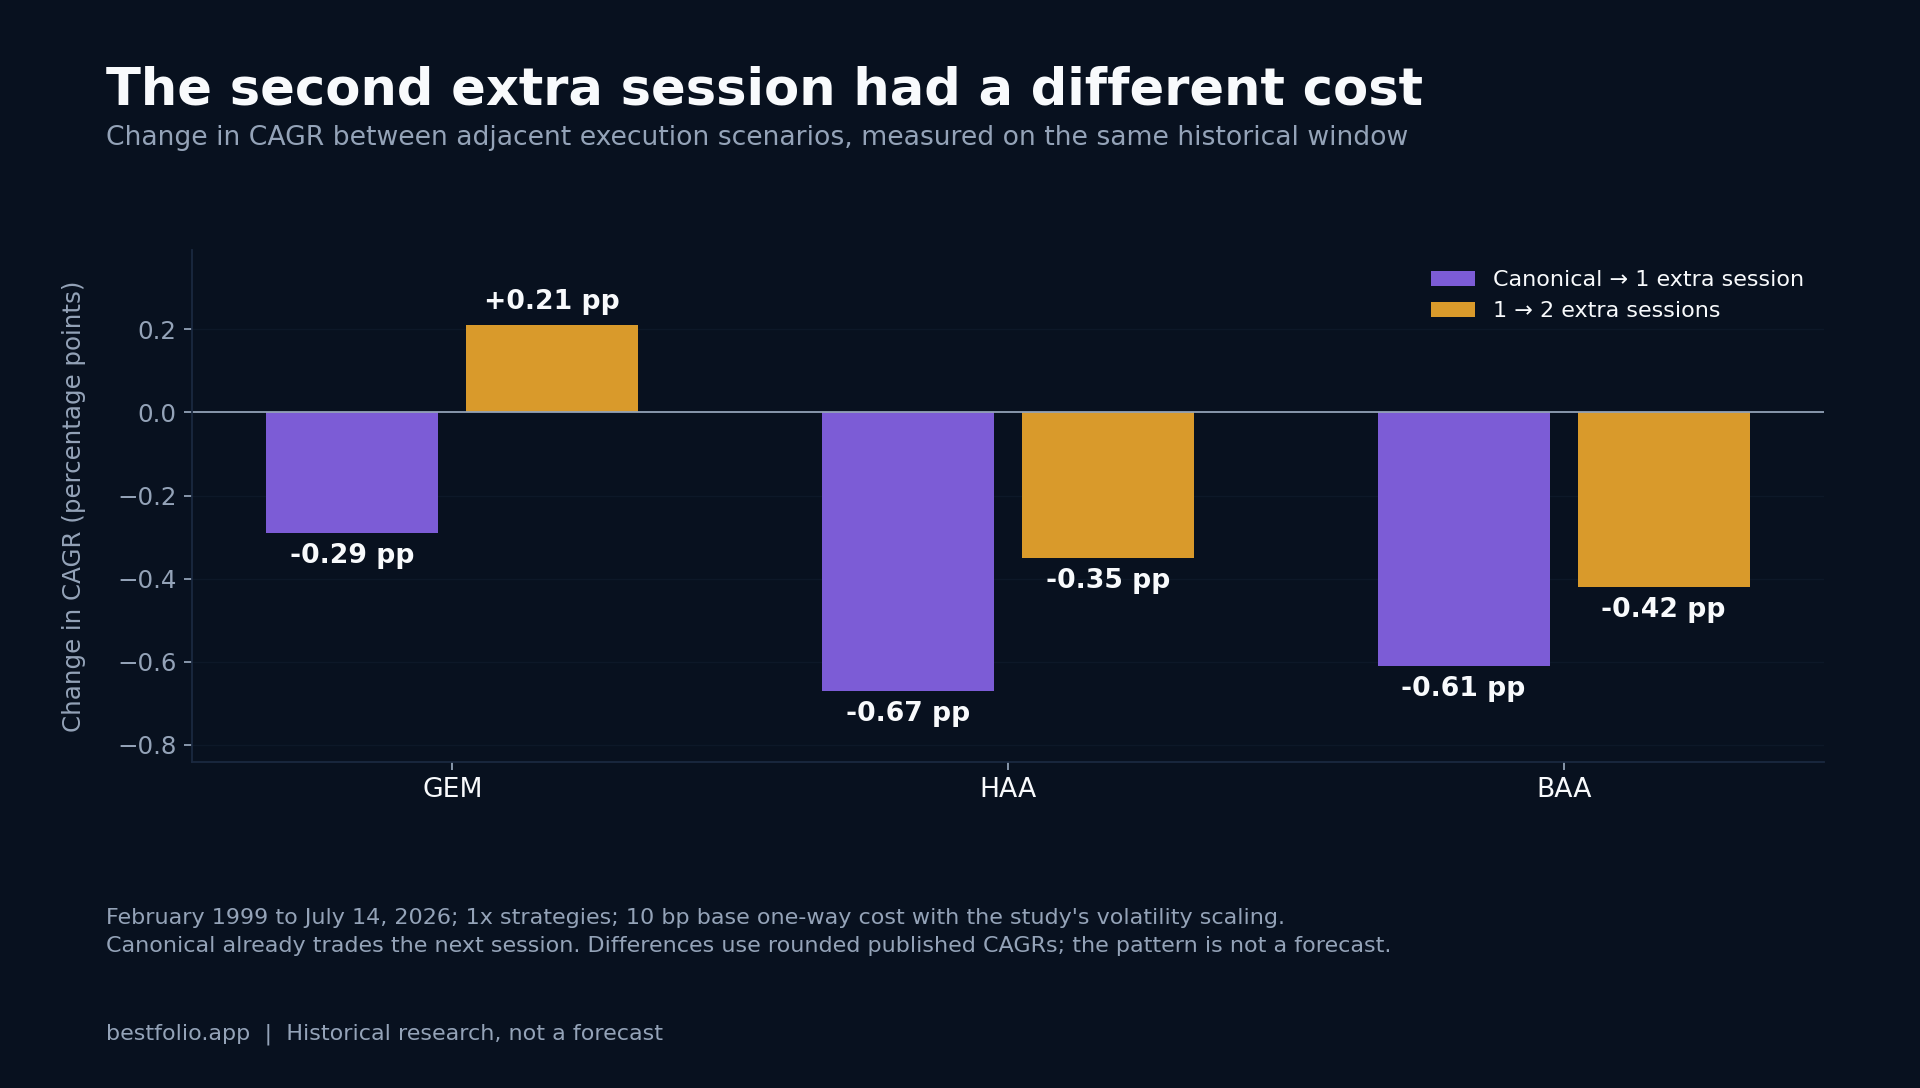
HAA and BAA degraded in a clean direction. One extra session cost 0.67 and 0.61 points of CAGR. The second extra session took each total loss just past 1 point.
GEM was noisy. Its first delayed version lost 0.29 points, while the 2-session version recovered most of that gap and finished only 0.08 points below canonical. GEM made 38 turnover events in the test. HAA made 202 and BAA 229. A sparse rule has fewer dates where execution luck can accumulate.
Delay can help one backtest
The GEM rebound from day 1 to day 2 is a reminder that delay cost is path-dependent. If the skipped session falls, the late trade helps. If it rises, the trade pays for waiting.
Across many signals, a persistent gap can come from month-end flows, overnight returns, or simple chance. This three-strategy study measures what happened under one fixed convention. The cause remains open.
A researcher who tries delays of 0 through 10 and publishes the best one has fitted the execution schedule. The live process then needs to hit that exact time for an edge that may have come from a few dates.
The operational failures behind a late trade
Some delay is voluntary. An investor waits for the next close, uses a limit order, or trades after work. Other delays point to a system problem: stale month-end data, a holiday-calendar mismatch, a failed market-data job, an order rejection or a broker position that disagrees with the signal store.
Those cases deserve separate logs. A backtest delay test says how much room the strategy historically had. It cannot prove that the live order matched the intended holdings.
A monthly process should record the data timestamp, signal timestamp, target allocation, submitted order, fill and final position. The reconciliation can then distinguish a deliberate next-close policy from a pipeline that silently traded late.
How much room did these rules have?
GEM tolerated 2 extra sessions in this sample with little long-run damage, though its one-day result was worse. HAA and BAA paid about 1 CAGR point. Their drawdowns did not deteriorate in the same order: BAA's max drawdown moved from -14.45% to -13.56% at 2 sessions even as return fell.
The return cost alone can therefore understate the operational change. Recovery time, turnover and the exact crisis trades still need checking.
The current HAA page uses canonical next-session execution. Subscribers consuming a signal later should treat the table as a historical sensitivity, then choose a repeatable trading policy that fits their broker and timezone.