A BestFolio book
Tactical Asset Allocation for Beginners
A written plan for the next crash. 5 strategies explained from zero, a spreadsheet that tells you what to hold each month, and the setup for your account in the US or Europe.
220-page PDF, 7 workbooks, the code behind every test and a 2-page cheat sheet. One-time purchase, no subscription, no coding.
By Laurent, founder of BestFolio.
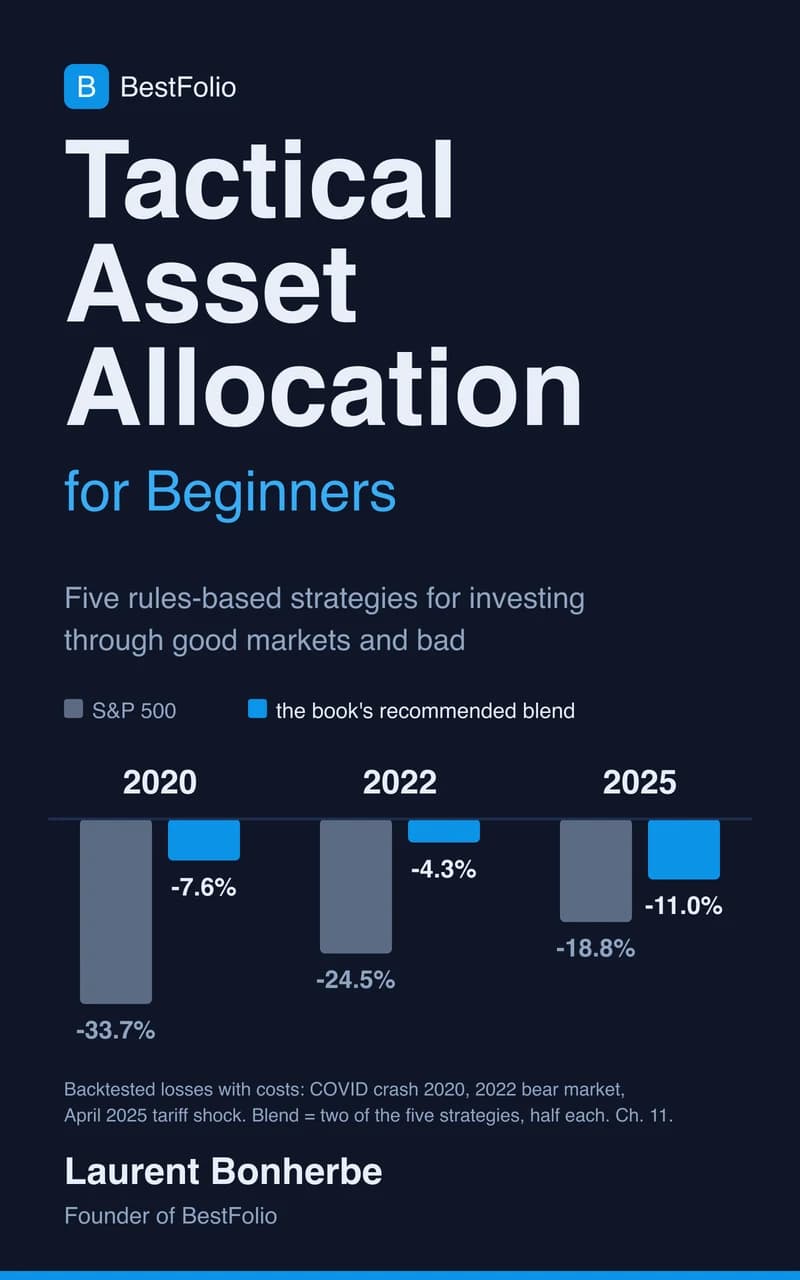
What the book's blend did in the last 3 crashes
The blend is 2 of the book's 5 strategies, HAA and the Momentum-Correlation Triplet, half each. You build it yourself with the workbooks.
- S&P 500
- -33.7%
- The blend
- -7.6%
- S&P 500
- -24.5%
- The blend
- -4.3%
- S&P 500
- -18.8%
- The blend
- -11.0%
Backtested on real ETFs, trading costs included. Each figure is the loss from the first to the last date shown. Past results don't promise future ones.
Smaller falls have a price. Over the whole test, January 2009 to September 2026, the S&P 500 returned 14.9% a year and the blend 12.1%. The book shows both, and helps you work out which one you'd actually stick with.
Look inside
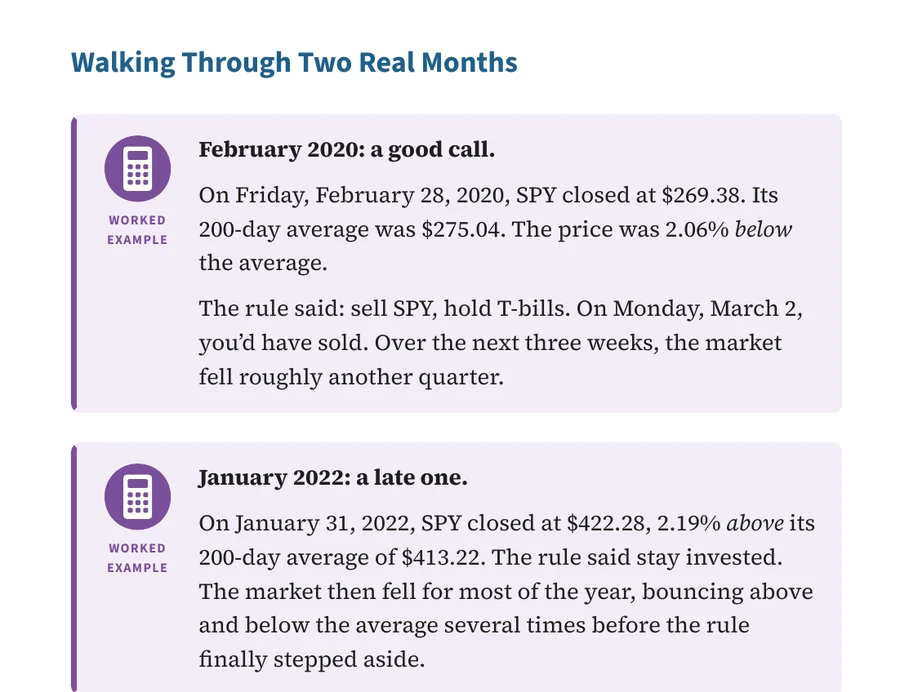
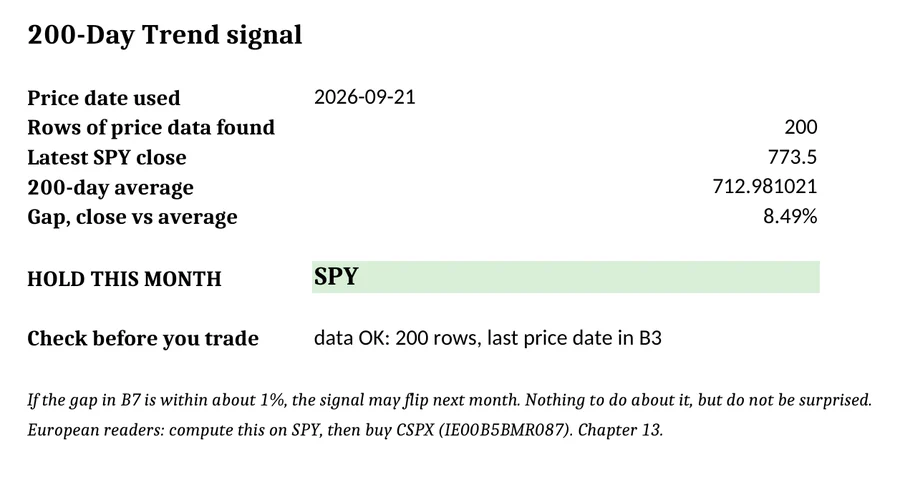
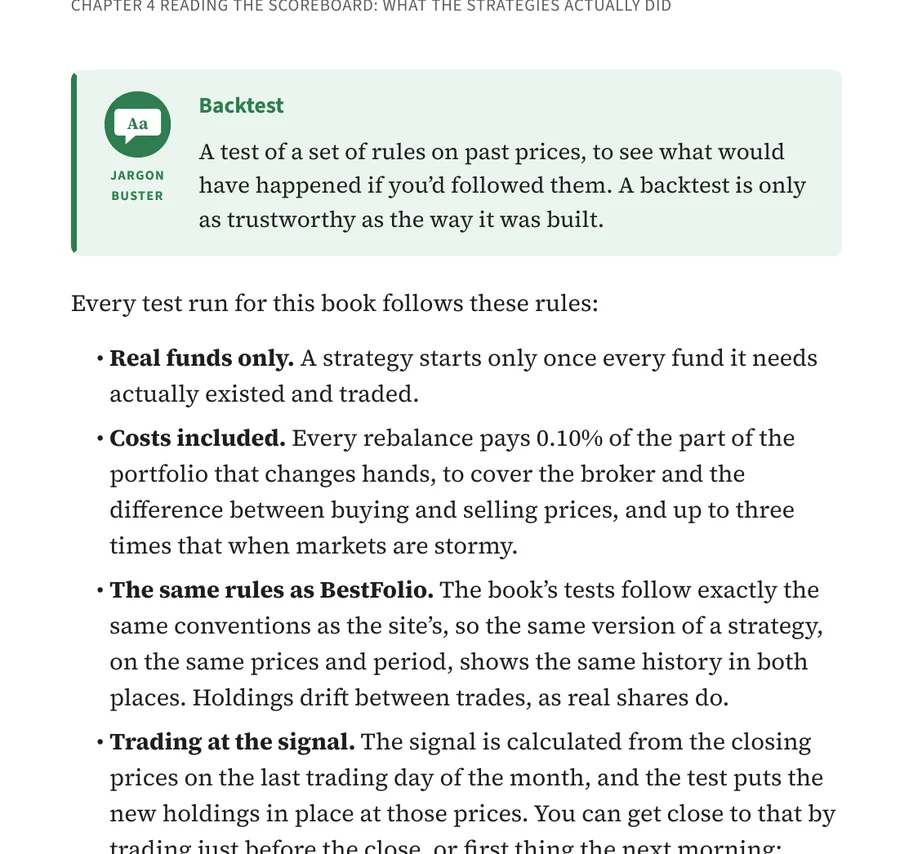
These pages are from the free sample: the introduction, the results chapter and the whole 200-Day Trend chapter. Download the sample (PDF) and its workbook (Excel).
What you get
- Why a plan for bad markets matters, built up from zero, with every term explained where it first shows up.
- 5 strategies, each with its rule, a real month worked through, and its bad years: the Golden Butterfly, the 200-Day Trend, GEM, HAA and the Momentum-Correlation Triplet.
- How to blend them, and why HAA and the Triplet, half each, had the smallest worst fall of everything the book tests.
- Your setup in the US or Europe: the funds by ISIN, the account (IRA, 401(k), ISA, PEA, assurance-vie and more) and what each strategy costs you in tax.
- A monthly routine of 20 to 40 minutes, what to do when a strategy has a bad run, and when to stop.
- 7 workbooks (Excel, Google Sheets or LibreOffice), the Python code behind every test, and a 2-page cheat sheet.
Who it's for
For you if
- you own an index fund and want a plan for the bad years
- you'd rather follow written rules than headlines
- you can spare 20 to 40 minutes once a month
Not for you if
- you want to beat the S&P 500 in a bull market (see above)
- you're after stock picks or daily trading
Rather not paste prices every month?
BestFolio Pro runs the 2 strategies the book ends on, HAA and the Triplet, and publishes their signal every month, with the rest of the strategy library. Drift alerts tell you when your portfolio has moved off target.
- Pro includes the book. Annual: from the day you join. Monthly: once your 3rd monthly payment goes through. Either way it's yours to keep.
- Never paid for a BestFolio subscription? Buy the book now, and if you take annual Pro within 90 days, what you paid for the book comes off your first year.
- New Pro subscriptions come with a 14-day money-back guarantee on the first payment.
Who wrote it
Laurent, founder of BestFolio. I've invested since the early 2000s and run tactical allocation with written rules since 2013. BestFolio is where I test these strategies in the open. This book is the guide I'd have wanted when I started.
Questions
What exactly do I get?
Do I need to know Excel or code?
Does it work for my account?
Why do I need an account to buy?
What about tax on the price?
Can I get a refund?
Errata
13 October 2026: Chapter 17 and Appendix A, getting the prices. The book says Yahoo Finance offers free downloads of adjusted closing prices. Yahoo now keeps the Download button on its Historical Data tab for paying Yahoo Finance Gold subscribers. The table itself is still free to view, so the routine works without it: open the ticker's Historical Data tab on finance.yahoo.com, pick the period and the frequency (Daily or Monthly), copy the table into a blank sheet, then copy its Adj Close column into the workbook's yellow cells.
Two things to watch. Yahoo lists the newest date first and puts dividend lines between the price rows: drop the dividend lines and put the oldest date at the top. A one-year daily view shows about 250 rows, so for the Triplet's 253 daily closes choose a longer period. The book's Stooq tip still applies, but we have not re-checked Stooq's adjusted prices for this note. The next edition will carry the corrected steps.
Get the book
$39.