The monthly scoreboard for July 2026, generated straight from the strategy catalog. Start with the model portfolios, the diversified blends most people should actually hold, then work down to the full board of 69 strategies. Every table carries the month, the year to date and the trailing 1-year return, because the long view is the one that decides whether a strategy is worth holding.
Model portfolios: the blends that matter most
These are the ready-to-clone model portfolios we track, spanning three risk profiles from conservative to aggressive. Each is a blended, multi-strategy allocation from the portfolio library, not a single strategy, so this is the honest read on how a diversified BestFolio investor actually did, over the month, the year, and since inception.
| Model portfolio | Risk | Month | YTD | 1Y | CAGR since inception |
|---|---|---|---|---|---|
| Simple Defensive Core | Conservative | -0.4% | +1.9% | +12.2% | 7.1% |
| All Weather Tactical Blend | Moderate | -1.6% | +6.0% | +15.6% | 10.9% |
| BestFolio House Momentum | Aggressive | -2.7% | +12.3% | +26.3% | 19.3% |
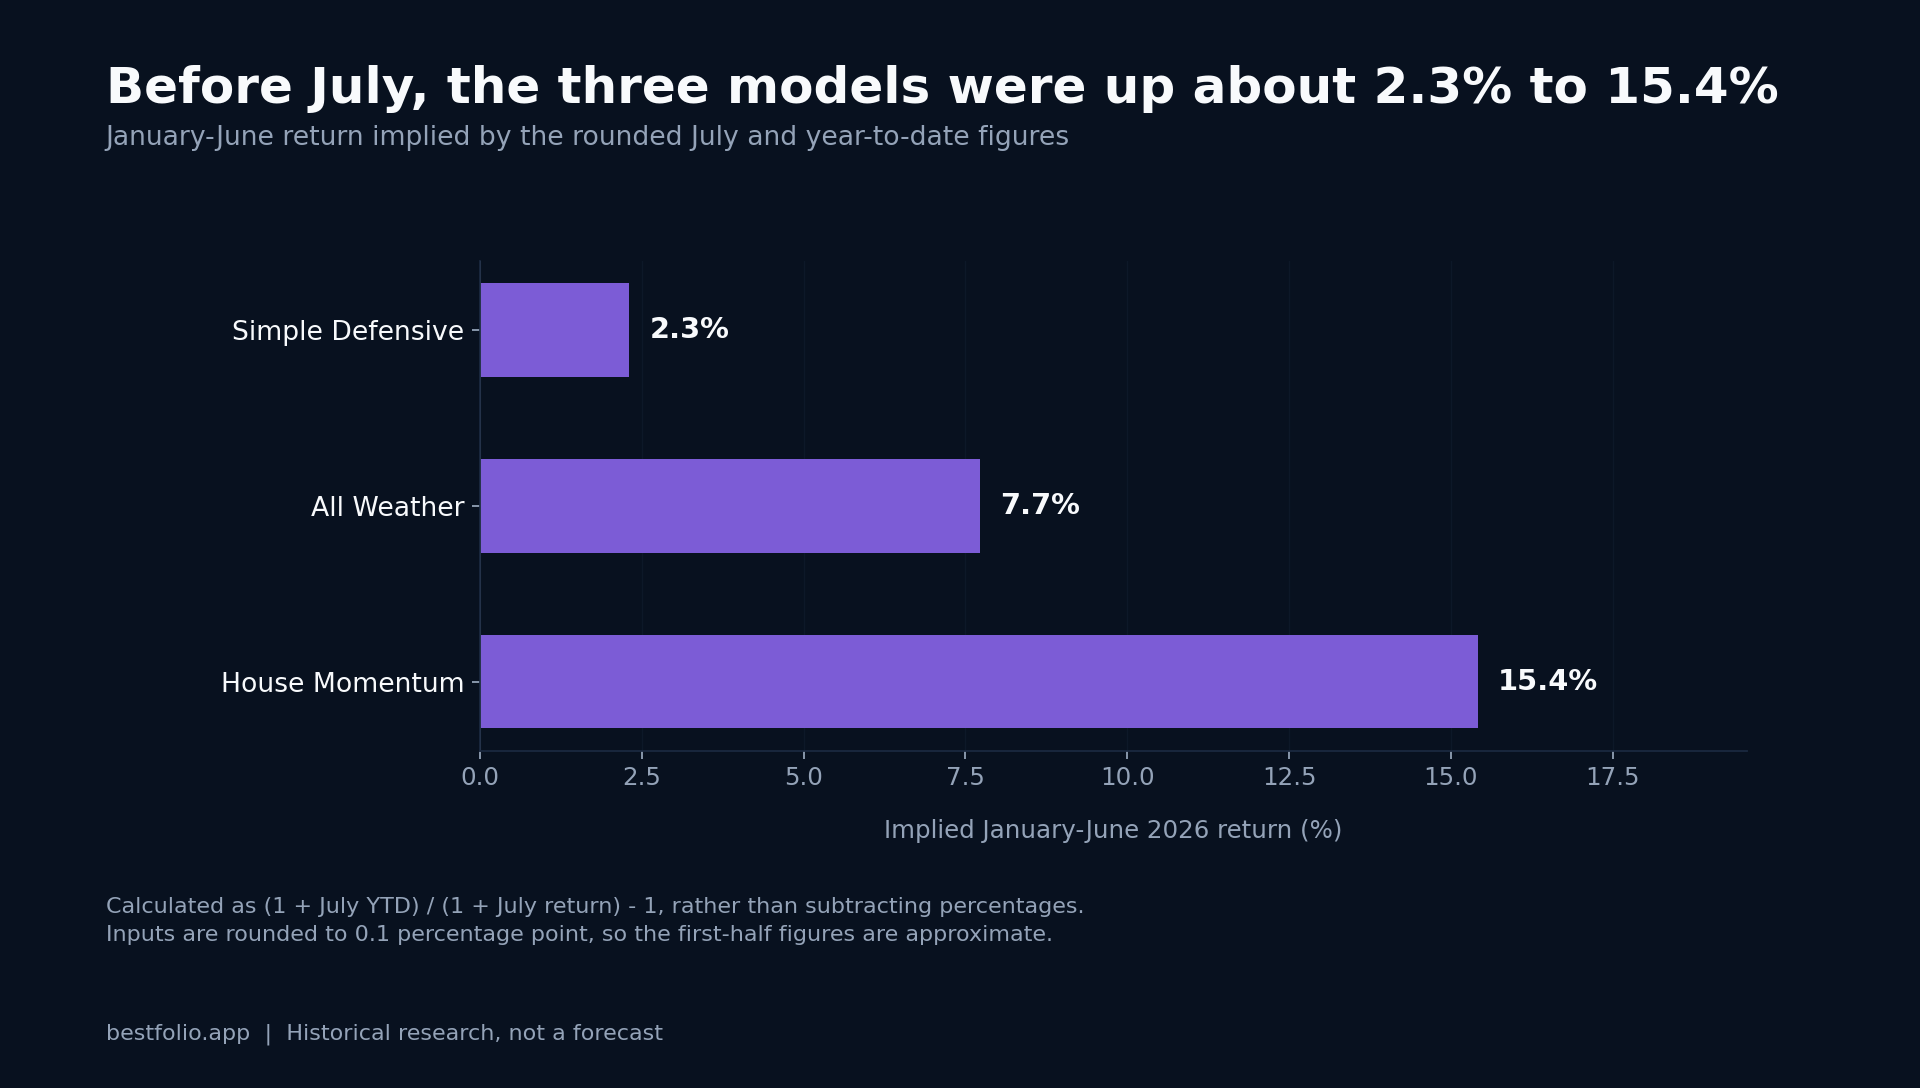
How to read July 2026
Breadth check. Of the 58 strategies on the unlevered board, 33 beat the US market (-0.5%) in July 2026, and 8 are ahead of it year to date. The month itself ran from +5.2% (EAA (Elastic Asset Allocation)) down to -7.2% (BAA (Bold Asset Allocation)), a spread of 12.4% in a single month.
Worth noting that EAA (Elastic Asset Allocation), the best strategy of July 2026, is not in the year-to-date top five. One month is one data point. The strategies worth holding are the ones that keep compounding over the year and beyond, which is why every table here carries YTD and 1-year, not just the month.
Benchmarks for context: 100% US Stock Market -0.5% for the month (+10.5% YTD, +19.8% 1Y).
Year-to-date leaders
The strategies compounding best so far this year, one row per strategy. This is the table that matters more than the month.
| Strategy | Variant | Month | YTD | 1Y |
|---|---|---|---|---|
| Mama Bear Portfolio | Mama Bear Standard | +2.6% | +19.2% | +33.0% |
| HAA (Hybrid Asset Allocation) | HAA SmartStack (Gold+MF) | -0.1% | +16.0% | +39.4% |
| PAA (Protective Asset Allocation) | PAA Dynamic Protection | -1.3% | +14.5% | +29.1% |
| Momentum-Correlation Triplet | Triplet Standard | +3.3% | +13.8% | +32.9% |
| Robust Asset Allocation | Robust AA Aggressive | +2.5% | +13.0% | +25.1% |
| Adaptive Asset Allocation | Adaptive AA (10 Assets) | +1.5% | +12.2% | +27.4% |
| Global Stock Market | Global Stock Market (60/40) | -0.6% | +11.6% | +22.9% |
| Multi-Asset Momentum | Multi-Asset Momentum Standard | -1.5% | +10.9% | +24.3% |
| 100% US Stock Market | 100% US Stock Market | -0.5% | +10.5% | +19.8% |
| Simple Path to Wealth | Simple Path (100% Stocks) | -0.5% | +10.5% | +19.8% |
Top 10 unlevered strategies in July 2026
The month's leaders, for the record. Read them next to the YTD and 1-year columns before reading too much into a single month.
| Strategy | Variant | Month | YTD | 1Y |
|---|---|---|---|---|
| EAA (Elastic Asset Allocation) | EAA Golden Offensive | +5.2% | +4.1% | +25.8% |
| Carlson's Defense First | Defense First Standard | +3.5% | +9.3% | +26.7% |
| Momentum-Correlation Triplet | Triplet Standard | +3.3% | +13.8% | +32.9% |
| 200-Day SMA Trend | VNQ 200-Day Trend | +2.6% | +5.1% | +3.0% |
| Diversified Dual Momentum | Diversified DM Standard | +2.6% | +9.3% | +21.4% |
| Mama Bear Portfolio | Mama Bear Standard | +2.6% | +19.2% | +33.0% |
| GTAA (Global Tactical Asset Allocation) | GTAA-5 Standard | +2.5% | +9.2% | +14.5% |
| Robust Asset Allocation | Robust AA Aggressive | +2.5% | +13.0% | +25.1% |
| Ivy Portfolio | Ivy Timing Standard | +2.1% | +10.0% | +15.7% |
| Composite Momentum | Composite Momentum Standard | +1.8% | +1.1% | +14.2% |
Leveraged corner
Leveraged variants, ranked separately because raw monthly moves at 2x or 3x are not comparable to the unlevered list. The 1-year column is where their real risk and reward shows up.
| Strategy | Variant | Month | YTD | 1Y |
|---|---|---|---|---|
| A-RVol Shifter | RVol Shifter 2-State | +11.0% | +11.7% | +2.8% |
| VIX Shield | VIX Shield Conservative | -0.2% | +2.0% | +13.0% |
| LETF Baseline: UPRO / ZROZ / GLD / KMLM | UPRO / ZROZ / GLD / KMLM + Catastrophe Brake | -1.1% | +8.9% | +26.1% |
| Vol-Target 2x QQQ | Vol-Target 2x QQQ Conservative | -2.4% | +5.9% | +16.4% |
| LETF Baseline: SSO / ZROZ / GLD | SSO / ZROZ / GLD + Catastrophe Brake | -2.5% | +4.7% | +20.8% |
Weakest 5 of the month
| Strategy | Variant | Month | YTD | 1Y |
|---|---|---|---|---|
| BAA (Bold Asset Allocation) | BAA-G4 (Aggressive) | -7.2% | +7.7% | +10.2% |
| VAA (Vigilant Asset Allocation) | VAA-G4 (T1/B1) | -7.1% | +3.5% | +17.3% |
| Risk Parity Momentum (Schwoerer) | RP+Momentum (QQQ/GLD/TLT) | -6.7% | -7.4% | +6.0% |
| 200-Day SMA Trend | QQQ 200-Day Trend | -6.6% | -2.9% | +5.8% |
| The 12% Solution (Carter) | The 12% Solution | -4.3% | +4.1% | +7.9% |
Methodology: strategy returns come from each strategy's published NAV series, the same out-of-sample track records shown on the leaderboard. Model portfolio returns use the same blended NAV shown on each portfolio's library page, measured through the last trading day of the month. One month is one data point; the strategy and portfolio pages show full multi-decade histories, drawdowns, and walk-forward results. This post is generated automatically from the database on the first of each month.
Educational information only, not investment advice. Past performance does not guarantee future results.