When someone asks me which strategy to look at first on BestFolio, my answer has been the same for a while: the Momentum-Correlation Triplet. It has the best combination of return, calm, and evidence in our catalog, and as of last week it comes in a levered version that makes it meaningfully juicier. This post is the full introduction it never properly got.
There's an odd fact hiding in yesterday's popularity study that makes this overdue. Only 5.0% of members who build their own portfolios hold the Triplet, while the most popular picks sit above 30%. Our own quiet flagship is one of the most overlooked strategies on the site.
What the Triplet actually does
Once a month it scores a 14-asset global universe on momentum over 3, 6, and 12 months and takes the 5 leaders. Then comes the step that gives it its name: from those 5, it keeps the 3 that moved least alike over the past 252 trading days. Momentum finds what's working; the correlation step makes sure the 3 winners don't all fail together. An absolute-momentum cash filter pulls the whole portfolio to safety when nothing is trending up. Equal weights, monthly rebalance, every rule public on the strategy page with free backtest data.
Why I call it the flagship
Across 38.8 years, from 1987-10-30 to 2026-08-31, the standard version compounds at 14.82% with a 1.23 Sharpe ratio. $10,000 becomes $2,140,888. The deepest drawdown in almost 4 decades is -17.66%, and its deflated Sharpe, the score that marks down results for how many strategies we tested to find them, is 0.99, scored against the 270 variants we have tested. The risk label on the card says moderate, and for once the label undersells it.
The defense record is my favorite part. 2008 and 2020 barely register on the equity curve, because the cash filter stepped aside both times. The worst stretch is actually a sideways grind from April 2015 to January 2016, when trends kept starting and failing. A strategy whose worst enemy is boredom rather than a crash is a strategy you can actually hold.
The new part: same strategy, 1.5x the exposure
Last week we shipped Triplet SmartLeverage 1.5x. It changes none of the decisions. Same monthly picks, same correlation step, same cash filter; it simply holds leveraged funds in place of regular ones where a liquid leveraged fund exists. Here's what that does over the same 38.8 years:
| Triplet Standard | Triplet SmartLeverage 1.5x | |
|---|---|---|
| CAGR | 14.82% | 18.77% |
| $10,000 becomes | $2,140,888 | $7,979,504 |
| Sharpe ratio | 1.23 | 1.10 |
| Max drawdown | -17.66% | -25.53% |
| Annualized volatility | 12.4% | 17.6% |
| Deflated Sharpe | 0.99 | 0.95 |
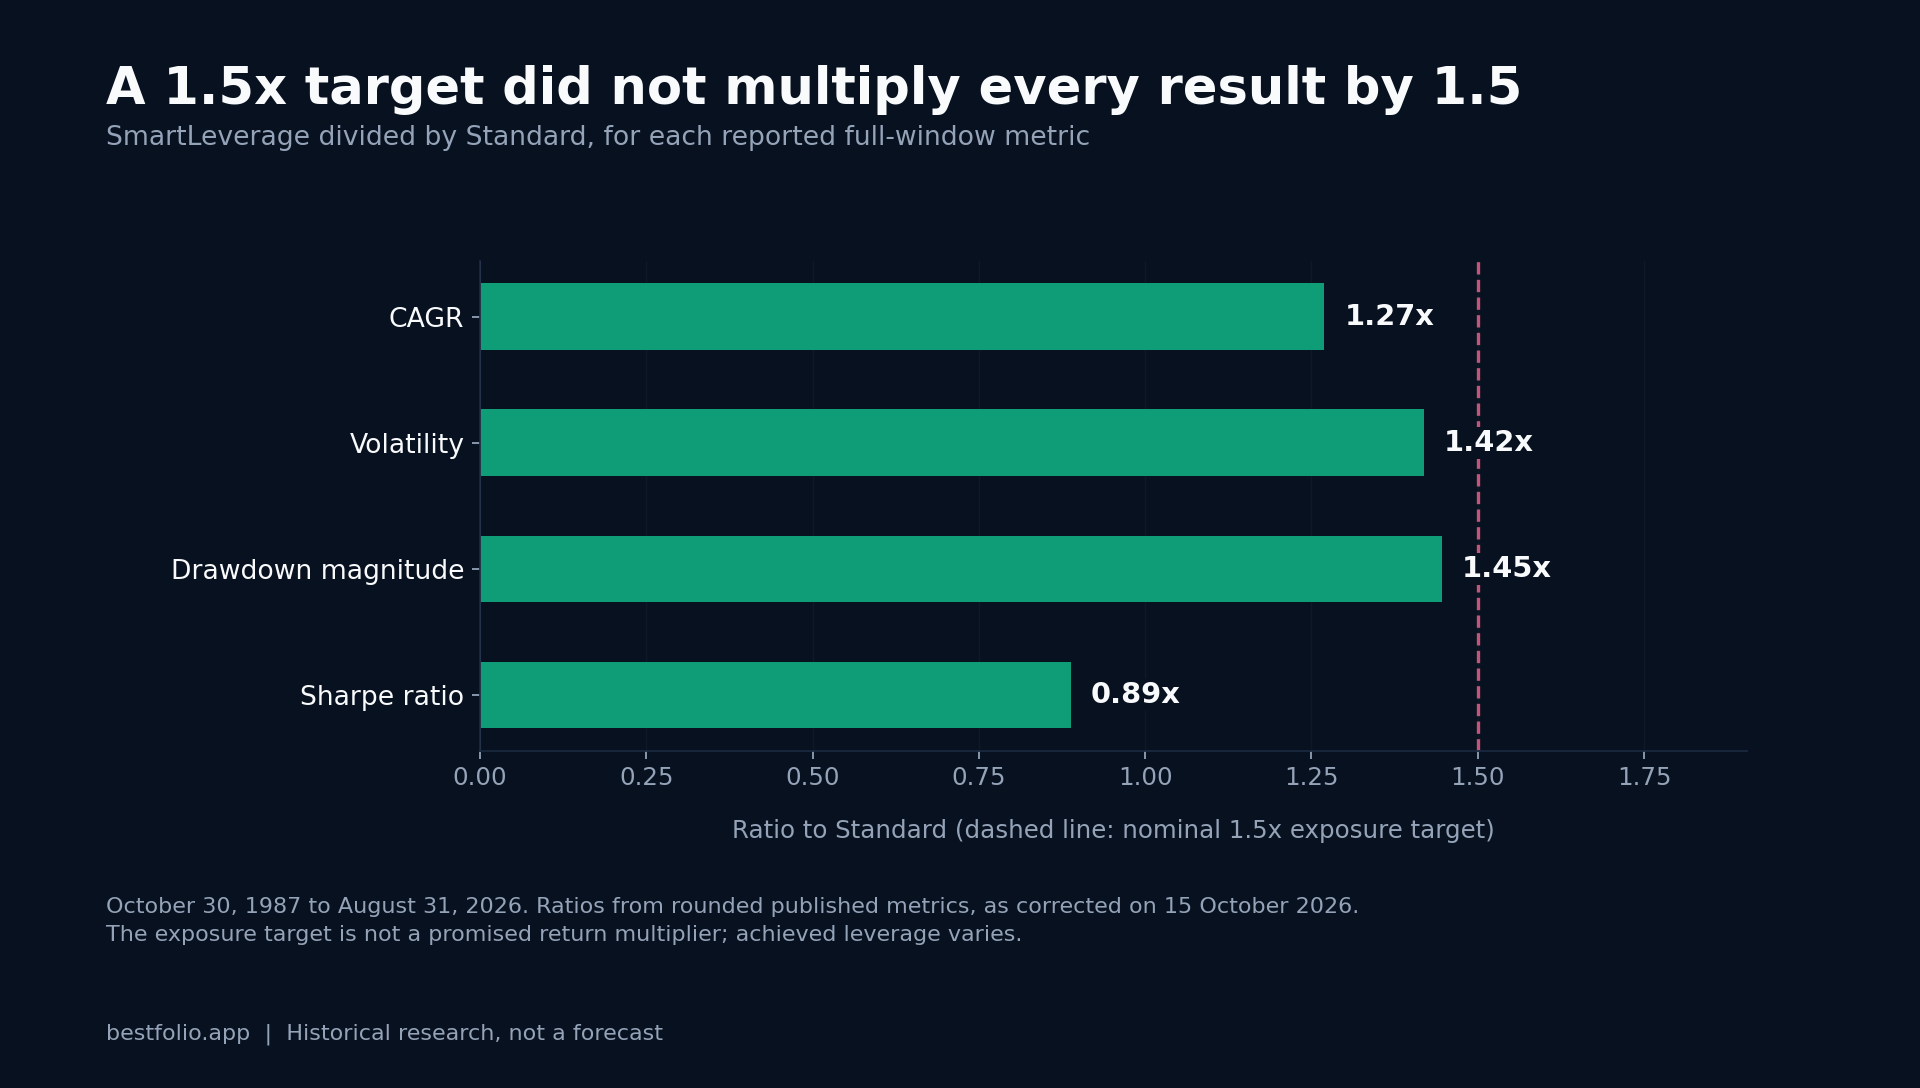
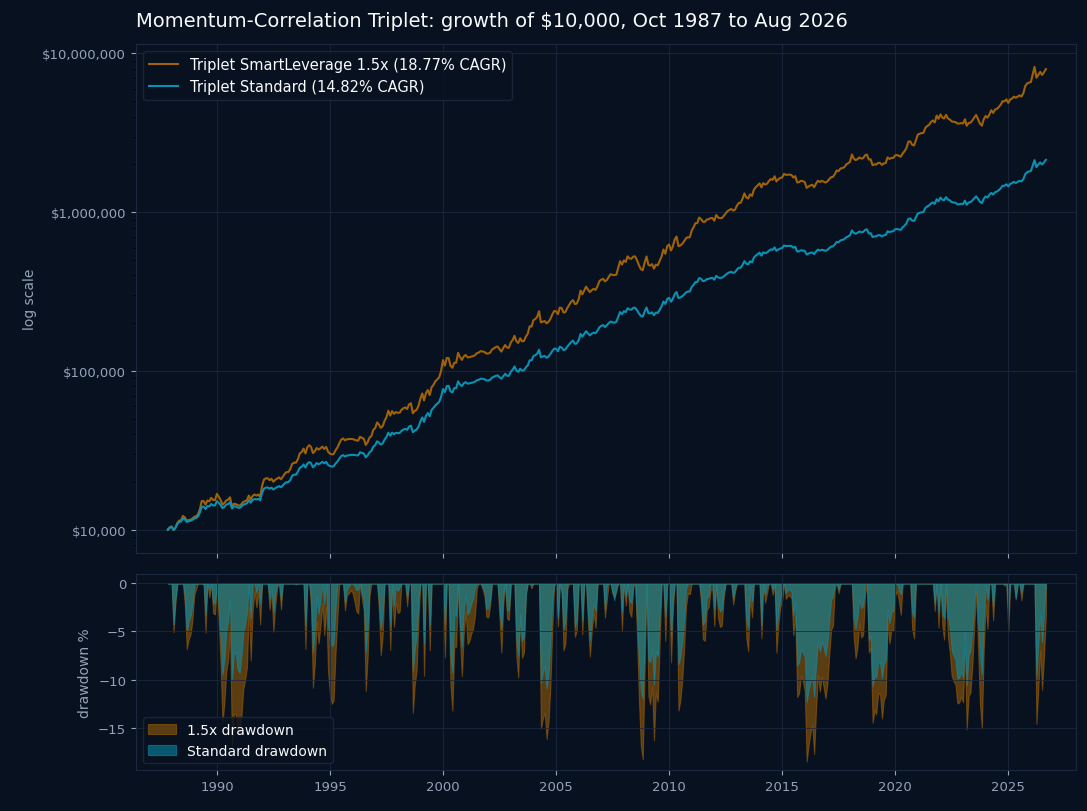
The 2nd row is the case in 1 line: 3.96 extra points of CAGR compound into 3.7x more ending money. The price is real but contained: the Sharpe eases from 1.23 to 1.10 and the worst drawdown deepens to -25.53%, still shallower than what buy-and-hold equity investors accepted in 2008 alone. The levered version keeps the thing that makes the Triplet special, because the defenses travel with the signals: it went to cash in the same months the standard version did.
One honesty note on the multiplier. Not every asset in the universe has a leveraged fund we trust: international sleeves, commodities, and TIPS run at 1x, so achieved leverage averages about 1.42x rather than the nominal 1.5x. We'd rather under-lever than route the strategy through funds that can disappear.
Why 1.5x and not more
Because we tested more, and more was worse. Greed had 3 chances in the internal bake-off:
| Idea | What it does | What the full window said |
|---|---|---|
| Straight 2x funds | Doubles the levered sleeves | Similar CAGR to 1.5x with more volatility and deeper drawdowns. Dominated. |
| Gold and managed-futures overlay | Stacks diversifiers on top | Strong after 2020. Over 38 years it adds only 0.6 points of CAGR (15.4% against 14.8%) for a lower Sharpe (1.16 against 1.23) and a deeper worst drawdown (-20.4% against -17.7%). 1.5x buys far more return for that kind of Sharpe cost. |
| Volatility targeting | Scales exposure to a 12% vol target | Hurt in every window. The Triplet already manages its vol by construction, and trailing-vol rules lever up right before regimes break. |
That last row also answers a question we get: running this on margin with your own vol rule is the systematic version of that idea, and it made everything worse. 1.5x through funds is where the extra return stops being paid for sensibly. Past that, you're buying volatility, not wealth.
The recent numbers, kept honest
The 1.5x version is up 22.23% this year and 44.61% over the trailing 12 months. Real numbers, live signals, and also the friendliest 12 months this strategy may ever show you. Judge it on the 38.8-year table above, not on the year we happened to ship it.
Both versions publish monthly signals on BestFolio, and the deflated Sharpe scores come from the same leaderboard, which scores each result against the 270 variants we have tested. Leverage comes from leveraged funds only, never margin. And if yesterday's post showed anything, it's that the gap between what scores well and what gets held is wide: this is me closing it for the 1 strategy I'd show you first.