A trend filter is the simplest defensive rule there is: hold the stock market while it's above its long-term average, sit in T-bills when it falls below. On r/LETFs it's the rule behind most leveraged setups, and the same argument comes back every few weeks. Should it be the 200-day average, the 10-month one, the 50/200 golden cross, 12-month momentum? Each version has its fans, and each fan has a backtest.
A BestFolio member asked me to settle it. In September I ran 15 filters on 49 years of S&P 500 data, and the slow ones came out statistically indistinguishable. The obvious follow-up was whether that answer depends on when you start the clock. So I ran it again, starting in every month since 1977, and ranked the filters in each window.
The winner kept changing, and a filter's rank in one decade told me very little about its rank in the next. What held up across start dates was how often you check the signal, not which formula you use.
What I tested
The 15 filters are the same set as the September study. The 200-day moving average read at each month-end, and the same 200-day average checked every day. The 10-month average. Absolute momentum over 12, 6, 3 and 1 months, each run twice (above zero, and above T-bills). Keller's 13612 score in its plain and weighted forms, plus the plain one against T-bills. And the 50/200-day golden cross, the usual "dual moving average" rule.
Each filter switches between SPY and T-bills. The signal is read on the close and traded at the next close, with BestFolio's 10 basis point cost per switch. SPY runs from August 1977 to 2 October 2026 on a daily total-return series. I added QQQ from 1986 as a second asset, because most leveraged-ETF gates watch the Nasdaq-100.
Then I cut the history into windows. Every 10-year stretch that starts at a month-end gives 468 of them for SPY and 358 for QQQ. I also ran 5, 15 and 20-year windows, and every start date through to today. In each window I ranked the 15 filters by Sharpe ratio (measured above T-bills, as the strategy pages do), by CAGR and by maximum drawdown.
Everything runs on BestFolio's backtest engine and price data, the same machinery behind the live strategy pages. When I ran it in early October, it reproduced all 430 monthly signals of the live 200-Day SMA Trend card. The figures below still differ from that card: the card starts in 1990 and fills at the signal's close, while this study starts in 1977 and trades at the next close.
The winner keeps changing
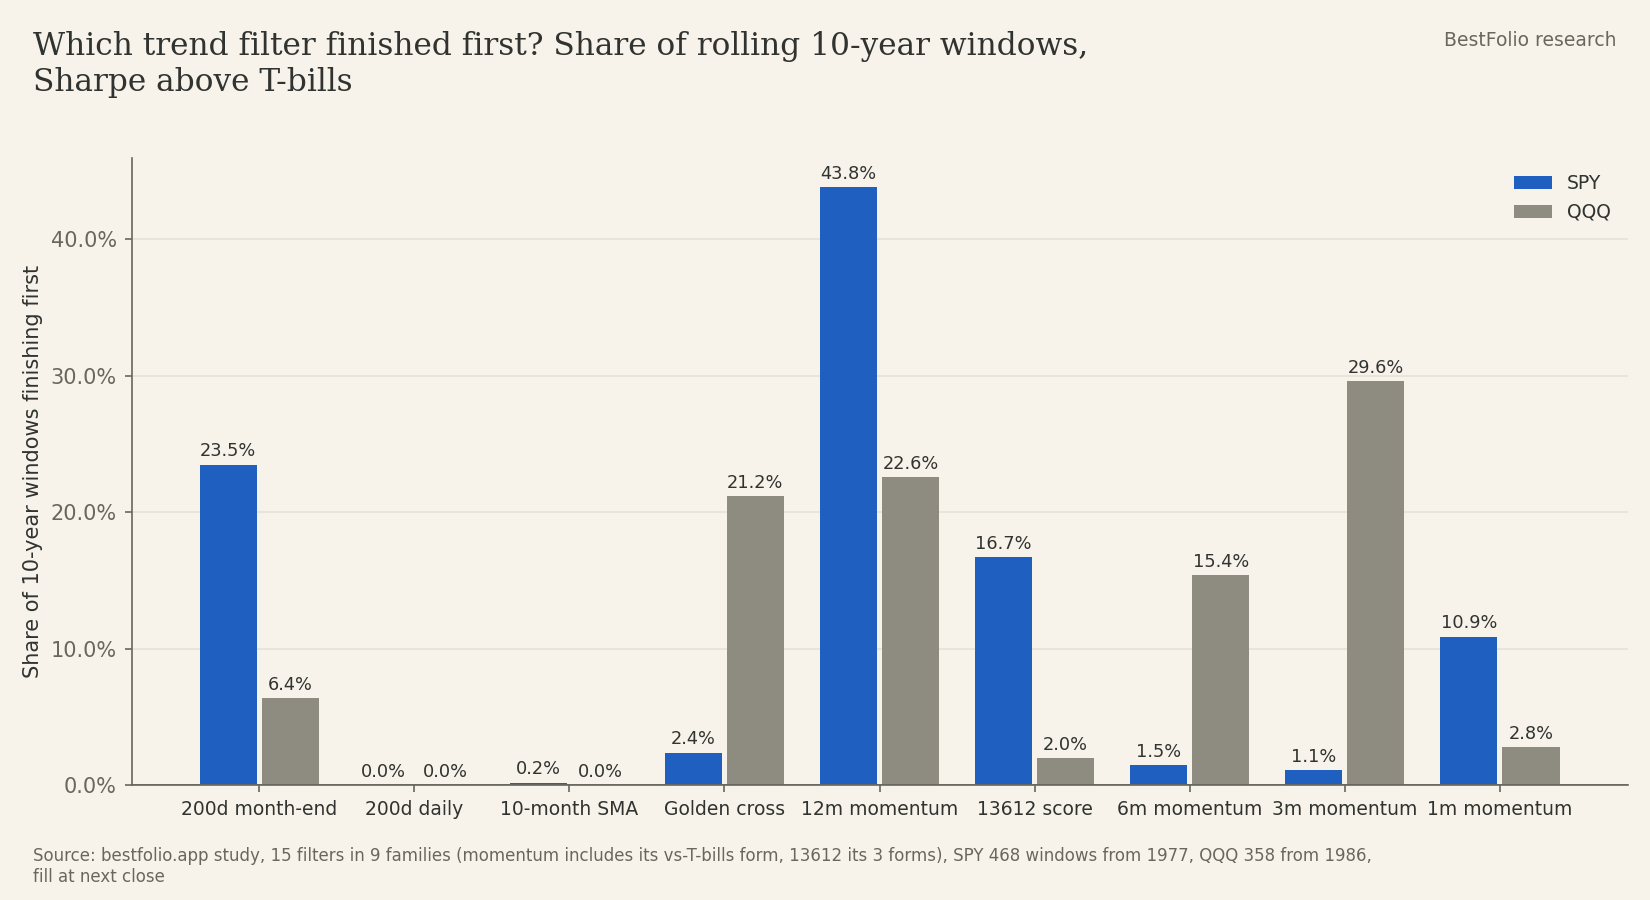
12 of the 15 filters finish first in at least one 10-year SPY window. The 2 one-month momentum filters, 2 of the 3 weakest over the full 49 years, finish first in 51 of the 468 windows between them (11%). 50 of those 51 windows contain October 1987. The 1-month filters were already out by then: they lost 7.7% in that crash while every slow filter rode the full 33% down.
The leaders also don't persist. I compared each window's ranking with the ranking over the next 10 years. The rank correlation averages +0.25 on SPY and -0.05 on QQQ. Knowing which filter led the last decade tells you very little about the next one.
Part of the reason is plain noise. Inside a typical 10-year window, the 7 slow filters are 0.23 apart on Sharpe, best to worst. The statistical uncertainty on a single 10-year Sharpe ratio is about 0.35. The gap between them is smaller than that in 99% of SPY windows.
Here is the full-period table next to how often each filter landed near the top or the bottom of a 10-year window.
| SPY, Oct 1977 to Oct 2026 (study) | CAGR (% a year) | Sharpe above T-bills | Max drawdown (%) | Switches a year | Top 3 of 15 in a 10-year window (% of windows) | Bottom 3 (% of windows) |
|---|---|---|---|---|---|---|
| Buy and hold | 12.2% | 0.57 | -55.2% | 0 | not ranked | not ranked |
| 200-day average, month-end | 11.0% | 0.60 | -33.1% | 1.3 | 45% | 0% |
| 12-month momentum vs T-bills | 11.3% | 0.61 | -33.7% | 0.8 | 51% | 1% |
| 13612 score (Keller) | 11.5% | 0.62 | -33.1% | 1.2 | 35% | 1% |
| 12-month momentum | 11.6% | 0.61 | -34.0% | 0.6 | 36% | 0% |
| 50/200 golden cross | 10.7% | 0.57 | -33.7% | 0.9 | 20% | 4% |
| 10-month average | 10.5% | 0.56 | -33.1% | 1.4 | 15% | 0% |
| 200-day average, daily | 9.6% | 0.47 | -33.3% | 6.0 | 5% | 27% |
| 1-month momentum | 8.1% | 0.41 | -31.6% | 5.5 | 12% | 52% |
The slow filters at the top of that table almost never finish in the bottom 3 of any decade. Beyond that, the order among them is a coin you flip by choosing a start date.
Same filter, different index
One more sign the rankings are mostly luck. Keller's 13612 score is the best SPY filter "from then to today" for 67% of possible start dates. On QQQ its median rank from the same kind of start is 11th of 15, and it never comes first. On QQQ the start-to-today leaders are 12-month momentum, the golden cross and 3-month momentum instead.
How often you look matters more than the formula
Turn the question around and ask which head-to-head results hold in most windows, and a clear pattern shows up. It comes down to the speed of the rule, and above all how often you read it.
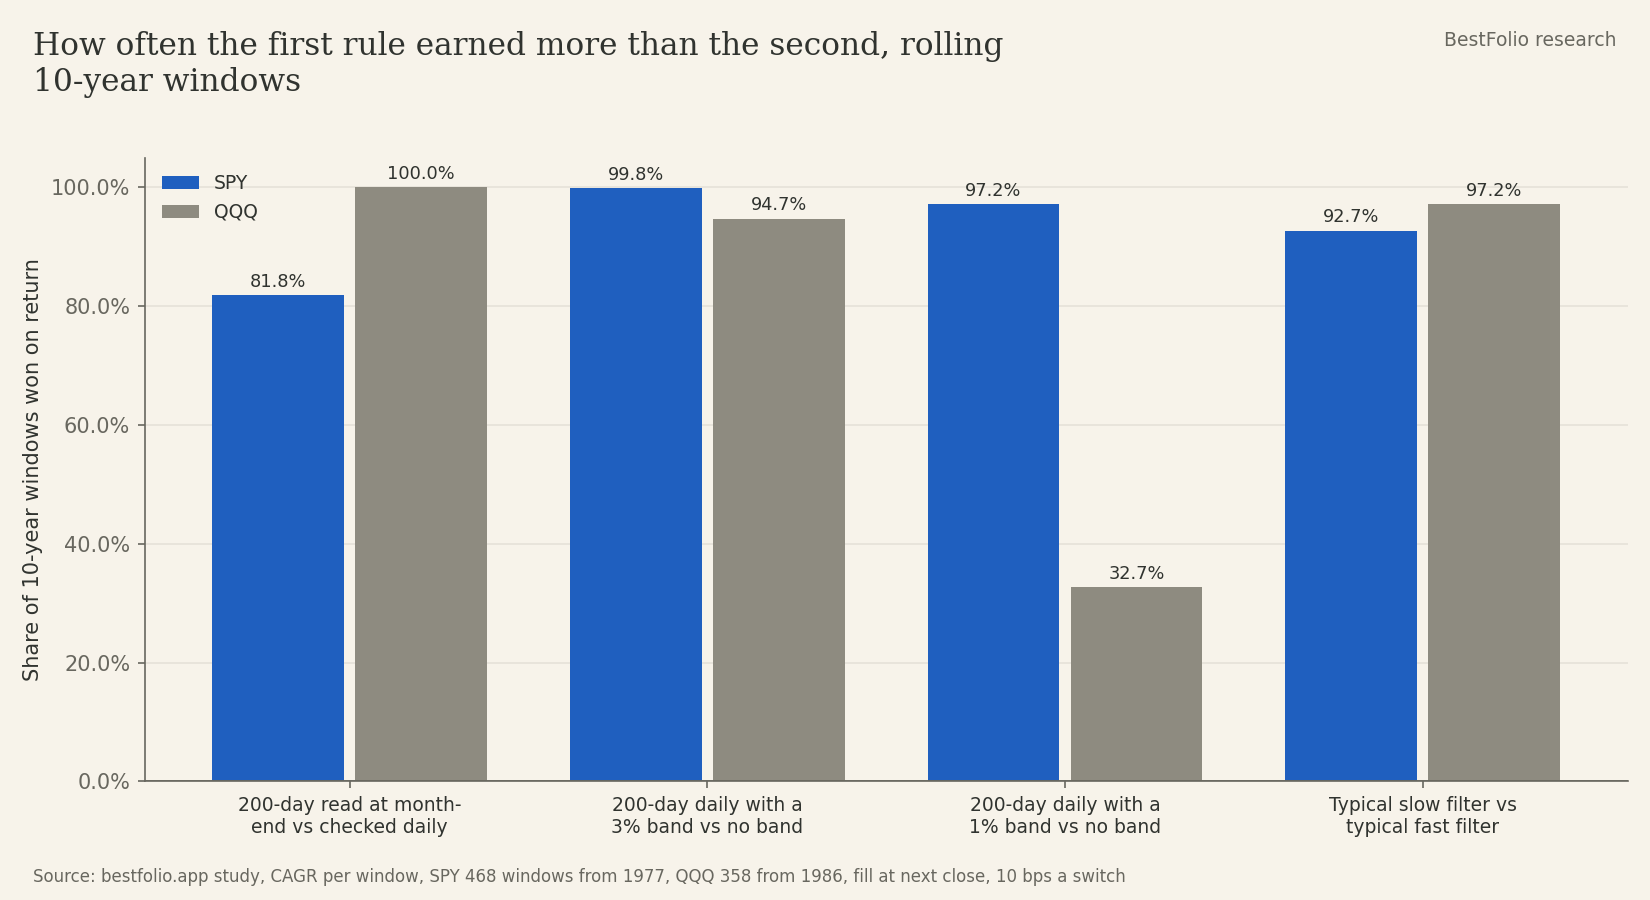
The 200-day average read once a month beats the very same average checked every day on Sharpe in 84% of 10-year SPY windows and in all 358 of the 10-year QQQ windows. Over 15 and 20 years the share is 96% to 100% on both. The daily version switches 6 times a year on SPY, and 78% of those switches reverse within a month. Those round trips cost 1.4 points of CAGR a year against reading the same average once a month.
Most r/LETFs gates run the daily check with a band around the average to stop exactly this. So I tested that too, outside the ranking.
| 200-day rule | SPY CAGR (% a year) | SPY switches a year | Reversed within a month (% of switches) | QQQ CAGR (% a year) | QQQ switches a year |
|---|---|---|---|---|---|
| Checked daily, no band | 9.60% | 6.0 | 78% | 12.15% | 7.0 |
| Checked daily, 1% band | 10.75% | 2.5 | 52% | 12.01% | 3.5 |
| Checked daily, 3% band | 11.39% | 0.9 | 7% | 13.20% | 1.7 |
| Read at month-end only | 10.96% | 1.3 | 28% | 13.62% | 1.5 |
A 3% band earned more than the bare daily check in 99.8% of 10-year SPY windows and 95% of QQQ ones. A 1% band helps on SPY. On QQQ, which swings more, it earned less than the bare daily check in most windows. If you watch the 200-day every day, give it room. Or just look at the end of the month.
None of them reliably beats buy and hold
This part gets lost in the filter arguments. Over any given 10 years, buy and hold beat all 15 filters on CAGR in 50% of SPY windows and 53% of QQQ ones. Start in March 2009 and hold SPY to today, and you earned 15.8% a year; the best filter from the same date earned 10.8%.
What the filters buy is a shallower worst case. The month-end 200-day cut a 10-year window's maximum drawdown by a median of 12.6 percentage points against holding SPY. Over 20-year windows it beat buy and hold on Sharpe 86% of the time on SPY and 93% on QQQ.
The live cards show the same trade on a shorter history. Since January 1990 the 200-Day SMA Trend card on SPY has returned 9.6% a year with a worst fall of -25.0%. SPY itself returned 10.8% a year on the same dates, with a worst fall of -55.3%. The 200-Day SMA Trend on QQQ returned 13.4% a year with a worst fall of -36.5%, against 14.6% and -83.0% for QQQ.
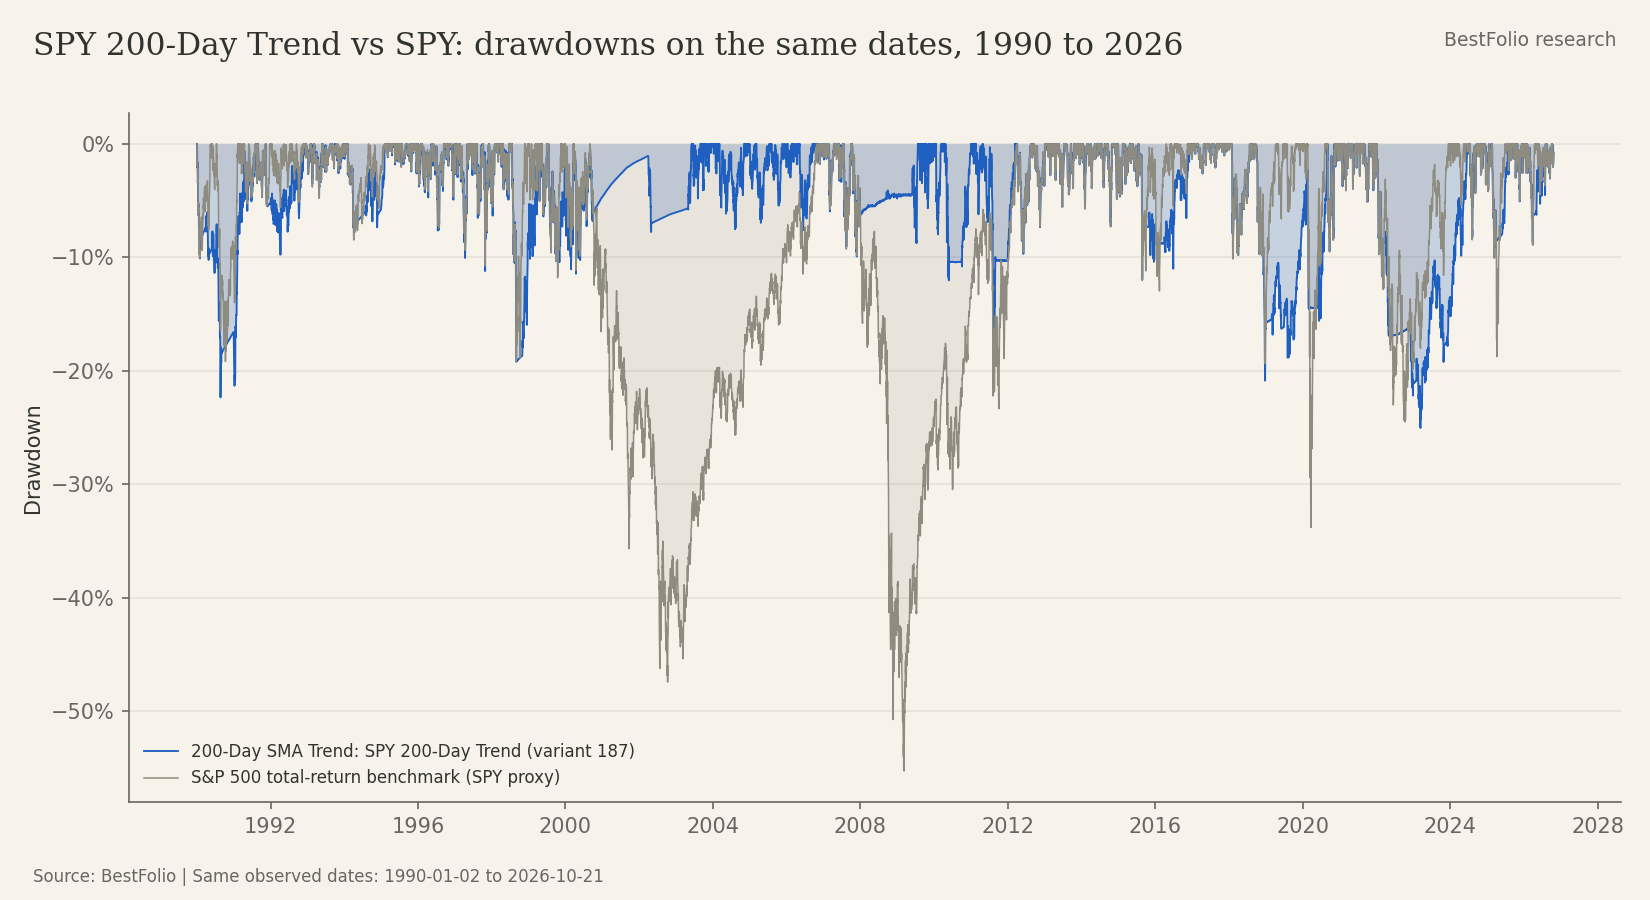
It isn't a free pass. The card's worst fall came in 2022, a slow grind where it lost slightly more than SPY. The protection shows up in the long bear markets, and you pay for it in return during the bull markets in between.
Where this breaks
The windows overlap. 10-year windows that start a month apart share 119 of their 120 months, so 468 SPY windows hold roughly 4 independent decades, and QQQ about 3. The shares above describe how sensitive the result is to the start date. They are not 468 separate experiments.
Everything in the study is unleveraged. A 3x fund turns each whipsaw into a bigger loss and adds volatility decay while you hold it. My guess is that the case for checking less often gets stronger with leverage, but I haven't measured that here. QQQ before March 1999 is the Nasdaq-100 price index with a dividend allowance, a stand-in for a fund that didn't exist yet. Costs are 10 basis points a switch and taxes are left out, which flatters the fast filters most.
The study first ranked on a Sharpe ratio with zero as the cash reference. Since 18 October the strategy pages measure Sharpe above T-bills, and so does this post. The switch moves no filter's median 10-year rank by more than 1 place.
What I take from it
Stop shopping for the best filter. Every slow one (the 200-day at month-end, the 10-month, 12-month momentum, 13612, the golden cross) has led some decade and trailed in another. The next decade won't care which one you picked. I'd pick a slow one, read it at month-end or give the daily check a real band, and make sure I can live with trailing the index for years at a time. That last part is where most people quit.
All figures are hypothetical backtests on BestFolio's engine with total-return prices, not live trading results. Past results don't predict future ones.