A backtest return without a history length is missing part of its denominator. BestFolio shows the tested years beside the performance metrics because 16.86% over 75.6 reconstructed years and 19.23% over 29.8 years do not carry the same historical evidence, even when both computations are internally consistent.
The years column is not a quality score. More years do not make a strategy good. Fewer years do not make it false. The column tells the reader which market environments could have influenced the result and which ones were absent.
Reconstructable history is not live-fund age
Inflation Compass uses modern sector funds and a modern breakeven series, yet its card reaches from February 1951 through September 2026. The early decades rely on point-in-time macro inputs and asset proxy chains. The 75.6-year figure describes the reconstructed rule history, not the age of the current ETFs.
TQQQ Quadrant Stack covers November 1996 through September 2026, or 29.8 years. The portfolio contains funds that launched later than 1996, so its earlier returns also depend on reconstructed underlying exposures. That history can test the rule through the dot-com decline, the financial crisis, and later markets. It cannot become a live track record by being precise.
| Backtest | History on the card | Years | CAGR |
|---|---|---|---|
| Inflation Compass | February 1951 to September 2026 | 75.6 | 16.86% |
| TQQQ Quadrant Stack | November 1996 to September 2026 | 29.8 | 19.23% |
The honest label is therefore backtest years. It is the period for which the complete strategy can be reconstructed under the published assumptions.
What a longer window can add
Additional history expands the set of possible failure regimes. A strategy beginning after 2003 cannot show how its rule behaved during the inflation and rate shocks of the 1970s and early 1980s. A strategy beginning in 1987 cannot show a retirement sequence beginning in 1929 or 1966.
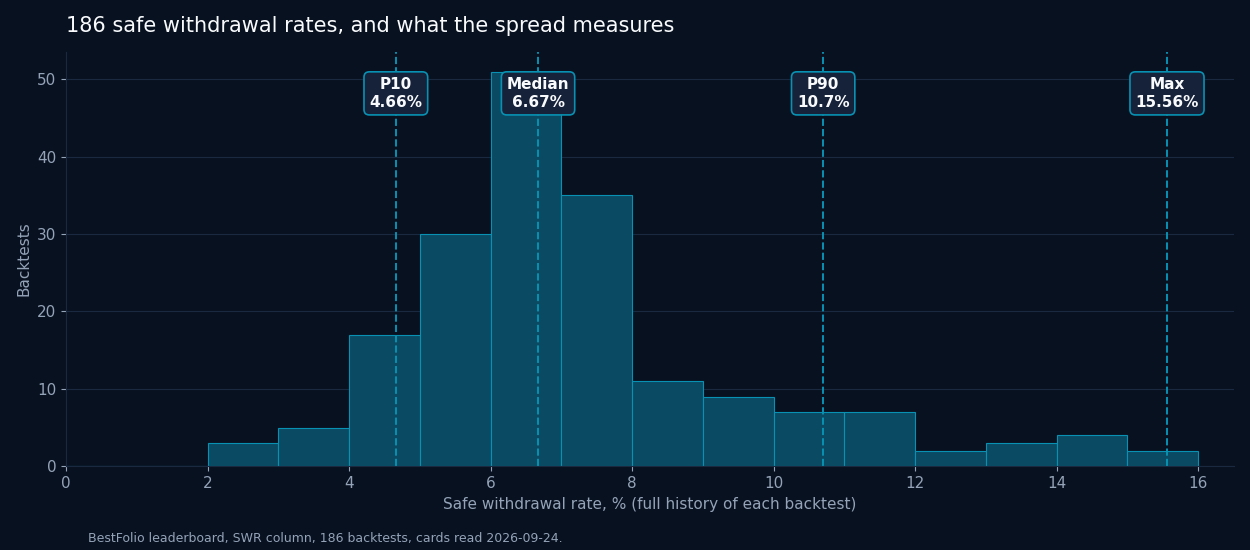
This matters for every metric, but it is especially visible in withdrawal research. The BestFolio engine gives a classic 60/40 portfolio beginning in 1922 a 3.31% safe withdrawal rate. A US stock backtest beginning in 1987 reports 7.07%. The later sample is not forced to survive either of the older portfolio's floor cohorts.
The difference does not tell us what the next retirement will look like. It tells us why the historical floors cannot be compared without the start dates.
What a longer window can distort
Deep history often increases the distance between the model and an investable portfolio. Modern ETFs may be replaced by indexes, mutual funds, academic factors, or synthetic return series. Fees, spreads, tax treatment, and asset availability can differ materially from today's implementation.
Older macro data can introduce another problem. A current series may include later revisions that were not known at the time. A defensible reconstruction uses point-in-time information where possible and states when it cannot.
Length therefore adds regime coverage while often adding proxy risk. The years column cannot resolve that tradeoff on its own. It tells the reader where to ask the next question.
3 labels belong together
A strategy card is easier to interpret when 3 facts are visible:
- Backtest period: the start and end dates for the complete reconstructed rule.
- History length: the years between those dates.
- Data construction: the live funds, indexes, proxy chains, and timing assumptions used across the period.
The 1st 2 are compact enough for a leaderboard. The data construction belongs in the methodology and strategy detail because it cannot be compressed into one number.
Use years as a filter, not a ranking
Sorting by history length can help find strategies that encountered more regimes. It should not award automatic credibility to the longest row. A simple flawed rule can be tested for a century. A well-specified newer strategy can have a shorter but cleaner investable history.
I use the column as a filter for claims. A double-digit withdrawal rate from a post-1990 sample needs a louder warning. A smooth inflation strategy tested only after 2003 has not met the regime it claims to solve. A leveraged portfolio reconstructed before its funds existed needs its proxy method beside the chart.
The years column does one job: it stops the return, drawdown, or withdrawal rate from floating free of the market history that produced it. That does not make the metric complete. It makes the missing questions visible.
Explore the BestFolio leaderboard and read the data methodology.
Past performance does not guarantee future results. Backtested results are hypothetical and do not represent actual trading.