The November batch is live, and it brings things the catalog didn't have: a hedge sleeve, a cycle model, a stacked trend rule. Some strategies are new to the site. Others are older ones, rebuilt to follow their authors' own rules. This post has 8 from the batch, plus 5 that went live in October without a word from us.
Of the 8, 5 are new to the site. One reads the business cycle from the bond market. One rotates through 10 funds on momentum and ships in both of its authors' versions. One, posted on r/LETFs in August, stacks stocks, gold and Treasuries when their trends are up. One spreads risk across groups of similar funds instead of single funds. And one is a hedge sleeve: it holds the 2 hedges, out of 6, that the current crisis is rewarding.
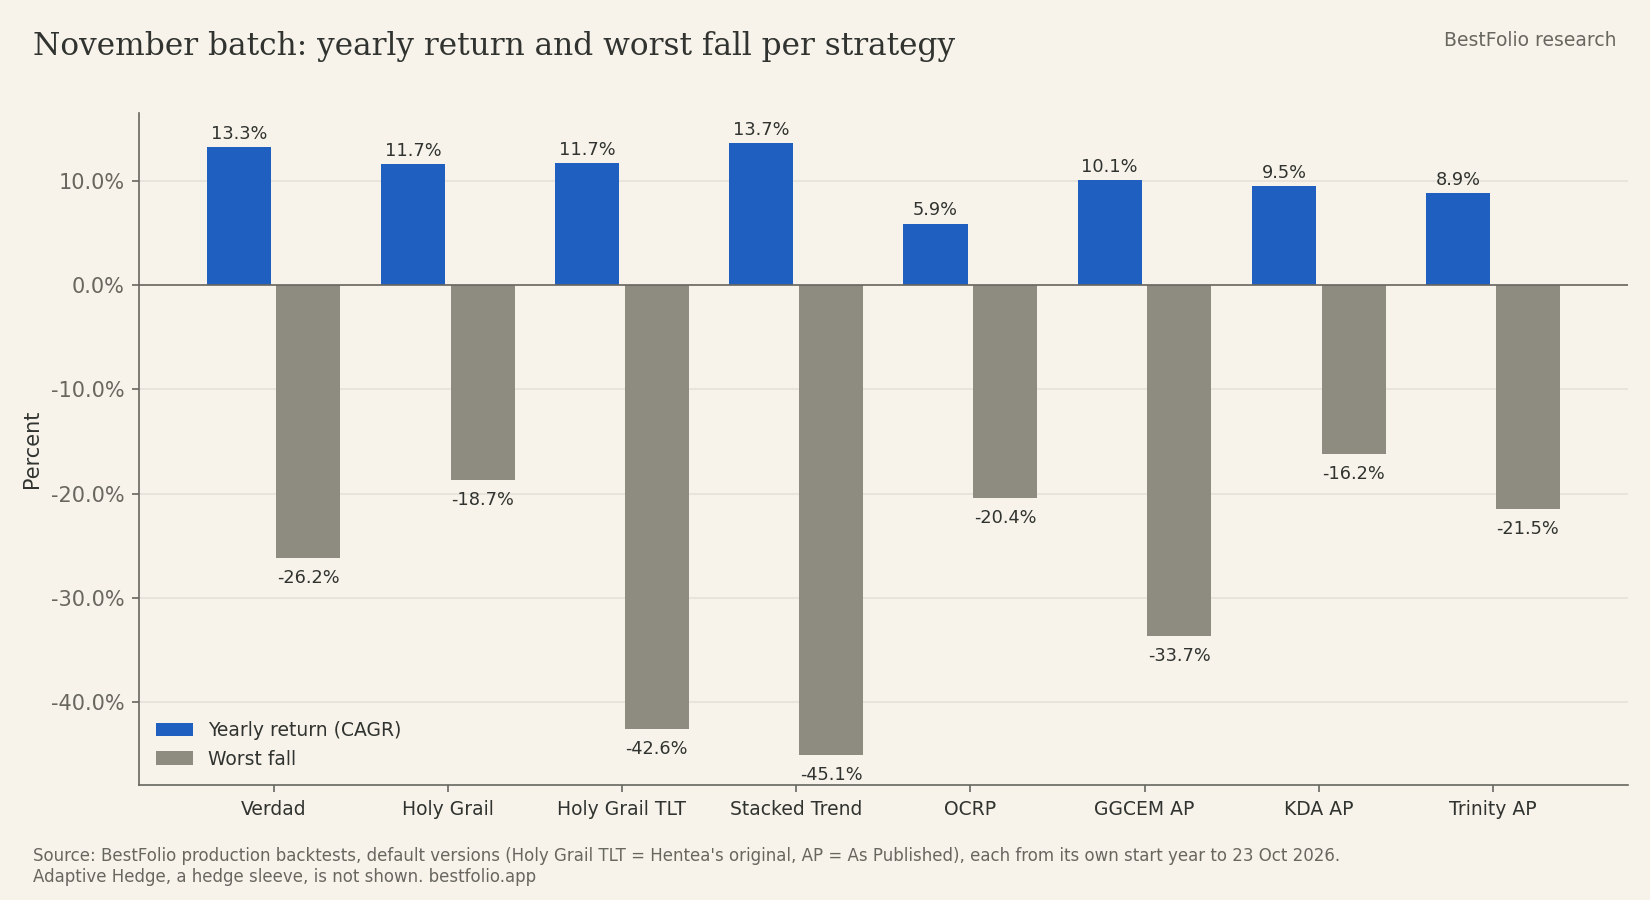
The numbers below come from our own production backtests, the same ones the strategy pages show, nothing adjusted. Sharpe is measured above cash (T-bills), as on every strategy page since 18 October.
| Strategy (variant) | CAGR (%) | Sharpe ratio | Worst drawdown (%) | Backtest start (year) |
|---|---|---|---|---|
| Verdad Countercyclical (Standard) | 13.3% | 0.83 | -26.2% | 1980 |
| Holy Grail Dual Momentum (Schwoerer's version, the default) | 11.7% | 1.00 | -18.7% | 2005 |
| Holy Grail Dual Momentum (Toma Hentea's Original) | 11.7% | 0.76 | -42.6% | 2005 |
| Stacked Trend Allocator (Established Funds, the default) | 13.7% | 0.63 | -45.1% | 1973 |
| Orthogonal Cluster Risk Parity (the default) | 5.9% | 0.51 | -20.4% | 1987 |
| GGCEM As Published (Link Original, the default) | 10.1% | 0.79 | -33.7% | 2006 |
| KDA As Published | 9.5% | 0.92 | -16.2% | 2000 |
| Trinity As Published (2016 white paper, the default) | 8.9% | 0.77 | -21.5% | 1987 |
| Defensive Rotation (IEF, TIPS or bills, the default), October | 7.4% | 0.50 | -12.1% | 1974 |
| Faber Tactical Yield, October | 7.1% | 0.48 | -17.1% | 1963 |
| Piard Annual Seasonality, October | 11.3% | 0.67 | -38.8% | 1995 |
| Weird Portfolio (6 funds, the default), October | 10.8% | 0.59 | -36.0% | 1973 |
| SPY Band Timer + Out-of-Market (Sadek), October | 11.6% | 0.66 | -37.7% | 1985 |
Adaptive Hedge is not in the table. It is a hedge to hold next to a stock portfolio, not a portfolio on its own, and its numbers are in its own section below. The start dates also differ by more than 40 years, so compare the rows with care. A backtest from 1973 has lived through the 1970s inflation and the 1987 crash. One from 2006 has not.
Verdad Countercyclical
Graham Infinger designed and tested this allocation in two Verdad research notes in April 2021. It leans against the credit cycle. Each month-end it compares the corporate credit spread and the slope of the yield curve with their own median over the last 10 years. Wide spreads, when investors are pricing in a recession, set the Growth state: mostly S&P 500 and small-cap value, plus 10% gold. Tight spreads with a flat curve set Inflation, with more gold. Tight spreads with a steep curve set Slowdown: corporate bonds and Treasuries. On top, a daily trend rule moves stocks or gold into 7-10 year Treasuries after 5 closes below their 200-day average.
The Standard variant, backtested from January 1980, shows 13.3% CAGR, a 0.83 Sharpe and a -26.2% worst drawdown. That fall came in early 1980, as gold dropped from its peak. From October 2007 to March 2009 it lost 23.6% while the S&P 500 lost 55.2%.
Its page is plain about the limits. Hybrid Asset Allocation, already in the catalog, did this job better: 16.1% a year from 1980, with a 1.10 Sharpe. The trend rule carries the edge more than the cycle switch does. It lags strong bull markets, including since Verdad published it: 9.4% a year from May 2021 against 13.2% for the S&P 500. And it runs on the Moody's Baa spread, because FRED now serves the high-yield spread Verdad describes only from September 2023. We built it because a member asked for it, and because it holds up differently from the momentum models that fill most of the catalog.
Holy Grail Dual Momentum
Toma Hentea published this rule on Seeking Alpha in January 2020, and Martin Schwoerer later nicknamed it the Holy Grail. It works on 10 funds: US large, tech and mid caps, international, emerging and Chinese stocks, real estate, gold, long Treasuries and corporate bonds. At each month-end it ranks them on their 3-month return and holds the best 4 at 25% each. One fund works as the risk switch: when the total US bond market trails T-bills over the same 3 months, the whole portfolio steps aside.
The 2 versions differ in where it steps aside to. Hentea's original moves into long Treasuries. Schwoerer's moves into cash, and his readers follow that one. In 2022 the switch kept turning risk-off just as bonds were falling. So the original held long Treasuries for most of the bond crash and fell about 43% from its December 2021 high. Schwoerer's version has a worst fall of about 19%, in 2008 and 2009, for about the same return.
So the default follows Schwoerer. Backtested from February 2005, it shows 11.7% CAGR, a 1.00 Sharpe and a -18.7% worst drawdown. The S&P 500 shows 11.0%, 0.67 and -55.2% over the same dates. Toma Hentea's Original sits beside it with the rules as first published: 11.7%, 0.76 and -42.6%.
Stacked Trend Allocator
Posted on r/LETFs in August 2026, this rule runs 3 separate 200-day trend gates: US stocks (SPY), gold (GLD) and intermediate Treasuries (IEF). Each has a 3% band, so it doesn't flip on noise. At each month-end it holds the sleeves whose trend is up, or T-bills when none is. When 2 or 3 trends are up it stacks them, through capital-efficient funds that hold more than 100% exposure.
The post names 2 funds under a year old. The default, Established Funds, uses funds with a record and real trading volume instead: SPY, GLD, IEF, GDE and NTSX. The posted version ships as the Standard variant. Backtested from January 1973, the default shows 13.7% CAGR, a 0.63 Sharpe and a -45.1% worst drawdown, against 11.0%, 0.48 and -55.2% for SPY. It gained 32.1% from March 2000 to December 2002 while SPY lost 33.0%, and 14.8% in 2008 while SPY lost 37.0%.
Two things to know. Gold does much of its work, and gold also made its worst fall, in early 1980. And it lags long bull markets: from 2010 to 2019 it returned 10.5% a year against 13.6% for SPY.
Orthogonal Cluster Risk Parity
David Varadi published this method on CSS Analytics on 4 October. It follows the Cluster Risk Parity he and Michael Kapler introduced in 2012. Plain risk parity gives every fund the same share of risk, so a menu with 5 stock funds and 1 bond fund ends up mostly in stocks. OCRP first drops funds that duplicate others. It then picks the few funds that explain most of how the whole menu moves. Every other fund joins the one it tracks most closely, and risk is balanced across those groups. It runs on the post's 12 asset classes, stays fully invested and holds about 62% bonds on average.
Backtested from December 1987, the default shows 5.9% CAGR, a 0.51 Sharpe and a -20.4% worst drawdown, in 2008. Small falls are its strength: in 2008 it lost 6.0%, against 18.9% for a 60/40 mix of US stocks and bonds and 37.0% for SPY. It trails that 60/40 on return, though, which made 9.2% a year over the same dates, with a 0.69 Sharpe and a -33.7% worst fall. Friday's write-up goes through where it falls short.
Adaptive Hedge
Stéphane Renevier built this hedge sleeve on a simple observation: no single hedge works in every crisis. Long Treasuries gained 34% in 2008 and lost 31% in 2022. So instead of owning every hedge all the time, it owns the 2 that the current regime is rewarding.
Each month it ranks 6 hedges: long Treasuries, commodities, gold, the US dollar, the Swiss franc and a short S&P 500 fund. The score is the average of their 1, 3, 6, 9 and 12-month returns. The top 2 get 50% each, but only while at least 3 of those 5 returns are positive, and a slot that fails sits in T-bills. A hedge it already holds keeps its place while it still ranks in the top 3, which roughly halves the trading.
It's built for long bear markets, and that's where it paid. In our backtest it gained 34% in the dot-com bust, 59% in the 2007-2009 bear market and 17% in 2022, when a stock portfolio needed help most. It was much less reliable in short, sharp selloffs. And it has long dry spells: it lost money from 2012 to 2019, and fell about 14% in 2023 while stocks rose. It's meant to sit next to a stock portfolio, not to replace one.
The backtest starts in 1973, when the Swiss franc began to float, and the 1970s flatter it. It made about 23% a year from 1973 to 1982, mostly from gold and commodities in the oil shocks. Since 1983 it returned about 6.4% a year, with a worst fall of about 32%. Judge it on those years, as its page says.
As Published: 3 strategies rebuilt to their authors' rules
When we add a strategy, we sometimes change it: a fund that trades more, a longer history, a simpler rule. That helps, but then our version is not quite what the author published. These 3 follow the original as closely as we can, and each sits next to our older version so you can compare the two.
KDA As Published follows the rules and code Ilya Kipnis published in January 2019. Each month it scores 10 funds on recent momentum, keeps the best 5 that are rising, and weights them so the mix swings as little as possible. Two "canary" funds, emerging market stocks and the bond market, decide how much goes into risk: all, half or none. Backtested from September 2000, it shows 9.5% CAGR, a 0.92 Sharpe and a -16.2% worst drawdown. The S&P 500 made 8.4% a year, with a -55.2% worst fall. From October 2007 to March 2009 it gained 18.9%. Our older KDA kept his name but not his rules, so it is now called KDA-Style Canary Momentum. Two things to know. Since Kipnis published it, from February 2019, it has made 5.1% a year, about the same as our older model. And it trades a lot: about 60% of the portfolio changes at a typical rebalance.
Trinity As Published follows Meb Faber's Trinity Portfolio, from his 2016 white paper. Half the money stays in a fixed mix of 10 asset classes: stocks, bonds, commodities, gold and real estate. The other half holds the 5 strongest of the same 10, each only while it is above its 10-month average, and T-bills otherwise. Backtested from October 1987, it shows 8.9% CAGR, a 0.77 Sharpe and a -21.5% worst drawdown. Faber reports 13.7% a year from 1973 to 2015 for his full version, which also tilts toward cheap and rising markets. Plain index funds can't copy those tilts, and he credits them with about 2 points a year, so ours comes in lower. Our older Trinity, all trend on 3 funds, is now called Three-Asset Trend.
GGCEM As Published is here as a warning. GGCEM, Grzegorz Link's growth-cycle model, picks stocks or bonds each month from the OECD's leading indicators for 17 countries. Our usual GGCEM backtest reads today's revised OECD numbers, which nobody could see at the time. This version reads them as the OECD first printed them, from April 2006: 10.1% CAGR, a 0.79 Sharpe and a -33.7% worst drawdown. On the same dates the backtest on revised data shows 13.5% a year, a 1.29 Sharpe and an 18.8% worst fall. The real-time version did step aside in 2008, gaining 16.1% from October 2007 to June 2009. In 2020 the numbers published at the time still said stocks, so a real follower rode the crash down. We don't recommend following GGCEM, and our real-time data check tells how a subscriber caught this.
Also new: 5 strategies from October
These 5 went live in October without an announcement. They belong in this post.
Defensive Rotation is a family of 7 ballast sleeves with no stocks in them, built to sit next to a portfolio at a fixed weight. The default holds intermediate Treasuries, TIPS or T-bills, whichever returned most over the last 12 months. Backtested from 1974, it shows 7.4% CAGR, a 0.50 Sharpe and a -12.1% worst drawdown. With no stocks at all, it will trail any equity strategy in a bull market.
Faber Tactical Yield is Meb Faber's rule for owning bonds only when they pay enough over cash. Each month-end it checks the term premium and the credit premium against their own history, and holds 7-10 year Treasuries, investment-grade corporates, both, or T-bills. It shows 7.1% CAGR, a 0.48 Sharpe and a -17.1% worst drawdown. In 2022 it lost 10.4%, against 16.5% for a fixed mix of the same 2 bond funds.
Piard Annual Seasonality is Fred Piard's seasonal calendar for country stock funds. It holds Singapore and Brazil from November to April, Germany from October to December and in March and April, and T-bills the rest of the time. Backtested from February 1995, it shows 11.3% CAGR, a 0.67 Sharpe and a -38.8% worst drawdown, in the 2020 crash. It held up in years the S&P 500 fell: +15% in 2001, +12% in 2002 and +9% in 2022. Most of its lead is old, though: since 2010 it returned 6.7% a year, against 14.2% for the S&P 500.
The Weird Portfolio is Value Stock Geek's lazy portfolio with no large-cap stocks. It holds equal parts US small-cap value, international small caps, real estate, long Treasuries and gold, rebalanced once a year. The default uses the author's own 6 funds, which split the real estate between US and international REITs. A member asked for the 5-fund version, with all the real estate in US REITs, so it sits beside it. The default shows 10.8% CAGR, a 0.59 Sharpe and a -36.0% worst drawdown, in March 2009. With 40% in small caps and 20% in REITs, it can fall hard when stocks and property fall together.
SPY Band Timer + Out-of-Market (Sadek) is Bill Sadek's own upgrade of his SPY 200-day band timer, which is also on BestFolio. The timer is unchanged. What changes is where the money waits while the timer is out of stocks. Instead of T-bills, it holds the best 3 of 8 funds that don't depend on US stocks, such as gold, Treasuries and European stocks. Backtested from October 1985, it shows 11.6% CAGR, a 0.66 Sharpe and a -37.7% worst drawdown. The S&P 500 made 11.8% a year over the same years with a -55.2% worst fall, so what it offers is the smaller fall.
Live today, with signals ready for the month-end rebalance
All 8 are live now, with full backtests and current signals. All 13 in this post are part of the Pro plan, and each page shows the full history, every variant and the current signal.
- Verdad Countercyclical: a business-cycle allocation read from credit spreads and the yield curve, with a trend rule on top
- Holy Grail Dual Momentum: a 10-fund momentum rotation, in Schwoerer's cash version and Hentea's original
- Stacked Trend Allocator: 3 trend gates on stocks, gold and Treasuries, stacked through capital-efficient funds
- Orthogonal Cluster Risk Parity: risk balanced across groups of similar funds, mostly in bonds
- Adaptive Hedge: the 2 of 6 hedges the current regime rewards, to hold next to a stock portfolio
- GGCEM, KDA and Trinity As Published: the authors' own rules, next to our older versions
Several of them get their own write-up over the coming weeks, starting with Orthogonal Cluster Risk Parity on Friday. See every strategy.
Backtests are hypothetical and include no taxes. Before an ETF existed, each backtest uses BestFolio's documented proxy chains, and drawdowns are daily worst drawdowns, as on each strategy page. Past returns do not predict future ones.