Which part of a portfolio keeps the drawdowns small? I found out the hard way, looking for a monthly-rebalanced portfolio with the highest withdrawal rate I could get while keeping the daily max drawdown under 10%.
The blend that came out on top was mostly tactical strategies. But the sleeve doing the heavy lifting was the dullest one in it: 30% in IEF, intermediate Treasuries, held at a fixed weight.
Take it out and the same blend draws down 14.4% instead of 9.0%.
That's a ballast. A fixed sleeve with no stocks in it, there to keep the portfolio upright when everything else stumbles. So I went looking for a better one.
250 candidates, judged 3 ways
Anything without equity qualified: Treasuries, TIPS, T-bills, gold, managed futures, commodities, the dollar, corporate bonds. I built 250 candidates out of them: single assets, fixed mixes, momentum rotations, trend-filtered baskets, inverse-volatility mixes, the risk-off legs of our best strategies, and 80 walk-forward portfolios (the kind where BestFolio re-weights the holdings every month from their recent record) run on the ballast assets alone. All of it on the same price history BestFolio backtests use, proxies and reconstructed history included.
Then I judged each one 3 ways:
- On its own. Drawdown and excess Sharpe over T-bills, in 1988 to 2004 and again in 2004 to 2026. A ballast should be able to stand on its own.
- Next to tactical strategies. I rebuilt 3 tactical blends around it at fixed drawdown limits and compared the withdrawal rate with IEF in the same seat.
- Next to plain US stocks. The best withdrawal rate it allows at a 20% drawdown limit.
The 3 lenses don't agree. That's the most useful thing I found.
| Ballast | On its own, 2004+: CAGR / max DD / excess Sharpe | Next to tactical, vs IEF | Next to stocks, 1988+ / 2004+ |
|---|---|---|---|
| IEF, TIPS or bills, 12-month momentum | 3.3% / -10.4% / 0.34 | -0.03 | 2.03% / 2.93% |
| IEF or bills, 12-month momentum | 3.4% / -10.4% / 0.35 | +0.07 | 1.66% / 3.02% |
| IEF or bills 70%, gold 15%, managed futures 15% | 4.4% / -10.0% / 0.53 | -0.52 | 2.25% / 3.26% |
| 7-asset trend basket | 3.2% / -6.1% / 0.40 | -0.99 | 1.65% / 2.41% |
| Defense First risk-off leg | 6.5% / -15.0% / 0.61 | fails | not tested |
| IEF | 3.0% / -23.9% / 0.23 | 0.00 | 1.27% / fails |
"Next to tactical" is the average change in worst-case withdrawal rate across the 3 blends, in percentage points. "Fails" means it couldn't keep a blend under its drawdown limit at any weight.
Next to tactical strategies, only Treasuries work
Every gold, managed-futures, commodity, trend-basket or walk-forward ballast cost 0.2 to 1.5 points of withdrawal rate next to tactical strategies, and most of them couldn't hold the drawdown limit at all. The only ones that kept up with IEF were rotations between Treasuries (sometimes TIPS) and T-bills.
My read: tactical strategies already own gold, commodities and bonds when those trend. A trend-following ballast adds the same bet a second time. And when stocks crack, a monthly trend rule is a month late, while Treasuries tend to rally the same day. Over the test, IEF's correlation with the tactical blend was -0.03 and it gained 0.91% on average in the blend's 12 worst months. Managed futures lost 1.07% in those same months, gold 1.38%.
On their own and next to stocks, gold and managed futures shine
Flip the lens and the order flips. The diversified baskets hold up best on their own. Take the 7-asset trend basket: IEF, TLT, TIPS, gold, managed futures, commodities and the dollar, each held while it's above its 10-month average. Since 2004 it never fell more than 6.1%, and its excess Sharpe was 0.40 or better in both halves of the test.
Next to plain stocks, the best ballast was the Treasury-or-bills rotation with 15% gold and 15% managed futures on the side. Against an index fund, those assets are real diversifiers.
One all-rounder
One candidate did well on all 3 lenses: each month, hold IEF, TIP or BIL, whichever returned most over the last 12 months. Steady on its own, level with IEF next to tactical strategies, second best next to stocks since 1988.
It isn't perfect. In 2022 it lost 4.9%, because TIPS fell too. The plain IEF-or-bills version made 1.4% that year, while IEF itself lost 15.2%.
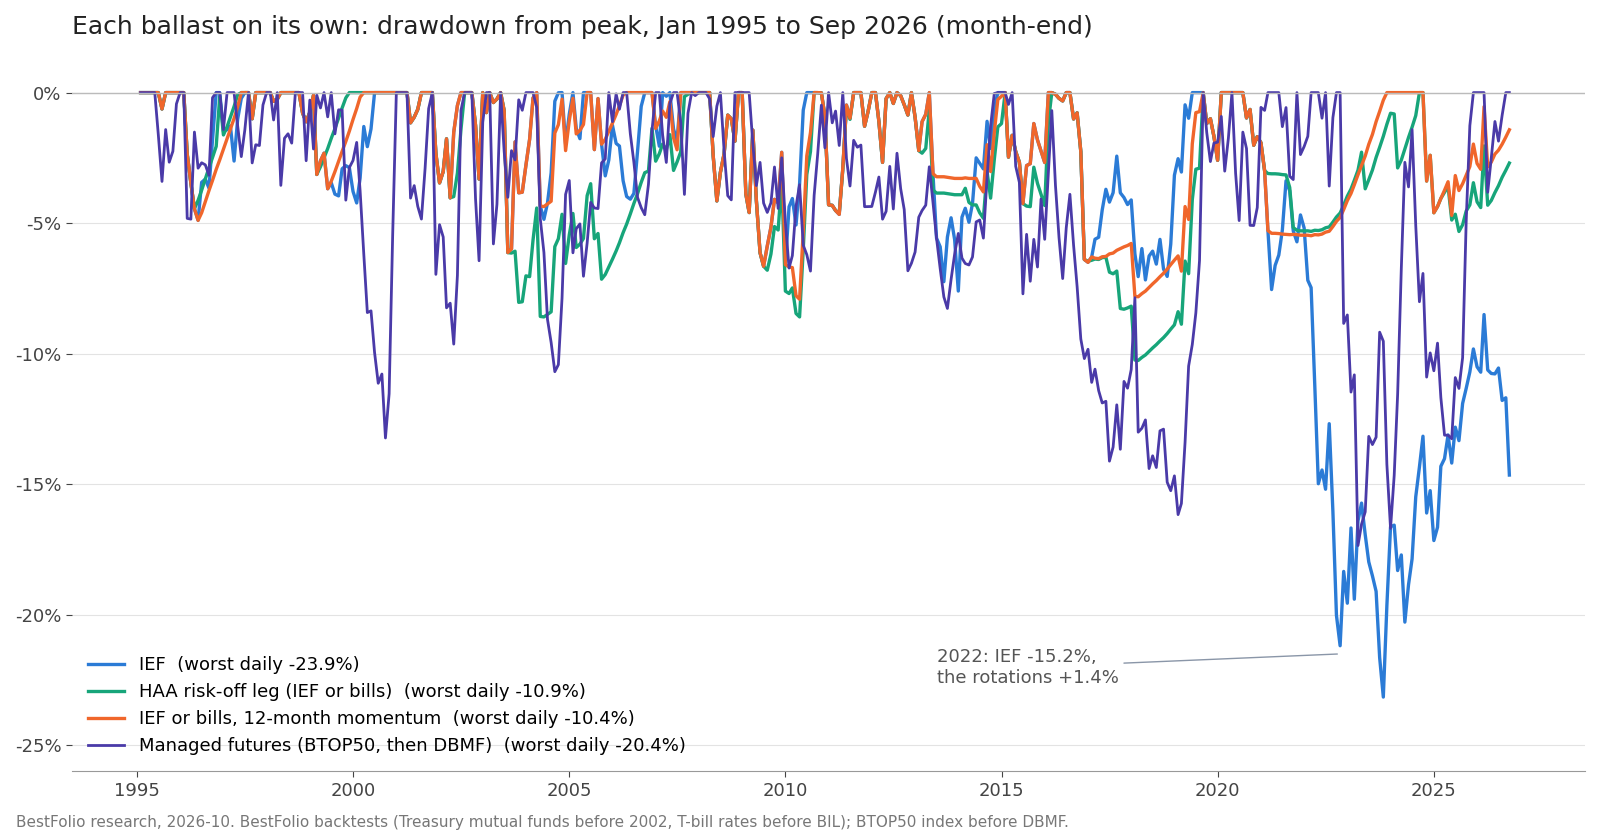
And walk-forward on the ballast side? The best one, a max-CAGR optimizer on IEF, TIPS and bills, turned out to pick exactly the same thing every month as a plain rule: the 2 best by 12-month return, 60% and 40%. Same returns, month for month. No need for the optimizer.
What's new on BestFolio
Defensive Rotation is published as a family of 7 ballast variants:
- IEF, TIPS or bills, 12-month momentum (the default).
- IEF, TIPS or bills, top two 60/40 (what walk-forward picks).
- IEF or bills, 12-month momentum.
- HAA's own risk-off leg (IEF or bills on the 13612 score).
- IEF or bills 70%, gold 15%, managed futures 15%.
- Defense First's risk-off leg.
- The 7-asset trend basket.
A walk-forward portfolio can now pin 1 ballast at a fixed weight: any of these, or a single ETF. It's rebalanced monthly and never levered.
Which one to pick
- Next to tactical strategies: IEF or bills, 12-month momentum.
- Next to a stock index: the version with gold and managed futures.
- On its own, with the lowest drawdown: the trend basket.
- Not sure: the default, IEF, TIPS or bills.
In my tests the ballast that worked sat between 20% and 35% of the portfolio.
One warning. A blend fitted to a 9% drawdown on one half of history drew down 10.8% to 13.9% on the other half, in all 4 splits I ran. Treat a backtested drawdown as the best case. And 250 candidates is a lot of tries: small gaps between the leaders are noise.
Backtests here use historical prices with stand-ins before some funds existed: Treasury mutual funds and yield-based series before the ETFs, reconstructed TIPS before 1997, monthly gold and commodity indexes in the early years, and the BTOP50 index plus a Rydex fund before KMLM. Past results describe the past; they don't promise the future, and none of this is personal investment advice.