In September I measured how steady the Sharpe ratio of 173 backtests was over time. The idea is to compute the Sharpe ratio over every rolling 36-month window, the rolling Sharpe, and score how consistently it stayed positive: that score is the Sharpe Stability Ratio. Readers picked up on 2 numbers from that post. Leveraged variants scored a bit lower than unleveraged ones, 0.41 against 0.45. And the ranking flipped between decades: the rank correlation between the 2000s and the 2010s was -0.43.
When I asked on r/BestFolio what to test next, u/confettofetti and u/paragon_22 picked the obvious follow-up. Is that leverage? Does levering a strategy make its rolling Sharpe less steady, and does it change who ranks where from one decade to the next?
My short answer is no to both. Leverage lowers the Stability score by a few hundredths, almost every time, because the rolling Sharpe sits a little lower, by about what leverage costs. It doesn't swing any more than before. And inside each decade the levered versions rank almost exactly like the plain ones.
How I tested it
The Stability score is the average of those rolling Sharpes divided by how much they swing (a Newey-West standard deviation, since overlapping windows aren't independent). Since 18 October the leaderboard computes it on returns above cash, so 0 means earning no more than T-bills. I used exactly that code, the one behind the Stability column, on that basis.
I built 2 sets of pairs, each levered version against its own plain version, on the months both share, through September 2026:
- 55 strategies at 3 leverage settings. The strategies the SmartLeverage engine can actually lever, one main variant each, at the 1.5x, 2x and 3x settings. SmartLeverage keeps the strategy's mix and swaps part of each holding for a 2x or 3x fund where one exists, with the freed cash in T-bills. Not every holding has one, so the 2x and 3x settings reach a median 1.64x and 1.72x.
- 23 levered variants we list, against the 14 plain versions they come from: SmartLeverage 1.5x, fixed 2x and 3x, and SmartStack.
A small drop, nearly every time
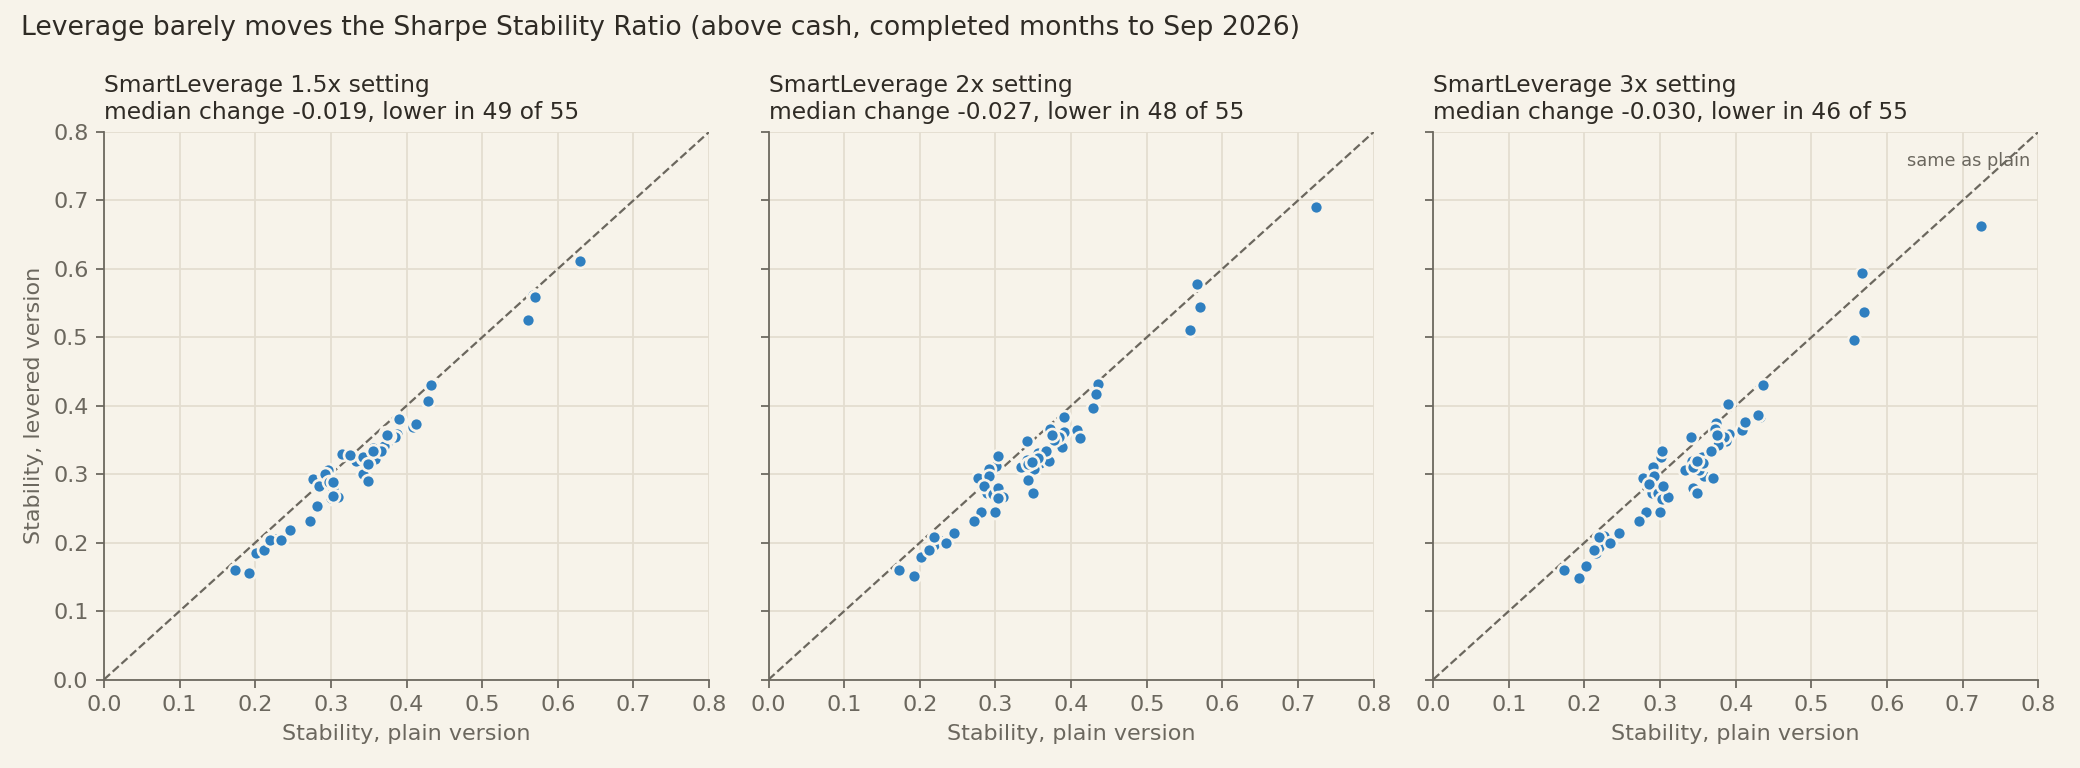
The plain versions have a median Stability of 0.34. At the 1.5x setting the levered versions score lower in 49 of the 55 strategies, by a median of 0.019. At 2x it's 48 of 55 and 0.027. At 3x, 46 of 55 and 0.030.
| SmartLeverage setting | Leverage reached | Plain Stability ratio | Levered Stability ratio | Median change in the ratio | Number of strategies levered lower | Average rolling Sharpe | Swing of the rolling Sharpe |
|---|---|---|---|---|---|---|---|
| 1.5x | 1.46x | 0.34 | 0.32 | -0.019 | 49 of 55 | -7.3% | -1.3% |
| 2x | 1.64x | 0.34 | 0.31 | -0.027 | 48 of 55 | -9.2% | -1.4% |
| 3x | 1.72x | 0.34 | 0.31 | -0.030 | 46 of 55 | -9.9% | -1.3% |
Medians over the 55 strategies. Leverage reached is the beta of the levered monthly returns above cash on the plain ones. The last 2 columns are the median change against the plain version.
So the direction is consistent, but the size is small. 0.02 to 0.03 is about 6% to 9% of the plain value, while the plain scores themselves spread from 0.29 to 0.38 between the first and third quartile.
It's the level that drops, not the steadiness
The score is a ratio, so it can fall for 2 reasons: the rolling Sharpe gets lower, or it swings more. Here it's almost entirely the first one.
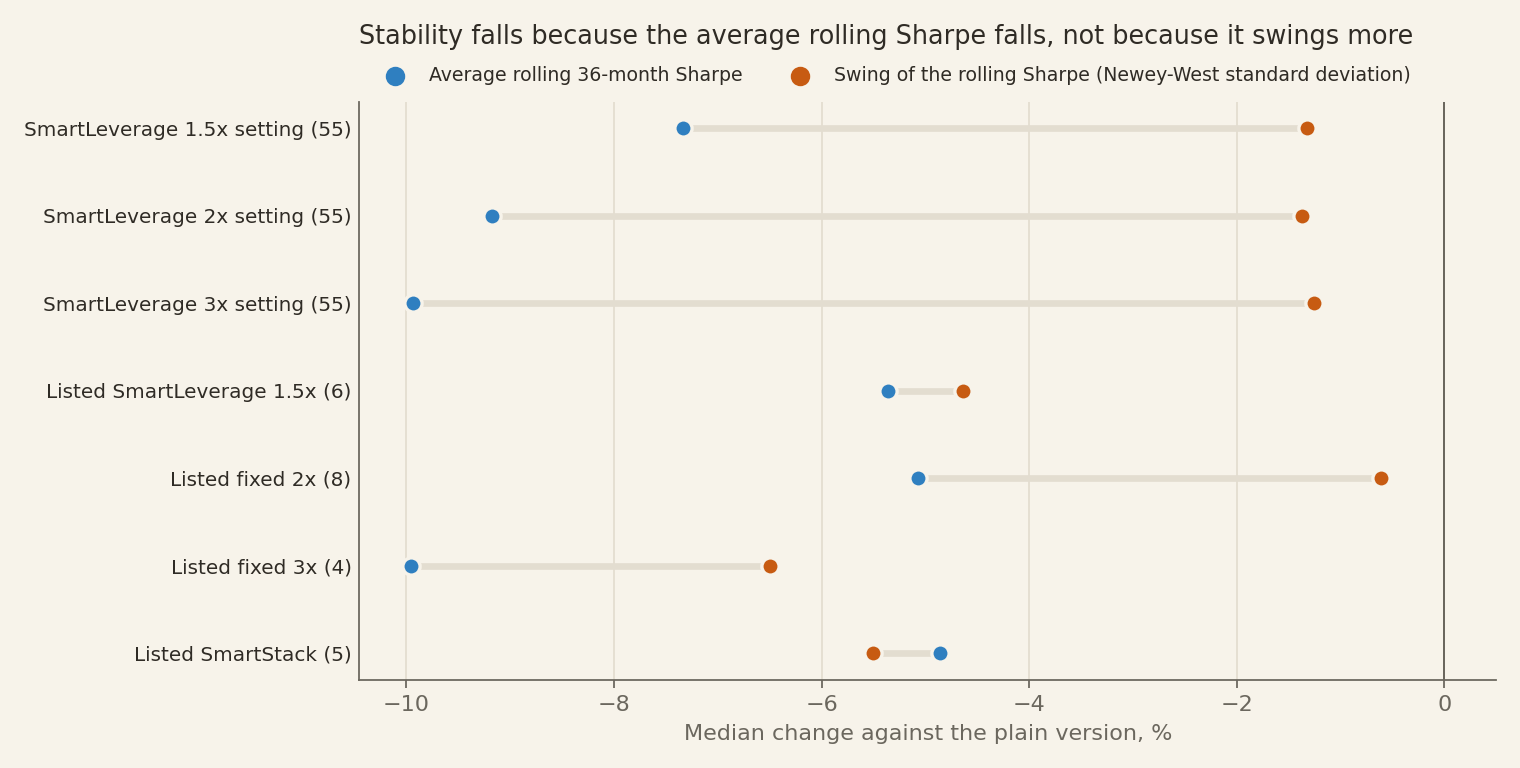
For the median strategy, the average rolling Sharpe falls 7.3% at 1.5x, 9.2% at 2x and 9.9% at 3x. That's about the cost of leverage I expected: the full-period Sharpe above cash keeps 93.0%, 91.1% and 89.6%. The swing moves by about 1.3%, and the rolling Sharpe of the levered version follows the plain one almost step for step (correlation 0.98 to 0.995).
That's what the arithmetic says should happen. If you could borrow at the cash rate for free, twice the return above cash would come with twice the volatility, and every rolling Sharpe above cash would stay exactly where it was. What's left is the cost (fund fees, financing above the cash rate, daily resets) and the parts of the book that can't be levered. Both lower the level a little, all the time. Neither makes the path bumpier.
The decade ranking doesn't move
This was u/paragon_22's part of the question. Inside each decade I ranked the 55 strategies by Stability, plain and levered. The 2 rankings are nearly identical: rank correlations of 0.99 in the 2000s and 0.97 in the 2010s at 1.5x, 0.97 and 0.95 at 2x, 0.95 and 0.91 at 3x.
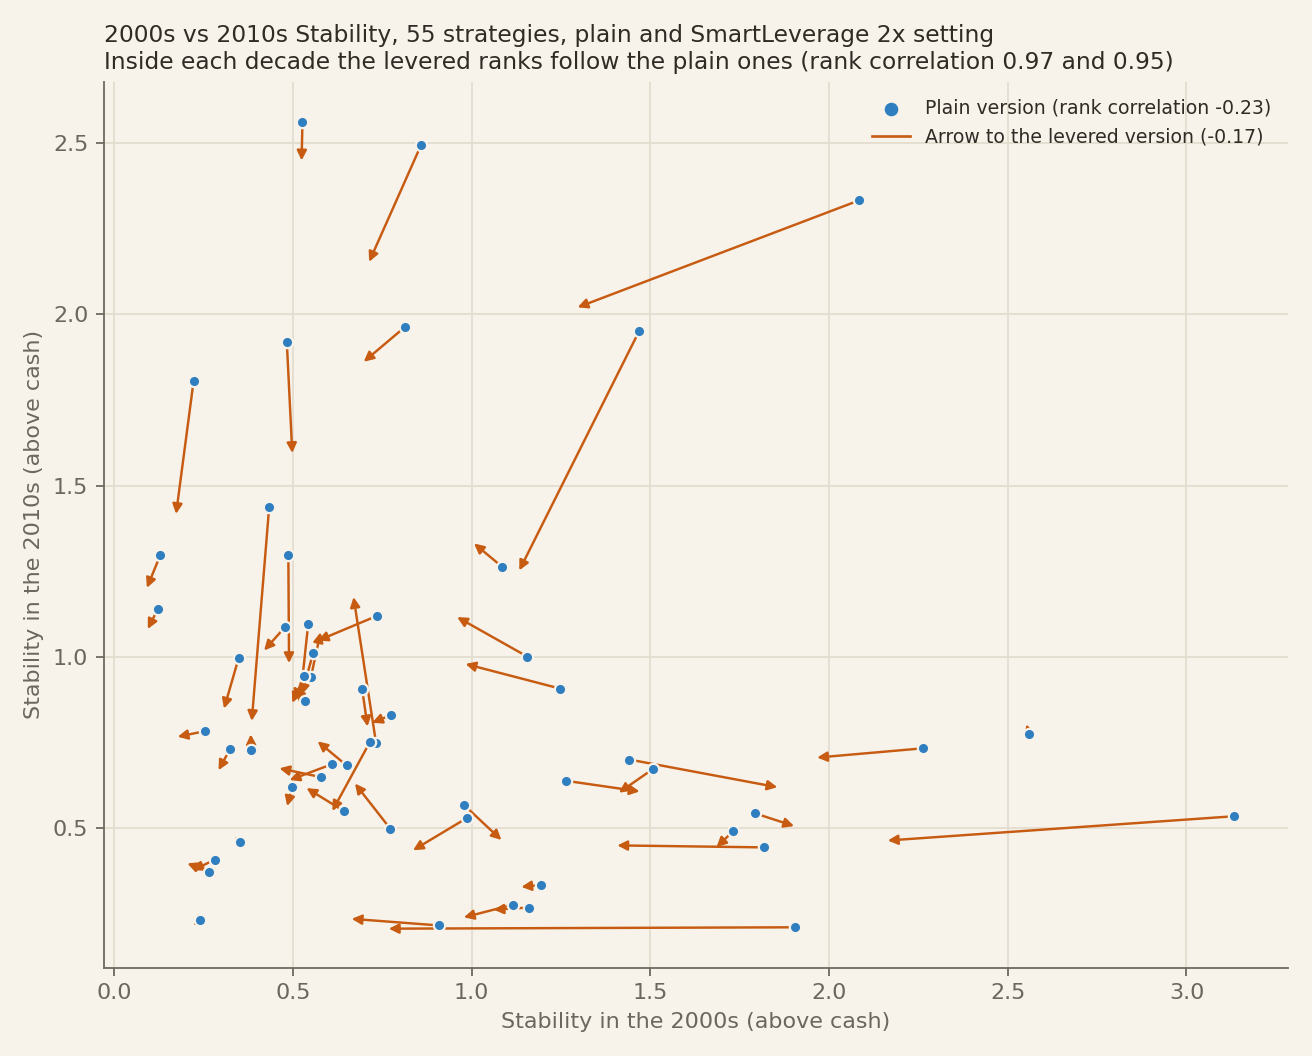
The flip between decades is there with or without leverage. Across these 55 strategies the 2000s vs 2010s rank correlation is -0.23 for the plain versions and -0.17 for the levered ones at 1.5x and 2x. At 3x it's -0.08, the only difference that clears the noise even barely, and I ran 6 of these comparisons, so one borderline result is what chance gives. The strategies that were steady through the dot-com bust and 2008 still weren't the steady ones in the 2010s, levered or not. That belongs to the signals, not to the leverage.
One thing I did see change by decade: leverage costs more Stability inside the 2000s (a median 0.050 at 1.5x, 0.089 at 3x) than inside the 2010s (0.040 at both). A fixed cost per unit of leverage takes a bigger bite when there's less return above cash to start with, which is my best guess at why. I didn't test it.
The variants we list
Across the 23 listed levered variants, the median change is -0.015, and 13 of the 23 score lower. With 4 to 8 pairs per kind, none of the groups is statistically different from zero. HAA is the clearest family. Its Stability score is 0.56 for the plain version and 0.53 at SmartLeverage 1.5x. The fixed 2x version has a Stability of 0.54 and the fixed 3x version a Stability of 0.52. VAA-G4's Stability goes from 0.30 to 0.31 at 1.5x, the Triplet's from 0.63 to 0.61.
I'd point out 2 exceptions:
- SmartStack isn't leverage on the same book. It adds gold and managed futures on top, so the mix changes and Stability moves with what those assets did. HAA SmartStack's Stability drops to 0.40, the one listed case where the rolling Sharpe swings a lot more. VAA-G4 SmartStack's Stability rises to 0.35.
- Leverage that switches on in recoveries went up. The 4 DMS "Plus" versions (Triad and Bamboo, 2x and 3x) only lever after an equity drawdown, for 12 months at most, and all 4 gained a little Stability, 0.018 to 0.028. With only 4 cases from one family of rules, I read it as a hint, not a finding.
So where did 0.41 against 0.45 come from?
From 2 places, and neither is "leverage makes strategies less steady". First, the September study measured the rolling Sharpe above zero, not above cash. On that basis leverage multiplies the return above cash but not the cash yield inside the raw return, so the levered score drops about twice as much: 0.038 to 0.062 here, against 0.019 to 0.030 above cash. Second, the leveraged group in the catalog is mostly a different set of strategies, TQQQ timers, leveraged-ETF mixes and the levered variants, rather than the plain group with leverage added.
On the catalog of 23 October, with the column above cash, the leveraged group actually scores slightly higher: a median 0.34 for the 57 leveraged variants against 0.32 for the 140 others. Above zero it's still the other way, 0.43 against 0.46. Comparing different strategies tells you about the strategies. Comparing each levered version with its own plain version is the test that answers the question.
What it means if you use the column
The leaderboard splits steady from unsteady at 0.37. Of the 55 plain versions, 18 are at or above it. Their levered versions lose a few hundredths, and 8 of them (10 at the 2x setting) drop below the line. Every one of those started between 0.37 and 0.41. So when a plain version is "steady" and its levered version isn't, I'd weigh the size of the gap before reading anything into the label. Usually it's the cost of leverage and nothing more.
The caveats. Apart from the 23 listed variants, the levered versions are previews I ran on the same engine, not strategies we list. Leveraged funds before about 2009 are rebuilt from their index. The 55 strategies share assets and signal ideas, so they aren't 55 independent tests, which is why I'd lean on the direction and size here, not on the p-values. And every figure is a backtest that fills at the signal close.
Thanks to u/confettofetti and u/paragon_22 for picking this one.