A subscriber asked on our subreddit whether there's anywhere on the site to see the leveraged versions we tested and didn't keep. A scroll through what didn't work, they said, would add a lot to their understanding. They were right, and the page they were asking for already existed: our rejection log. I just hadn't kept it up.
So I went back through this year's tests and started adding them. When I restarted the log it had 18 entries in 4 chapters, and I now add to it every week. Each strategy page also lists the versions of it we tested and left out, right above the related strategies.
The first new chapter covers the question that started it: leverage. It started with 13 entries, 12 of them new. Read side by side, they show one pattern. Leverage raised the return every time, made every drawdown deeper, and lowered the Sharpe ratio every time. Below I walk through how I got there, in the order I did it, and what it changed in how we decide which levered versions we list.
First, I levered 4 strategies we already list
The simplest test is to take a strategy we already list, run it with leverage, and compare it with the plain version over an identical stretch of history. 4 entries in the chapter are exactly that. In the table, worst fall means the biggest drop from a peak to a later low.
| Test | Test window (years) | Return a year, plain (%) | Return a year, levered (%) | Worst fall, plain (%) | Worst fall, levered (%) |
|---|---|---|---|---|---|
| HAA-Simple at 1.5x | 1974 to 2026 | 12.66% | 15.84% | -20.08% | -28.98% |
| Multi-Asset Momentum at 1.5x | 1986 to 2026 | 8.61% | 10.58% | -14.8% | -21.5% |
| HAA's best 3 of 6 assets at 2x | 1981 to 2026 | 15.08% | 23.55% | -22.6% | -48.3% |
| GGCEM with its US leg at 2x | 1986 to 2026 | 13.01% | 16.86% | -20.9% | -22.2% |
The yearly return went up in all 4. Multi-Asset Momentum gained the least, 1.97 points, and HAA's best 3 of 6 the most, 8.47. Every worst fall got deeper too, by up to 25.7 points for HAA's best 3 of 6.
Then I checked the Sharpe ratio
Return and worst fall alone don't tell you whether the extra return was worth the extra risk. That's what the Sharpe ratio is for: it measures how much return you get for each unit of ups and downs. It fell in all 4 tests. The levered versions earned more, but they took on even more risk to do it.
Why we changed how Sharpe is measured
There's a catch. Those tests ran between July and September, when our Sharpe still counted every point of return as a reward for risk. That includes the first few points, the part you could earn in T-bills with no risk at all. Leverage doesn't get that part for free, because borrowing costs about the same rate. So the old measure made every levered version look a little worse than it is. Since 18 October, the Sharpe ratios on our strategy pages are measured above cash: only the return beyond what T-bills paid counts as a reward for risk.
Rechecking the 10 levered versions we list
So I checked the levered versions we do list, on today's numbers and the new measure. We list 10 that run exactly the same rules as an unlevered version, over identical dates. All 10 have the higher return and a deeper worst fall. And all 10 still have the lower Sharpe above cash, by 0.02 to 0.22.
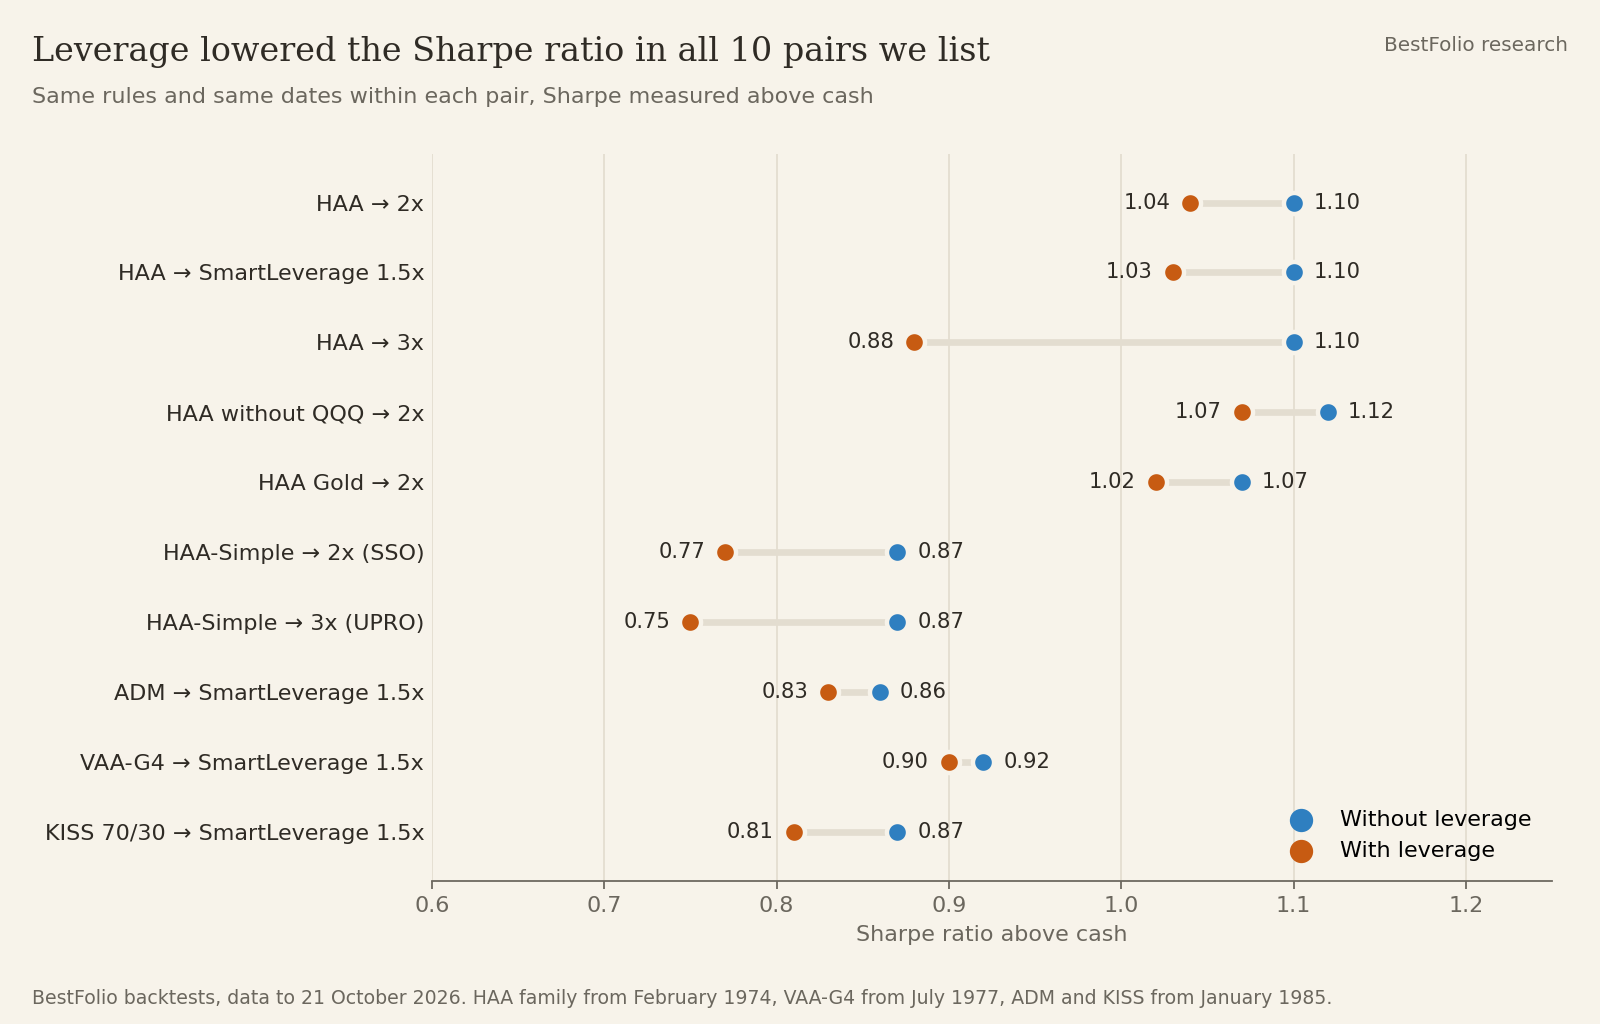
Measuring above cash did shrink the gap. On the old measure, HAA went from 1.50 to 1.25 at 2x. Above cash it goes from 1.10 to 1.04. So leverage costs less than our old numbers said, but it still cost something in every pair.
Why leverage costs Sharpe
The deeper falls are the easy part to explain: leverage multiplies the losing months as well as the winning ones. The lower Sharpe comes from what leverage costs to carry. 2x and 3x funds charge more than plain ones, they borrow at a little above the cash rate, and their daily reset loses a bit more in choppy markets.
What a lower Sharpe can't decide
That cost changed how I read the chapter. If every levered version we list gives up some Sharpe, giving up Sharpe can't be what keeps one out. Above cash, the levered versions we list keep 80% to 98% of their plain version's Sharpe. The ones we turned down, rechecked the same way, overlap with them. Sharpe alone never told the listed ones apart from the rejected ones.
So since 22 October a levered version gets listed when it passes 5 tests:
- It keeps at least 85% of the plain version's Sharpe ratio, measured above cash.
- Nothing we already list with the same signals does better: about the same return or more, a Sharpe no more than 0.02 lower, and a shallower worst fall.
- Every levered holding is a real fund you can buy today, and we say whether there's a European (UCITS) route.
- The plain signal holds up at 1x. If it uses data that gets revised after publication, it must also hold up on the data as first published.
- If its worst fall is deeper than 50%, or recovering from it took more than 5 years, it's listed only with our extreme-risk warning.
A version that fails one gets a log entry naming the test it failed. Here's how the 4 tests from the top of this post came out when I rechecked them this way:
- HAA-Simple at 1.5x fails rule 2, because a version we already list does better.
- HAA's best 3 of 6 at 2x fails rule 2 as well, and rule 3: no fund offers its 2x commodity leg.
- Multi-Asset Momentum at 1.5x passes all 5.
- Levered GGCEM is not pursued.
The rule catches versions we already list too. HAA at 3x keeps 80% of the plain Sharpe, the lowest in the chart above. It stays listed, with a note on its page pointing to HAA Leveraged (2x), which does better on return, Sharpe and worst fall.
A levered version that passes
We do list some levered versions. The Momentum-Correlation Triplet at 1.5x is one. Since the end of October 1987 it has made 18.09% a year with a worst fall of 25.53%, against 14.45% and 17.66% for the plain Triplet. It gives up some Sharpe too, 0.88 against 0.95, which is 93% of the plain Sharpe. It passes all 5 tests, and the strategy page shows both versions side by side so you can choose.
Is 1.5x a sweet spot?
The same subscriber's first question in that thread was a good one: is 1.5x a general sweet spot across our catalogue, or does it only work for a few strategies? 10 pairs, 7 of them from the HAA family, couldn't answer that, so I ran 1.5x and 2x on every strategy our SmartLeverage engine could lever, 55 of them.
1.5x isn't a sweet spot. The median strategy kept 93% of its Sharpe above cash at 1.5x and 91% at the 2x setting, and each extra unit of leverage cost about the same at both levels, roughly 1.3 points a year. 1.5x just uses less of it.
Most 1.5x versions pass the 5 tests, so passing them isn't a reason to build one. I added a payoff bar on top: keep at least 95% of the Sharpe, add at least 2 points a year, and need no extreme-risk warning. 11 new 1.5x versions clear it, including Multi-Asset Momentum and BAA-G4, and they're coming in November.
A warning about leveraged backtests that start after 2010
Some entries in the chapter aren't close calls. A grid-trading method on TQQQ, a 3x S&P 500 fund timed on the gap between the VIX and realized volatility, and a weekly signal on 3x Nasdaq each came with a result measured from 2010 or later. Run from 2000, or from 1990 for the VIX rule, they fell 99.96%, 96% and 87% at their worst. A leveraged backtest that starts after the last big crash tells you very little about the next one.
What it all comes back to
Every step pointed the same way. In the 4 tests and in all 10 levered versions we list, leverage bought more return with deeper falls and less return per unit of risk. Measuring Sharpe above cash shrank that gap, but it never closed it. So leverage has a price, and the strategy pages show both versions side by side so you can decide whether it's worth paying for your own portfolio.
The other chapters (strategies we looked at and didn't list, tweaks that didn't help, and claims we couldn't reproduce) will fill up over the coming weeks. The full log, with every rule, number and reason, is here: bestfolio.app/research/rejection-log.
Backtested results are hypothetical and don't represent actual trading. Figures for the 4 tests are as tested on the dates shown in each log entry, with Sharpe measured the old way. Figures for the strategies we list come from our backtests with data to 30 October 2026, with Sharpe above cash. The 1.5x and 2x figures across the catalogue come from non-storing runs of our SmartLeverage engine on the same data.