In September someone on r/LETFs asked a question I couldn't answer from memory. WX lists a 0.20% expense ratio, CTAP 0.10%, and both get their exposure through total return swaps. So where does the bank's cut show up, and how big is it?
I found 2 ways to put a number on it, and did both. First the contracts: every quarter a fund files a schedule of its swaps with the SEC, with the bank, the notional amount and the rate the fund pays. Then the prices: build what the fund promises out of plain ETFs, on the same days, and see how far the fund falls behind.
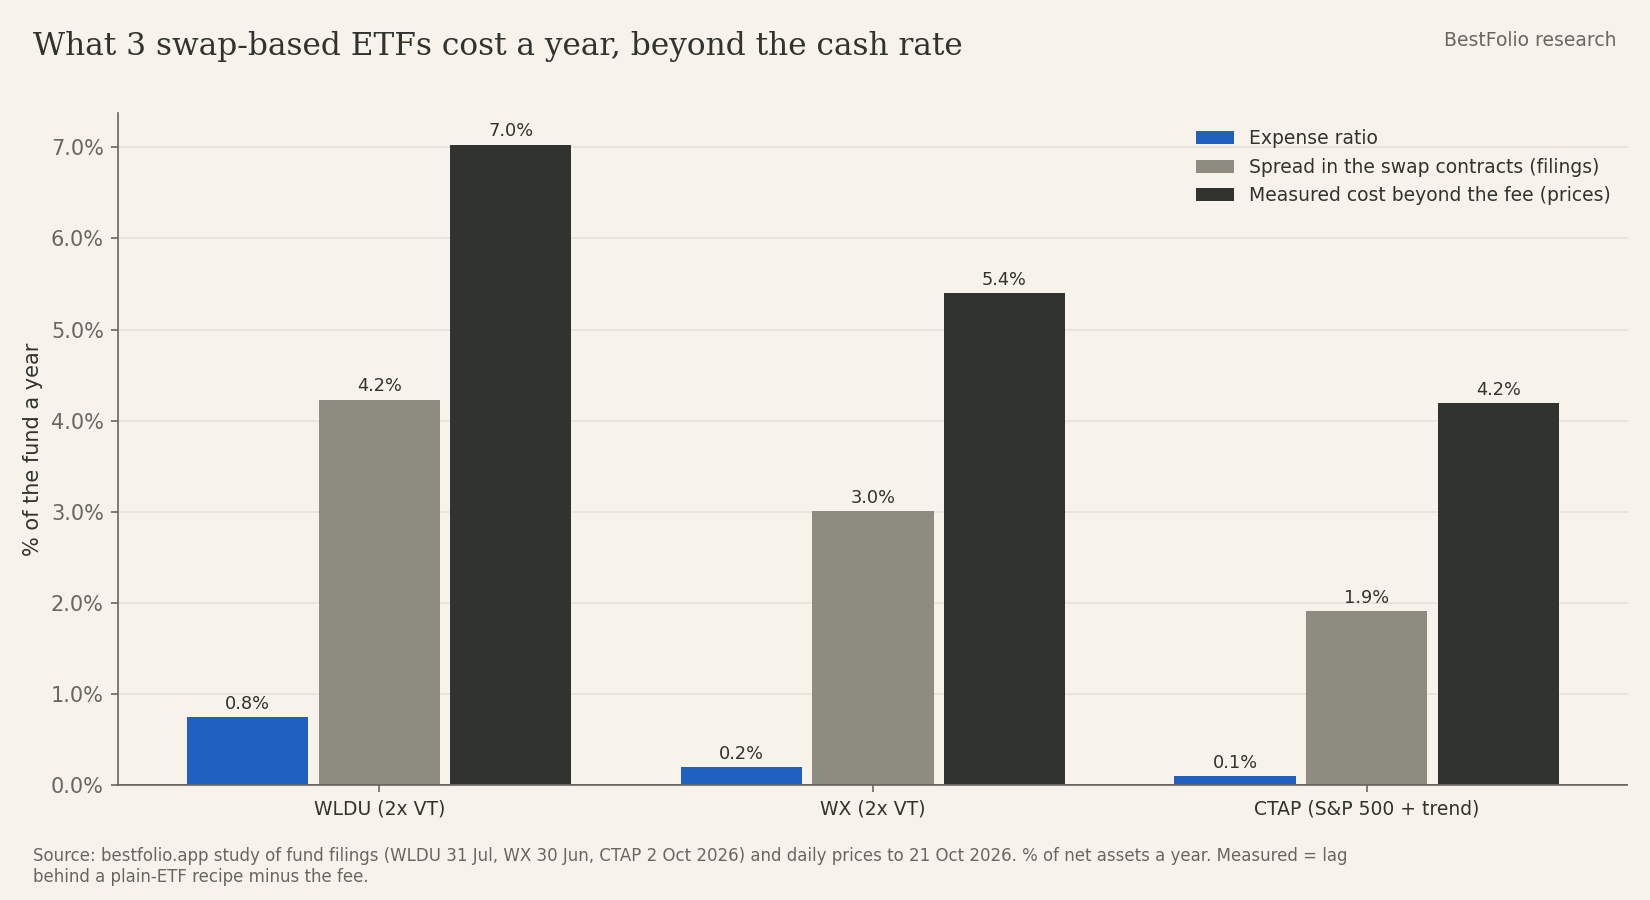
On the 2 swap funds that give you 2x VT, WX and WLDU, the bank's spread alone costs more than the fee, 15 times the fee on WX. Measured from prices, the cost beyond the fee comes out even bigger: 5.4 points a year on WX and 7.0 on WLDU.
How to read a swap schedule
A total return swap works like a loan you never see. The bank pays the fund whatever VT (or CTA, or SPUC) returns. The fund pays the bank a floating rate on the notional, usually written as an overnight rate plus a spread.
If the fund keeps its own cash in T-bills, that cash earns roughly the same overnight rate, so the rate itself mostly washes out. A fund that wants 2x is borrowing the second 1x, and paying the cash rate on it is just what leverage costs anywhere. The spread never shows up in the fee table, and the bank charges it on the whole notional, not only on the borrowed half.
The arithmetic is one line:
spread cost per year = notional × spread ÷ net assets
WX's June schedule shows one swap with Clear Street: $727,306 of VT exposure on $362,955 of net assets, paying the Overnight Bank Funding Rate plus 1.50%. That's 200% of NAV, so the spread alone costs 2 × 1.50 = 3.0% of the fund a year. Add the 0.20% fee and you're at about 3.2% a year above the cash rate, before the cash question further down.
The full coupon looks scarier. OBFR was 3.63% on 30 June, so WX was paying 5.13% on twice its assets, about 10.2% of NAV a year. It's 10.7% at today's 3.88%. Most of that should come back from the collateral, and none of it shows up in the expense ratio.
Fund by fund, from the filings
| Fund | Schedule date | Expense ratio | Swap notional, % of NAV | Rate paid | Spread cost, % of NAV a year | Fee + spread |
|---|---|---|---|---|---|---|
| WLDU | 31 Jul 2026 | 0.75% | 200% | OBFR + 2.00% (2 banks), + 2.50% (1 bank) | 4.23% | 4.98% |
| WX | 30 Jun 2026 | 0.20% | 200% | OBFR + 1.50% | 3.01% | 3.21% |
| CTAP | 2 Oct 2026 | 0.10% | 192% | SOFR or OBFR + 0.75% to 1.25% (average 0.99%) | 1.91% | 2.01% |
| CTAP | 30 Jun 2026 | 0.10% | 113% | SOFR + 0.75% to 1.49% | 1.04% to 1.44% | 1.14% to 1.54% |
| RSST | 31 Jul 2026 | 0.99% | no swaps (futures) | inside the futures price | not disclosed | 0.99% + ? |
WLDU costs the most. Its July schedule has 3 banks, Cantor Fitzgerald and Clear Street at OBFR + 2.00% and Marex at + 2.50%, on 200% of NAV. The April schedule had the same 3 spreads, so this isn't a one-quarter blip. The prospectus says it plainly in a footnote: the embedded cost of the swaps "is not included in the above fee table".
WX is cheaper on spread and on fee, but it's tiny. It had $363k of assets in June and $608k on 2 October. Swap terms for a fund that size can move when it grows, in either direction. The June filing also shows the notional twice, $727,306 in the schedule and $721,342 in the machine-readable data. That's 3.01% or 2.98%, so I don't lose sleep over it.
CTAP changed shape since June. In June it owned IVV directly (78% of NAV) plus S&P futures, and used swaps only for the CTA leg, 113% of NAV. On 2 October the issuer's holdings page shows no IVV at all. Both legs now run through swaps, CTA for the trend side and SPUC for the equity side, 192% of NAV in total, with the cash in T-bills. More notional on swaps means more spread: 1.91% a year now. Its 0.10% fee is also net of a fee waiver that runs to 4 December 2026.
The June number comes with a wrinkle. The annual report labels the Bank of America swaps "SOFR + 1.49%", but their coupons (4.48% to 4.68%) only fit SOFR plus about 1%. The issuer's October holdings name the biggest of them "SOFR +100". So June is 1.04% if you trust the coupons and 1.44% if you trust the labels.
There's a second layer on CTAP that isn't financing at all. A swap on CTA pays CTA's return after CTA's own 0.75% fee, and a swap on SPUC pays SPUC's return after its 0.53%. At October's weights that's another 1.24% of NAV a year inside the swap references. You'd pay CTA's fee anyway if you held CTA yourself. SPUC's 0.53% replaces the 0.03% IVV used to cost.
RSST doesn't use swaps. Its July filing shows 77% of NAV in an S&P 500 ETF, S&P futures for another 40%, and a managed futures book on top. Futures build the financing into the price (cash rate plus a basis that moves around), and no filing discloses it, so I can't size it from documents.
What the prices say
Contracts tell you what a fund agreed to pay. To see what investors actually paid, I compared each fund with a recipe built from ordinary ETFs that hold the same exposure without leverage, re-weighted at every close, with anything above 100% financed at the T-bill rate (BIL's total return):
- WX and WLDU: 2x VT, borrowing 1x.
- CTAP: IVV plus CTA, borrowing 1x. Since July its equity swaps reference SPUC instead of IVV, so I ran that version too.
- SSO: 2x SPY, borrowing 1x. I added it as a check, because it has 20 years of history.
- GDE: 90% IVV plus 90% GLD. NTSX: 90% IVV plus 60% GOVT. RSSB: 100% VT plus a Treasury ladder.
The lag is the yearly gap between the fund and its recipe on the same days. Take off the expense ratio and what's left is the part nobody prints.
| Fund | Window | Expense ratio | Lag behind the recipe, per year | Beyond the fee (± 1 standard error) |
|---|---|---|---|---|
| WLDU (2x VT, swaps) | 11 Mar to 21 Oct 2026 | 0.75% | 7.78% | 7.03 ± 1.76 |
| WX (2x VT, swaps) | 4 Jun to 21 Oct 2026 | 0.20% | 5.60% | 5.40 ± 1.44 |
| CTAP (S&P + trend, swaps) | 10 Dec 2025 to 21 Oct 2026 | 0.10% | 4.29% | 4.19 ± 2.53 |
| SSO (2x S&P, swaps + futures) | June 2006 to Oct 2026 | 0.84% | 1.60% | 0.76 ± 0.30 |
| GDE (S&P + gold, futures) | March 2022 to Oct 2026 | 0.20% | 0.65% | 0.45 ± 1.69 |
| NTSX (S&P + Treasuries, futures) | August 2018 to Oct 2026 | 0.20% | 0.38% | 0.18 ± 0.87 |
| RSSB (world + Treasuries, futures) | December 2023 to Oct 2026 | 0.39% | -0.08% | -0.47 ± 0.93 |
On the young funds the error bar is wide, because 4 to 10 months isn't much data. In dollars: from 11 March, $10,000 in WLDU grew to $11,448 while the recipe reached $12,031. Over 20 years the gap compounds: $10,000 in SSO became $195,697 against $271,699 for 2x SPY borrowing at the T-bill rate, with almost the same worst fall (-84.7% and -84.2%).
RSST is missing on purpose. Its trend sleeve copies a basket of big trend-following funds, and no ETF holds that sleeve without leverage. With DBMF as the stand-in, RSST lags by 4.4 a year beyond its fee. With KMLM it beats the recipe by 4.4. That swing comes from the trend models, not from financing, so for RSST the only number I can give you is the 0.99% fee.
Where the extra cost on WX and WLDU comes from
The spread explains 3.0 points on WX and 4.2 on WLDU. The measurement says 5.4 and 7.0. The rest comes from the cash.
Earlier I assumed the fund keeps its own money in T-bills and earns the cash rate on it. WLDU keeps only about a fifth of its assets in a money market fund. The rest is cash pledged to the swap banks, and in its semi-annual report to 30 April the fund booked no interest income at all, only $1,815 of dividends. WX held 38% in a money market fund on 30 June. So both funds pay interest on twice their size and earn it on a slice.
Add the 2 pieces, spread and idle cash, and the filings predict 7.35% a year beyond the fee for WLDU and 5.47% for WX. I measured 7.03 and 5.40. I wouldn't lean on the second decimal with a few months of data, but the 2 funds line up with their own paperwork.
CTAP is different. On 2 October 94% of its assets sat in T-bills, so its cash earns. Its spreads cover at most about half of the 3.7 to 4.2 I measured, and with 10 months of data the error bar is still 2.5 points, so I'm leaving the rest unexplained for now.
The futures funds land within about half a point of their fees over their whole lives. For NTSX, GDE and RSSB the expense ratio is a fair guide.
What a 5 to 8 point bill does to a 2x VT
Here's where I have to own something. I built BestFolio (so read this section knowing I'm grading my own homework). In our post on the hunt for a 2x VT we simulated WLDU with financing at Fed funds + 0.5% on the borrowed half. Until 5 October 2026 our backtest engine used that rule for every leveraged and stacked fund in the years before it existed. It tracks big funds like SSO and UPRO closely, and they still use it. WLDU's real cost is a lot higher.
So I reran the same 2x VT from June 2008 under each set of costs.
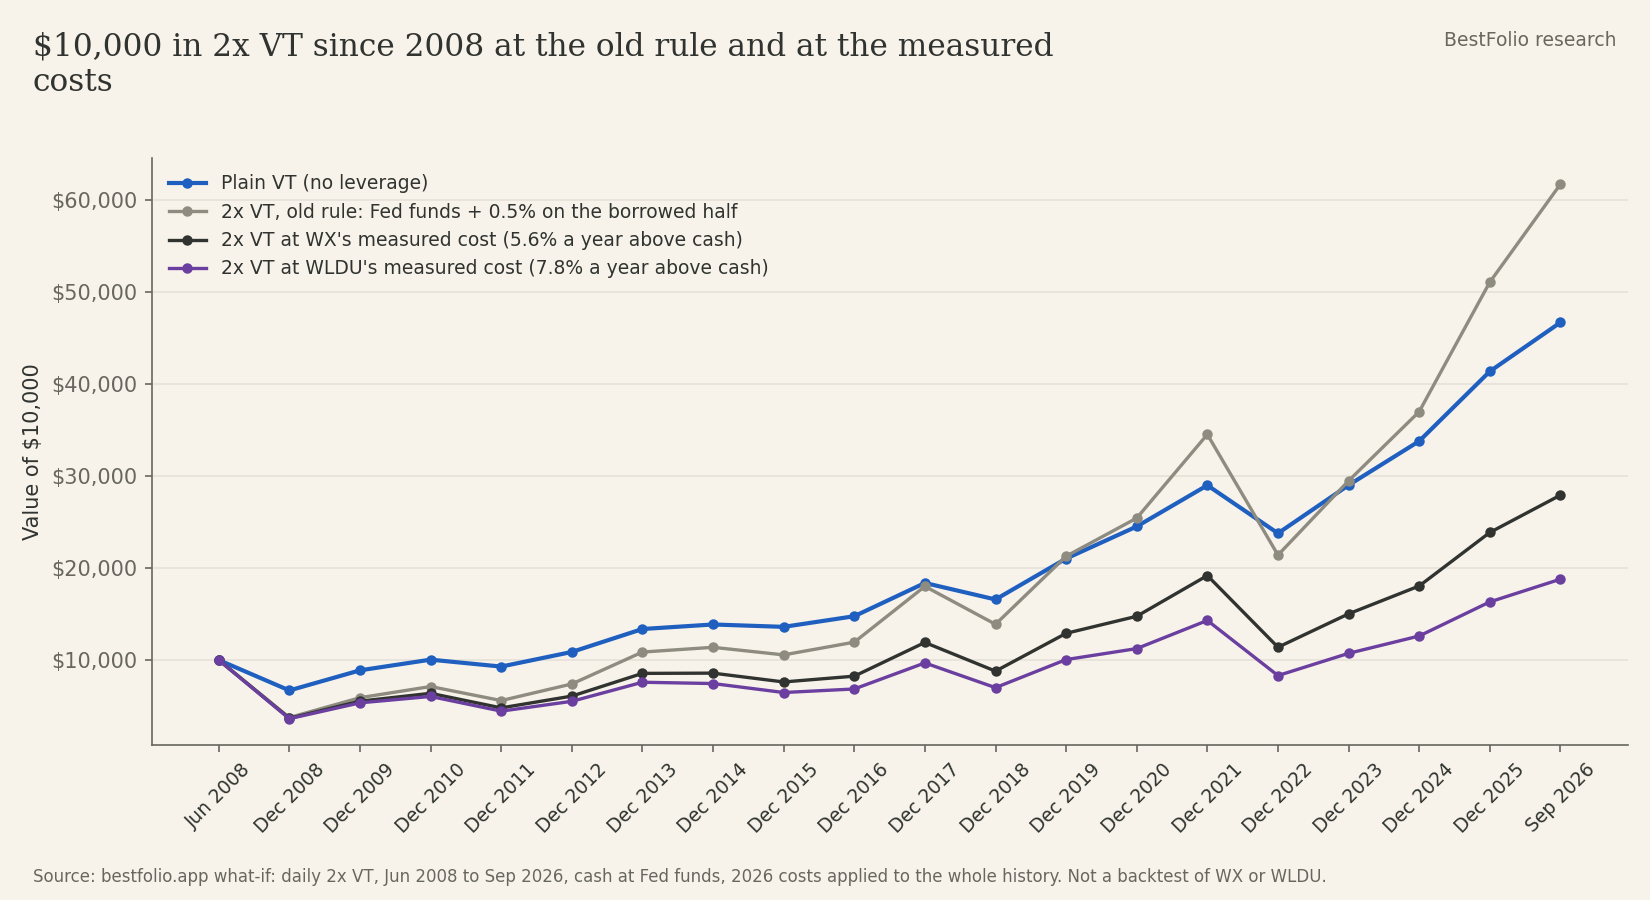
| June 2008 to Sept 2026 | Cost above cash, per year | Return a year | $10,000 became | Worst drawdown |
|---|---|---|---|---|
| Plain VT | 0 | 8.8% | $46,718 | -50% |
| 2x VT, Fed funds + 0.5% on the borrowed half, 0.75% fee | 1.25% | 10.5% | $61,752 | -80% |
| 2x VT at WX's contract spread and fee | 3.20% | 8.4% | $43,281 | -80% |
| 2x VT at WLDU's contract spread and fee | 4.98% | 6.4% | $31,261 | -81% |
| 2x VT at WX's measured cost | 5.60% | 5.8% | $27,936 | -81% |
| 2x VT at WLDU's measured cost | 7.78% | 3.5% | $18,796 | -81% |
At the measured costs, 2x VT trails plain VT by 3.0 points a year at WX's and by 5.3 at WLDU's, after taking the -80% drawdown to get there. The volatility drag of a daily reset on a world index is already big, and a 5 to 8 point bill eats the rest of the premium and then some.
My numbers line up with the old post where they should: with the same Fed funds + 0.5% rule I get 10.5% a year against the post's 10.7%, on a window that ends 2 months later. The assumption was what went wrong, not the arithmetic.
That post has carried a correction note since 4 October 2026. Since 5 October 2026 our engine charges each swap-financed fund its filed spread on the full notional for the years before it launched. That's the spread cost column in the filings table above, charged in every year before launch. For futures-based funds like NTSX or RSST, half a point over Fed funds is in the right range, and they still pay it.
The idle cash isn't in the engine yet, so our pre-launch years for WX and WLDU are still about 2 to 3 points a year too kind. WX's annual report for the year to 30 September should show what its collateral earned, and I want to see it before changing the engine again.
How to check a fund yourself
It takes about 10 minutes per fund.
- Search the fund name on SEC EDGAR and open the latest NPORT-P (quarter-end) or the semi-annual or annual report. Recent funds only have N-PORT.
- Find the "Schedule of Total Return Swap Contracts". Write down each notional and its rate, for example "OBFR + 2.00%".
- Add up notional × spread for every line and divide by net assets. That's the spread cost per year, as a share of your money.
- Look at where the cash sits. A money market fund or T-bills earn interest; "segregated cash" held for the swap banks may earn nothing. If the report shows little or no interest income, add the cash rate on that idle part.
- Add the expense ratio. If the swaps reference another fund (CTAP's do), that fund's fee is inside the return too.
Don't apply the spread only to the "extra" exposure; it's charged on the full notional. And if you use the whole floating rate instead of the spread, count what the collateral earns too, or the answer comes out 3 to 5 times too big.
When I measured SSO against margin, borrowing through the big 2x S&P fund came to 1.52 points a year above Fed funds over 20 years, fee included. WX's contracts alone imply about twice that, and its measured cost is more than 3 times that, on a fund with a fee a quarter of SSO's.
Contract terms come from each fund's own filings on the dates shown, held constant for a year, and terms change. Measured costs use daily adjusted closes to 21 October 2026 (our price data, Yahoo for WX), market prices rather than NAV, with standard errors from 2-week and monthly sums because single-day gaps from stale closes undo themselves the next day. WX trades about 100 shares on a typical day, so its close can be stale. The 2x VT lines are a what-if with 2026 costs applied to past data, cash at Fed funds, not results anyone earned. Rates: OBFR 3.88%, SOFR 3.88% and the 3-month T-bill 4.08% on 20 October 2026 (FRED). Nothing here is a recommendation to buy or sell any fund.