What does 2x the S&P 500 really cost once you count the financing? The question came up twice on r/LETFs in September. One thread weighed SSO against holding VOO and buying more on margin. The other asked for a comparison across margin, options, futures and swap-based funds, because the expense ratio leaves most of the cost out.
We measured it on SSO's actual prices over the fund's whole life, from its first close on 21 June 2006 to 21 September 2026, and built margin accounts on the same dates.
- All in, SSO's leverage cost 1.52% a year above the Fed funds rate. Roughly 0.84 of that is the expense ratio. The other 0.68 or so never appears on the fact sheet.
- Margin at Interactive Brokers' first tier cost about the same. SSO finished level with a 2x SPY margin account re-levered every day at Fed funds + 1.40%. IBKR Pro posts Fed funds + 1.5% on the first $100k. Schwab's posted rate for a $100k to $250k balance, 10.575% on 23 September 2026, would have cost 5.37 percentage points more per year than SSO.
- At IBKR's rates, how often you re-lever mattered more than the rate. Once a month instead of every day added 1.56 points of return per year since 2006, but that edge ran the other way from 1977 to 1987. And 2x bought once and never re-levered was force-sold on 12 days between 9 October 2008 and 9 March 2009.
Where SSO's 2x comes from
On 22 September 2026, SSO held S&P 500 stocks worth 67.47% of its net assets, swaps with 10 banks worth 119.51%, and E-mini futures worth 13.00%. Together that's the 2x.
A swap charges a floating financing rate, and a futures contract builds the same financing into its price. ProShares' own page says its derivatives are "priced to include the underlying index yield", so the dividends on that exposure get netted inside the contract as well. All of it comes out of the fund's net asset value, which grows a little slower than twice the index. None of it shows up in the 0.84%.
How we measured it
The yardstick is a perfect 2x. It takes twice the daily total return of the S&P 500, re-levers at every close, and pays the effective Fed funds rate on the borrowed half and nothing else. We then solved for the constant yearly cost that, taken off that yardstick, lands exactly on SSO's real end value.
It comes to 1.52% a year above Fed funds, over a period when Fed funds averaged 1.74%. The 0.84% fee is inside it. The remaining 0.68% or so is what the fact sheet doesn't list: the spread the swap banks charge over their benchmark rate, cash earning T-bill rates, and the fund's own trading. We can't size those pieces separately, only their total.
Read the 0.84/0.68 split as approximate. The 0.84% is today's fee, and we couldn't verify what SSO charged in its early years, so part of the 0.68 may really be fee. The 1.52% total doesn't depend on the split.
We used end values on purpose. On violent days SSO's closing price undershoots 2x and catches up over the next sessions. Its beta to the index is 1.95 on daily data and 1.99 on weekly data. Averaging the daily gaps instead would overstate SSO's yearly cost by 0.33 points.
The cost rose with rates. From mid-2006 to the end of 2015, with Fed funds averaging 1.12%, SSO ran 1.39% above it. From 2016 on, with Fed funds at 2.29%, it was 1.64%. Since January 2022 it's been 1.81%.
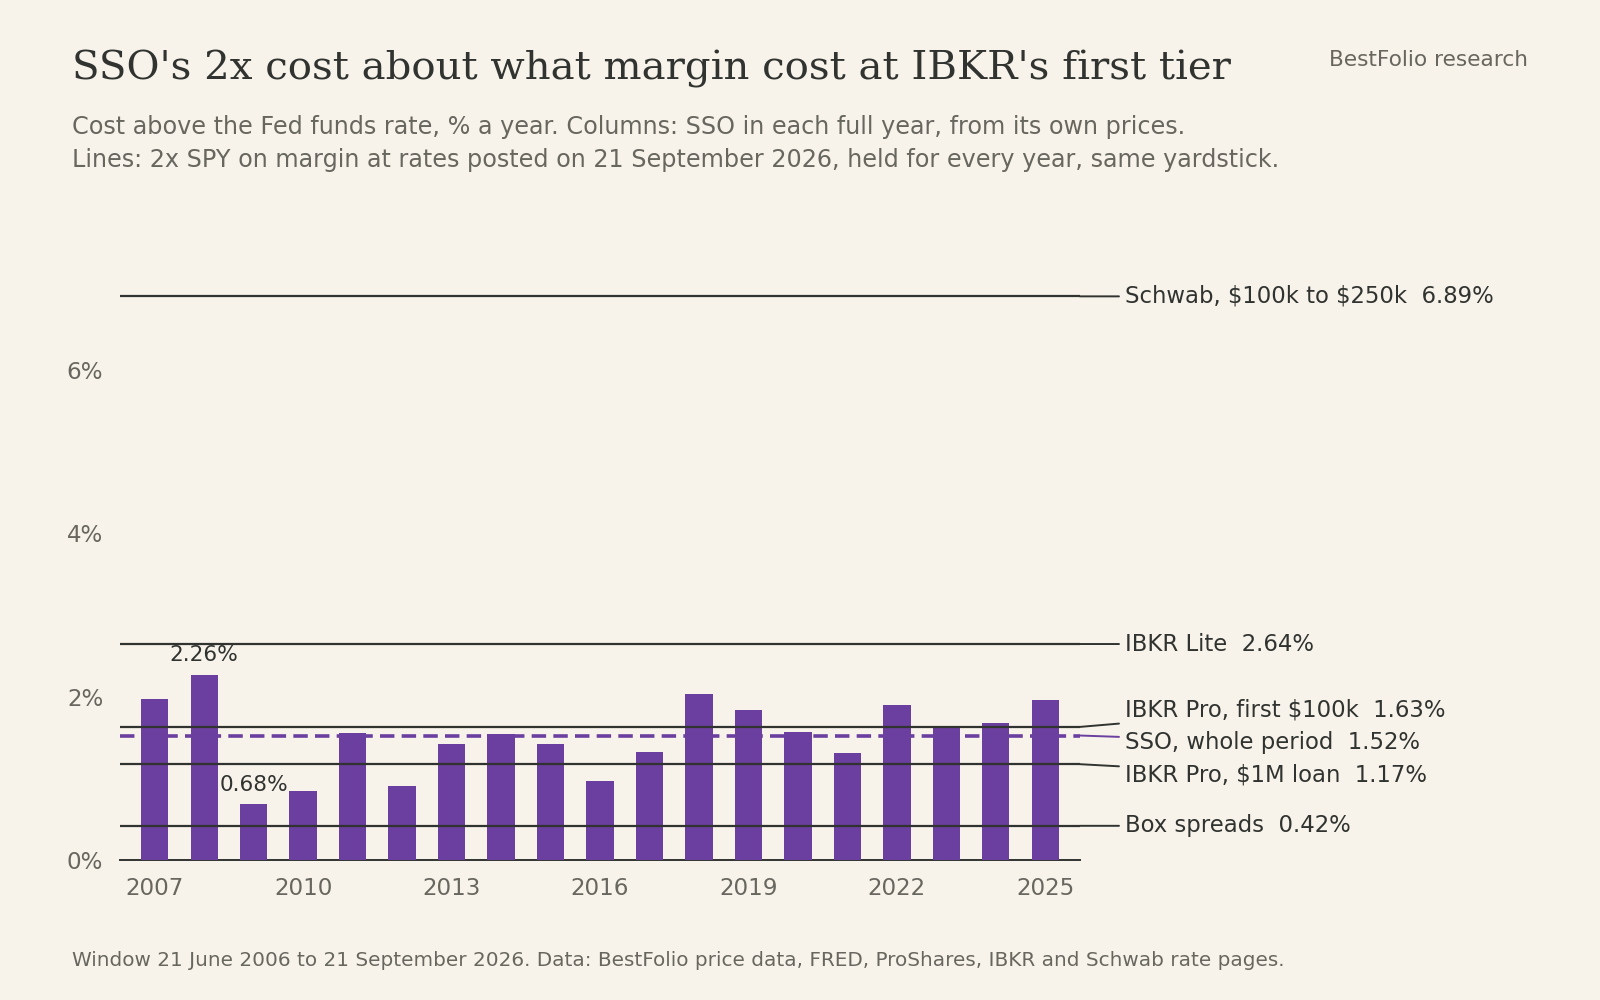
Every route on the same yardstick
Same yardstick, same 20 years, for a margin account holding SPY at 2x. VOO only started trading in September 2010, so SPY it is, and its own fee is already inside its returns.
For Interactive Brokers and Schwab we took the rates each one posts on its public rates page, as of 23 September 2026, and held their spread over Fed funds for the whole period. That day Fed funds was 3.88%, so IBKR Pro's first tier was 5.38% and Schwab's $100k to $250k tier was 10.575%.
| Route | Rate paid | Cost above Fed funds | CAGR, re-levered daily | CAGR, re-levered monthly | CAGR, bought once and held |
|---|---|---|---|---|---|
| Box spreads | T-bills + 0.40% | 0.42% | 17.14% | 18.71% | 10.40% |
| IBKR Pro, $1M borrowed | Fed funds + 1.05% (blended) | 1.17% | 16.26% | 17.82% | 9.80% |
| SSO | built into the fund | 1.52% | 15.85% | n/a | n/a |
| IBKR Pro, first $100k | Fed funds + 1.50% | 1.63% | 15.73% | 17.29% | 9.55% |
| IBKR Lite | Fed funds + 2.50% | 2.64% | 14.56% | 16.11% | 8.98% |
| Schwab, $100k to $250k | 10.575% (Fed funds + 6.695%) | 6.89% | 9.79% | 11.28% | 6.22% |
For scale, over the same dates plain SPY returned 11.44% a year and the perfect 2x returned 17.63%. Bought once and held, the 2x margin account trailed plain SPY at every rate in the table, box spreads included.
The cleanest comparison skips the yardstick. SSO ended exactly where a 2x SPY margin account re-levered every day would have ended at Fed funds + 1.40%. That's lower than 1.52% because the margin account also pays SPY's own fee on 2 units, about 0.11% a year here, and our margin interest accrues on a 360-day year. Against VOO, from its 2010 launch, the break-even was Fed funds + 1.47%.
Borrow below the break-even and margin was cheaper than SSO. Above it, SSO was. IBKR's first tier sits a hair above the line, close enough to call it a wash. Its $1M blended rate would have saved about 0.35 points per year. IBKR Lite would have cost about 1.12 points more, and Schwab's posted rate 5.37 points more. At Schwab's rate even the monthly 2x account returned 11.28% a year, less than the 11.44% plain SPY made without borrowing a cent.
Rates moved this too. Since January 2022 the break-even rose to Fed funds + 1.54% against SPY and + 1.73% against VOO, so IBKR's first tier has been a bit cheaper than SSO lately.
The cheap end, and what we couldn't measure
A box spread lets you borrow through S&P 500 index options at close to Treasury rates. Van Binsbergen, Diamond and Grotteria measured box-implied rates at about 0.40 points above Treasury yields on average, and that's the rate we used.
E-mini futures aren't in the table. We have no futures data, so we couldn't measure that route at all, and the cheap end of this comparison rests on that one paper's estimate.
Re-levering is the bigger number, and the less reliable one
At the same IBKR rate, re-levering once a month instead of every day lifted the annual return from 15.73% to 17.29%, a gain of 1.56 points. That beats every financing gap in the table except Schwab's.
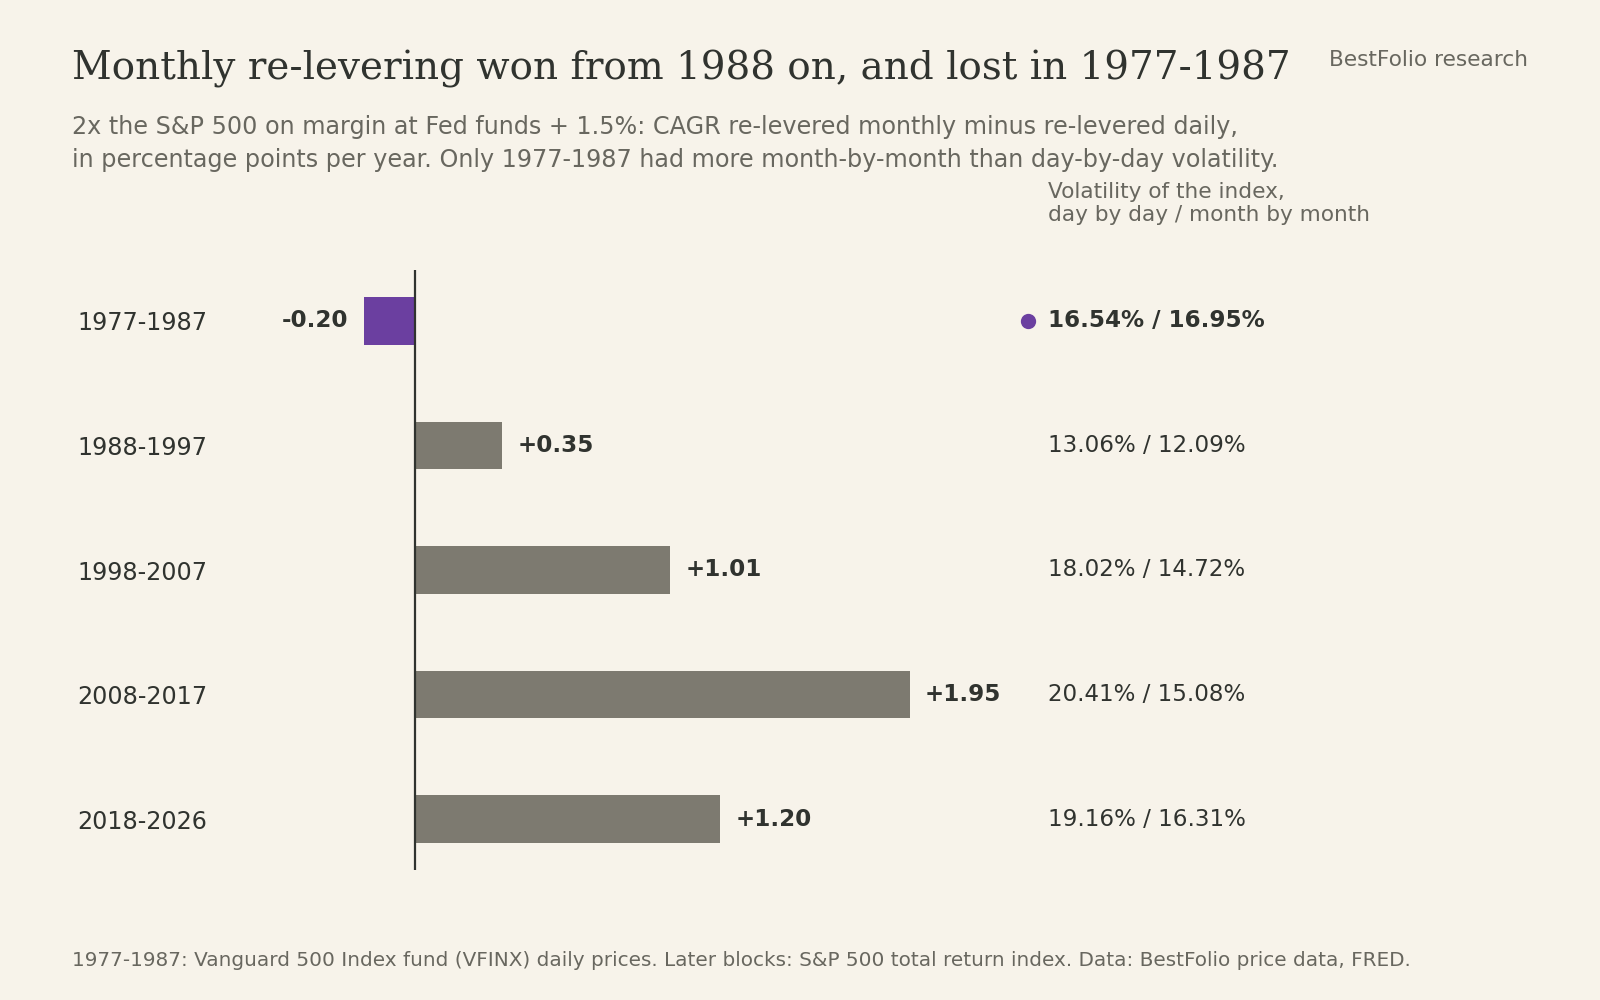
The reason is how the S&P moved. A daily reset sells after every down day and buys after every up day, so it loses when moves partly reverse the next day. Over these 20 years, SPY's volatility measured day by day was 19.36%. Measured month by month it was 15.19%. That gap is the chop a daily reset pays for, and a monthly account mostly sits through it.
Monthly came out ahead in 16 of the 19 full years from 2007 to 2025, most of all in 2020 (28.98% against 22.43%). It also won in each of the 4 roughly decade-long blocks of index history since 1988, by margins between 0.35 and 1.95 points.
Then 1977 to 1987 went the other way. Daily moves back then tended to continue into the next day, and the daily reset came out ahead by 0.20 points per year. The monthly edge comes from how the market has moved since 1988, and that can change. We wouldn't count on it.
A monthly account is also 2x only on the last day of each month. In between, its leverage drifts up as prices fall: at the close on 27 October 2008 it was running at 3.25x. Its daily swings were bigger too, with 41.84% volatility against 38.71% for the daily reset.
Margin calls
A broker can sell you out when your equity falls below its maintenance requirement. The usual floor is 25% of the account, and brokers can set a higher one. A fresh 2x position hits 25% after a 33.3% fall.
Re-levered monthly, the account never got there. Its worst close was 30.78% equity on 27 October 2008, and 33.86% on 23 March 2020. With a 35% house requirement it would have been force-sold on 4 days, 3 of them in October 2008 and one on 23 March 2020.
Bought once and never touched, 2x fared much worse. Started at SSO's launch, that account was force-sold on 12 days between 9 October 2008 and 9 March 2009. Without those sales its equity would have dropped below zero at the March 2009 low. It finished at 9.55% a year, below plain SPY and 6.30 points behind SSO's 15.85%. Left alone after the crash it drifted back toward 1x, and by September 2026 it was running at 1.09x.
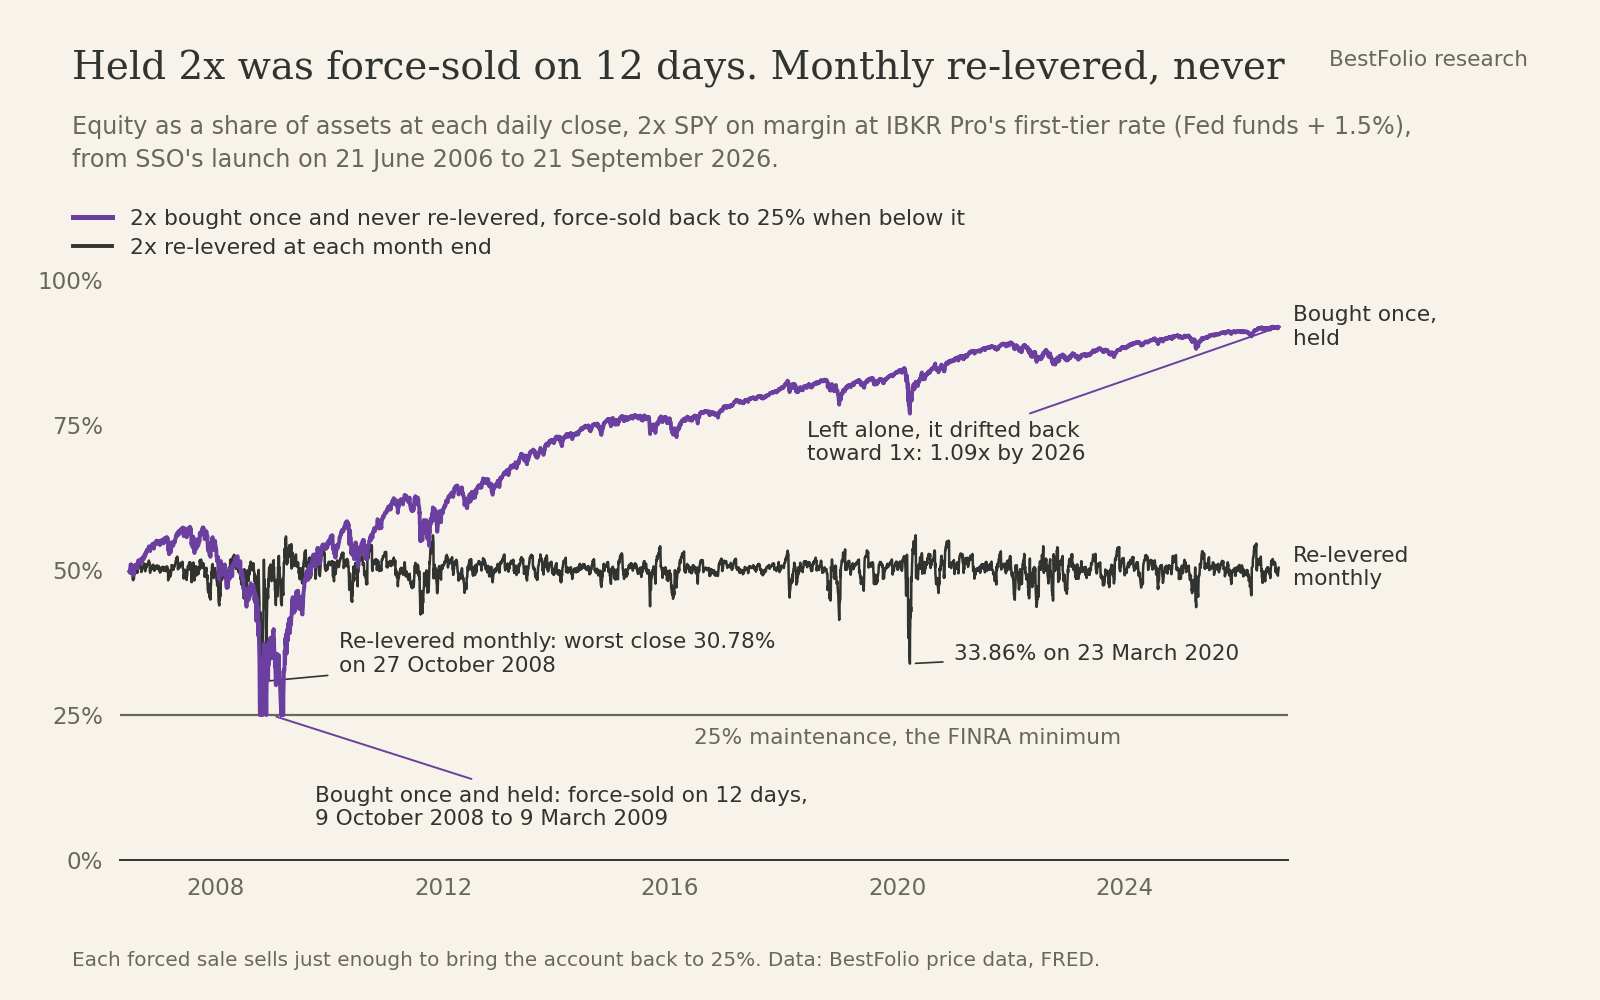
The start date barely mattered before the crash. Of the 244 monthly start dates since June 2006, every one up to September 2008 hit the 25% floor in 2008, 29 in all. With a 35% requirement the count goes to 46, including starts from 2018 to 2021 that were caught in March 2020 or June 2022.
Across all 124 rolling 10-year windows, 2x bought once and held was the worst of the 4 routes every time. Its median shortfall against SSO was 3.54 points of return per year.
SSO has no margin call to fear, and it still fell 84.67% from its October 2007 peak to March 2009.
What's not in these numbers
Taxes, for a start. US margin interest can be deductible as investment interest if you itemize, while SSO's costs sit inside its net asset value. Re-levering a taxable account every month can also realize gains.
The broker rates are today's spreads applied to every year. We didn't verify how IBKR or Schwab priced loans in 2008. Schwab's spread was probably wider in the zero-rate years, so if anything its row understates the cost.
E-mini futures are missing, as above. And SSO's history starts 2 years before the worst crash in the sample, so every SSO number carries that start date.
Trading costs barely matter. The monthly account re-levered about 0.83 times its equity a year, which costs under 0.01 points of return per year, even at 1 basis point per dollar traded.
The margin accounts in this post are simulations on historical prices, not live results. SSO's figures come from its actual prices.
One side result. BestFolio fills in SSO's history before 2006 with a simulated 2x SPY financed at Fed funds + 0.50%, with a 0.95% fee. Over the fund's real life that model compounds at 15.85% a year, the same as SSO itself.
In July we traced the same hidden layers inside a 2x UCITS fund, and its history was too short for a clean number. SSO's 20 years are long enough.
What we'd take from it
On cost alone, SSO and a 2x margin account at IBKR's first tier have been close to a tie, and the gap moved with rates. Borrowing at IBKR's $1M tier or cheaper beat SSO. At a posted rate like Schwab's, the interest ate more than the leverage earned.
Re-levering monthly on margin helped from 1988 on, and it's the least reliable part of the result. It also needs a broker that keeps maintenance near 25% in a crash, and the discipline to re-lever every month. Buying 2x on margin and leaving it alone was the worst route in every window we checked. The drawdown side is its own topic, and we went through one way to handle it in the catastrophe brake post.
The prices are SSO, SPY and VOO adjusted closes from BestFolio's price data. The effective Fed funds and 3-month T-bill rates come from FRED, and SSO's fee and holdings from ProShares' SSO page. Broker rates come from the public margin-rate pages of Interactive Brokers and Schwab, read on 23 September 2026 (Schwab's base rate had last changed on 18 September). Box-spread rates come from NBER working paper w26138.