Correction (6 September 2026): the Sharpe and Sortino figures in this post were computed under earlier definitions (daily-basis Sharpe before May 2026, losing-month Sortino before September 2026). Every live page now uses one monthly definition described on the methodology page; the strategy pages carry the current values.
This is the free companion to the Reddit discussions of this strategy: every rule and every number, no account needed.
The idea comes from u/confettofetti on r/LETFs, who built a "golden ratio" portfolio with a de-lever switch and published the concept openly. We liked it enough to rebuild it on real funds in our backtest engine, and this post is the complete result. Credit for the design is theirs; the numbers below are ours.
The complete rule
Two signals, checked monthly: SPY versus its 200-day average, and TIP (inflation-protected treasuries) versus its 200-day average, each with a small 0.1% band to avoid churn on exact touches.
Risk-on (both above): 50% UPRO, plus a five-asset sleeve at 10% each: SPMO (momentum), VBR (small-cap value), DBMF (managed futures), GLD (gold), TLT (long treasuries).
Risk-off (either below): drop the UPRO and run the same sleeve at 20% each. There is no cash position at any point. The sleeve simply doubles, which is the clever part of the design: a signal flip only ever trades the UPRO leg, so the gate cannot whipsaw the whole book, only the leverage.
Gross leverage runs about 1.7x when risk-on and 1.0x when risk-off.
The numbers, April 2008 through July 2026
| CAGR | Max drawdown | Volatility | Sharpe | Sortino |
|---|---|---|---|---|
| 19.9% | -37.3% | 19.4% | 1.11 | 1.70 |
Year by year (2008 is a partial year from April; 2026 runs to July 9; these figures move slightly as data extends):
| 2008* | 2009 | 2010 | 2011 | 2012 | 2013 | 2014 | 2015 | 2016 | 2017 |
|---|---|---|---|---|---|---|---|---|---|
| -10.8 | +34.8 | +9.9 | -10.4 | +23.2 | +25.5 | +33.9 | +6.2 | +13.4 | +36.0 |
| 2018 | 2019 | 2020 | 2021 | 2022 | 2023 | 2024 | 2025 | 2026* |
|---|---|---|---|---|---|---|---|---|
| +17.8 | +37.2 | +22.8 | +46.8 | -8.5 | +25.7 | +39.4 | +27.0 | +15.2 |
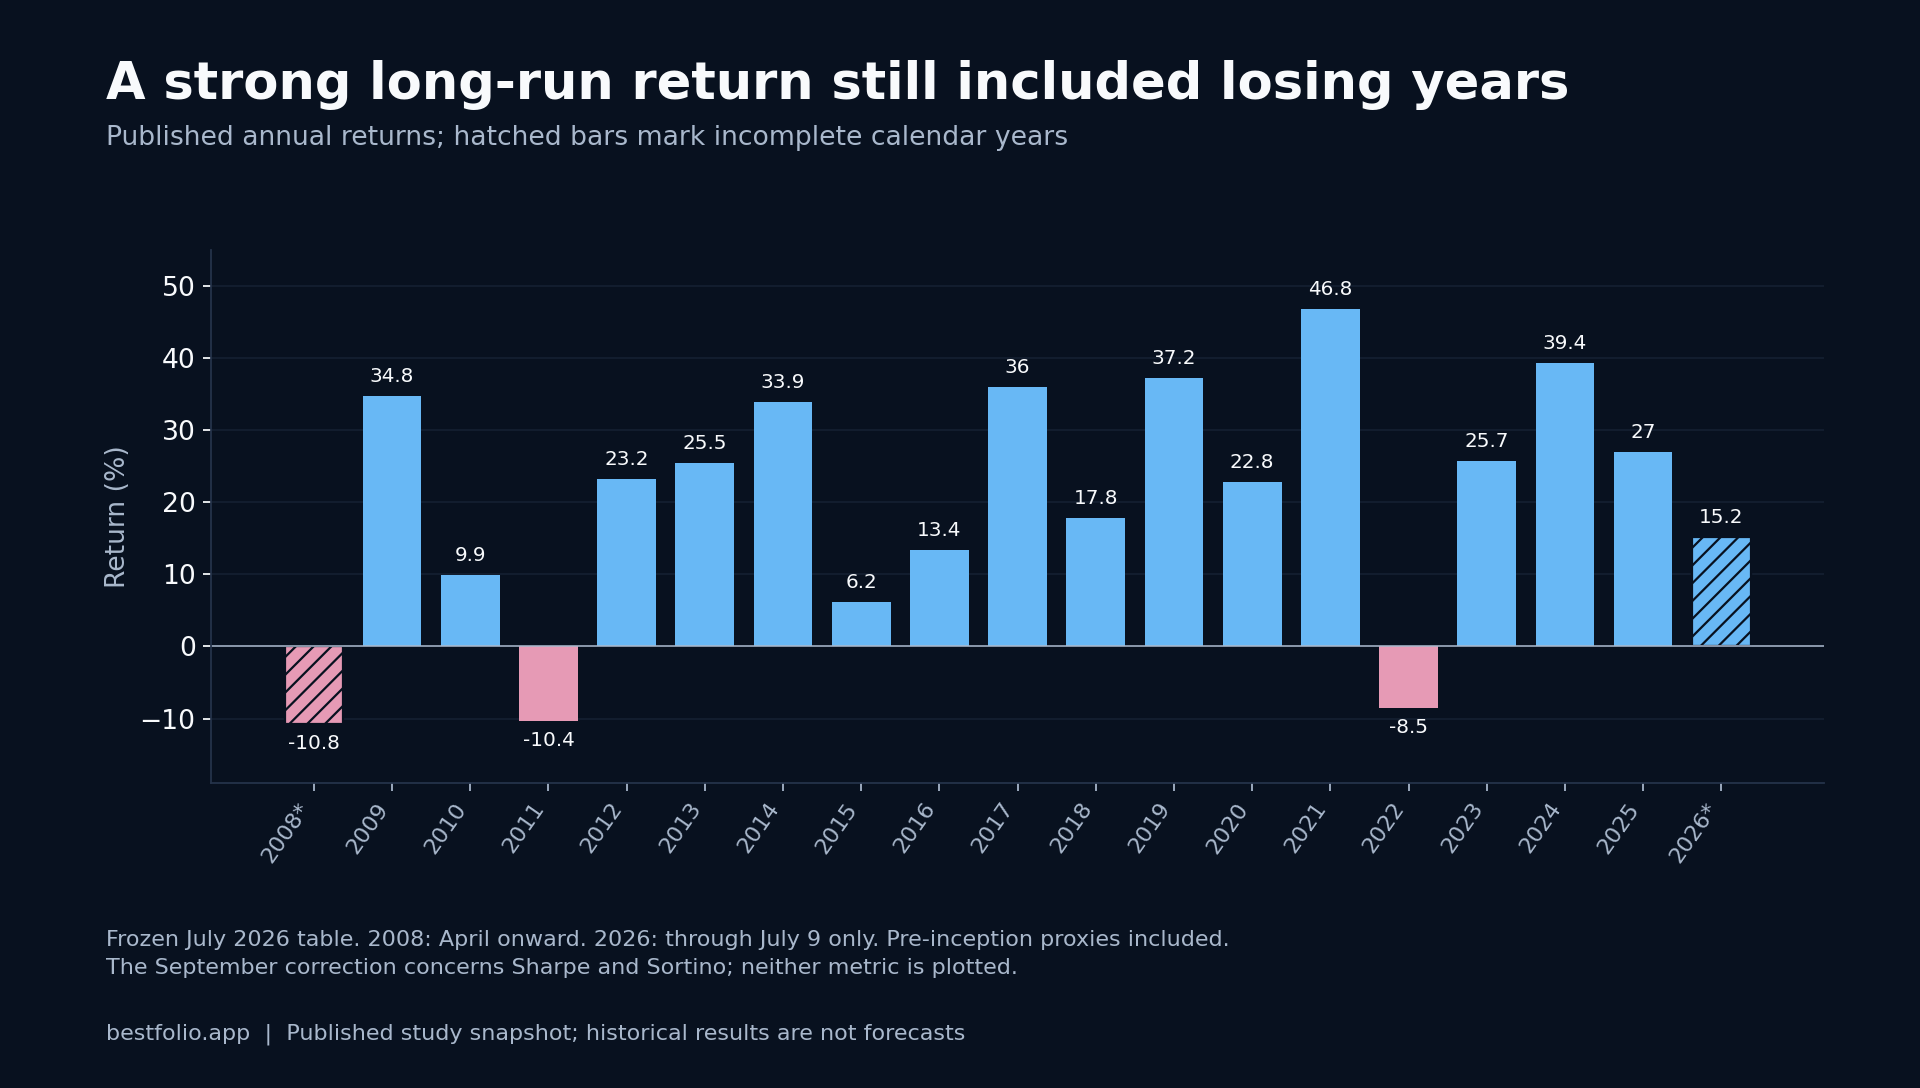
Two rows deserve a closer look before anyone falls in love with the CAGR.
Where the -37% lives: five weeks in 2020
The maximum drawdown is the COVID crash: trough on March 18, 2020, recovered by early September. A monthly 200-day gate cannot react to a five-week collapse; the strategy rode into it levered and the sleeve could only soften the fall. This is the general lesson we measured in our fast-crash event study: trend gates win slow bears and sleep through fast ones. The 2022 slow bear is the flip side, where the gate earned its keep: the strategy's worst point that year was -14%, and the calendar year closed at -8.5% while unhedged levered equity was down far more.
The 2013 scar, precisely
2013 gets called this strategy's scar year, and it is worth stating exactly what happened, because the portfolio still returned +25.5% that year. The scar is opportunity cost. The taper tantrum shoved TIP below its 200-day while equities kept climbing, so the gate pulled the UPRO leg for 184 trading days, during which SPY rose 18.7%. The sleeve performed; the leverage you were paying the whole design for sat out a monster year on a head fake.
Can a better signal fix it? We tested the obvious candidate: gating on the 10-year real yield against its own 200-day trend instead of the TIP price. It makes 2013 worse, staying dark for 224 trading days against 184, while behaving almost identically in 2022. Both signals fire on the same taper shock; the yield version just takes longer to calm down. Our conclusion, which matches what confettofetti himself argued on Reddit: the false alarm is the price of any rates-sensitive canary, roughly once a decade, in exchange for the 2022-style save. Accept it or diversify across a second uncorrelated strategy; do not curve-fit a rescue for one head fake.
Honest limits
The backtest starts in April 2008 because that is where our managed-futures proxy chain gets clean; the original design has been simulated back to 1988 elsewhere, but we will not publish deep history we cannot stand behind. The whole window is a backtest, not live track record, and the rule was specified with hindsight of this era. One methodology note worth surfacing: SPMO listed in late 2015 but barely traded for its first two years (151 zero-volume sessions in 2016), so the momentum sleeve uses PDP, the 2007-inception momentum ETF with real daily prints, for the span before SPMO becomes liquid. That choice was finalized on July 10 and moved the headline CAGR from 19.0% to 19.9% versus the prior build; we mention it because silent repricings are how backtests lose credibility. Costs matter too: the gate trades rarely by design, but UPRO's expense and financing drag are inside these numbers only to the extent the real fund's history carries them.
The interactive version with the full equity curve, drawdown chart, and current signal state lives on the strategy page (the interactive detail there sits behind the Pro tier, so to be clear: every number you need to evaluate the idea is in this post, and that is the point of this post). For the family it belongs to, browse the strategy catalog, and for why the gate behaves the way it does in fast versus slow crashes, read the event study.