RotationShield is a small tactical strategy from investir.blog, published at rotationshield.be. It was built for Belgian investors, and it holds one thing at a time: a US stock index fund, cash, or half of each. A French reader asked me if we had ever looked at it. They also wanted a test going back further than its own, which starts in 2008. We hadn't, so I ran it.
How it decides
At each month-end it checks 2 warning signals, which Keller and Keuning call canaries: emerging-market stocks (VWO) and US inflation-protected Treasuries (TIP). Each gets a momentum score called 13612W, a weighted mix of the last 1, 3, 6 and 12 months of returns. RotationShield averages that score over the month's last 5 trading days.
- Both scores positive: 100% S&P 500.
- One negative: half S&P 500, half cash.
- Both negative: 100% cash.
The canaries only give the signal, the strategy never holds them. In effect it's Keller and Keuning's Defensive Asset Allocation (DAA) cut down to the S&P 500, with TIP in place of DAA's bond canary.
Its own numbers check out
I ran it on our production data with our usual rules. It trades at the close of the signal day and pays 0.1% on what it trades. From March 2008 in dollars it made 11.20% a year, against 11.2% on the site. Its worst month-end fall was -16.0%, against -15.1% on the site. The S&P 500's was -46.3% in both. The small gaps fit what the site does differently: European funds, the Belgian tax on trades, and its own cash rate.
The years its backtest doesn't cover
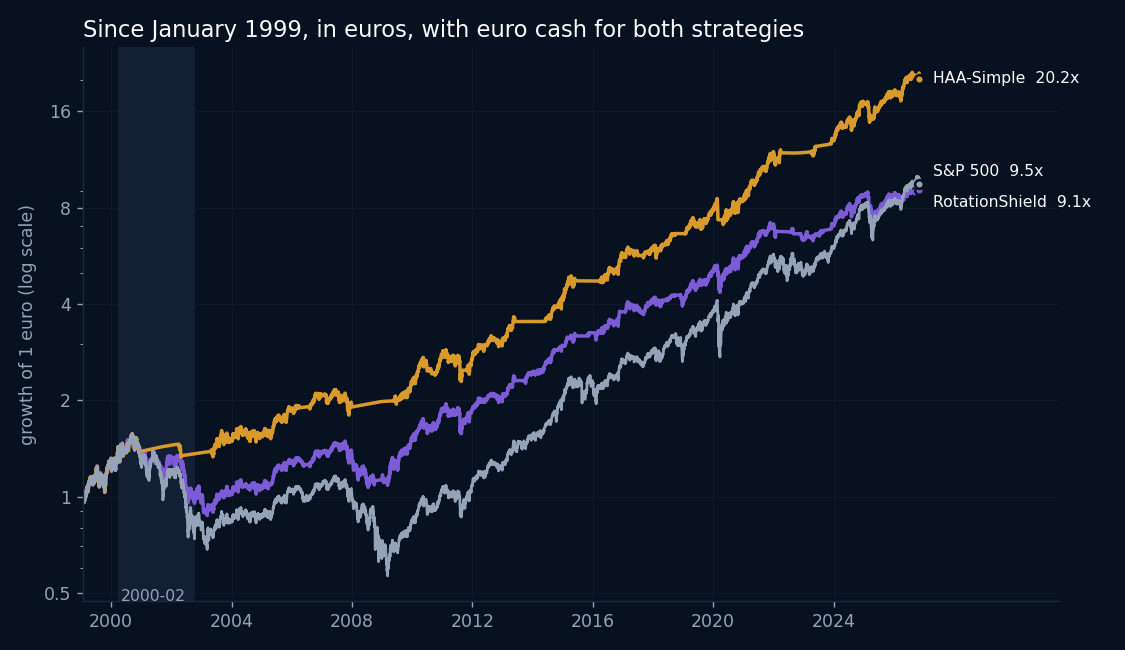
We have real daily prices for both canaries from 1998, through older funds: a PIMCO fund for TIPS and a Vanguard fund for emerging markets. So I could run the exact rules, 5-day average included, from January 1999. Here it is in euros, with euro cash for both strategies.
| January 1999 to 6 November 2026, in euros | Return a year | Sharpe ratio | Worst fall |
|---|---|---|---|
| RotationShield | 8.26% | 0.64 | -43.1% |
| S&P 500 | 8.44% | 0.51 | -64.0% |
| HAA-Simple, with the same euro cash | 11.43% | 0.97 | -20.3% |
Over nearly 28 years RotationShield made about what the S&P 500 made, with much smaller falls. HAA-Simple, the closest strategy in our catalog, did better on both.
Most of that gap opened in the 2000 to 2002 bear market. From March 2000 to October 2002, RotationShield lost 21% in euros, the S&P 500 lost 35%, and HAA-Simple gained 6%. Rates were falling, so TIPS rose through the whole bear market. The TIP canary stayed positive almost every month. Only the emerging-markets canary turned, so RotationShield never held less than half S&P 500.
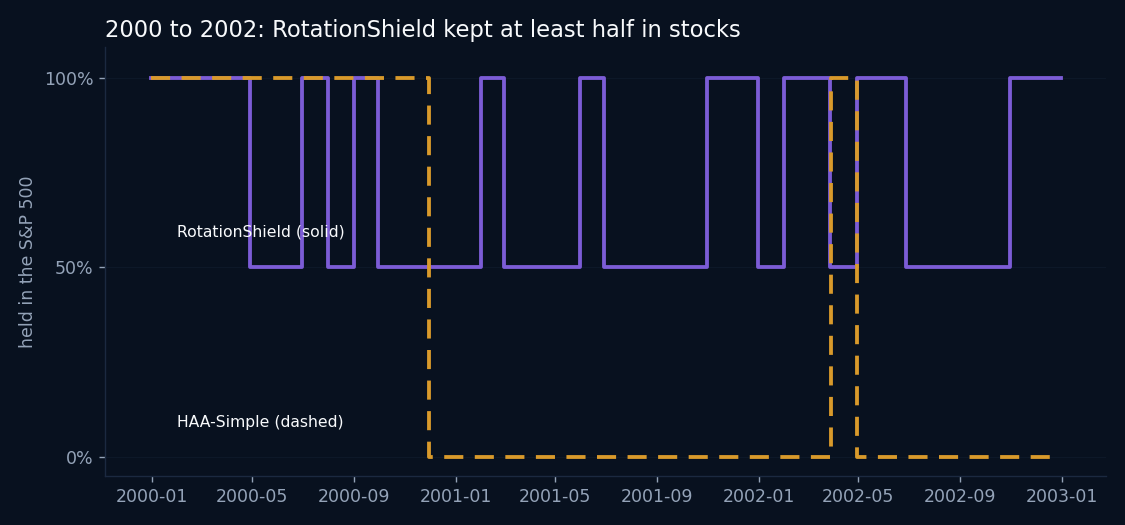
HAA-Simple reads the same TIP canary, but it also needs the S&P 500's own trend to be positive. That second rule took it out at the end of November 2000. It held no stocks at 22 of the 31 month-ends of the bear market.
So on paper the 2 look alike, and in practice they don't. Since 1999 they held the same S&P 500 share in only 57% of months, and their monthly returns in dollars correlate at 0.61.
Further back, with reconstructed data
Before 1998 for TIPS and 1994 for emerging markets, our price history is a monthly reconstruction, not a fund anyone could have bought. With the canaries read at month-end instead of averaged over 5 days, the strategy goes back to 1979 in euros. That version takes the same position as the original in 87% of months since 1999. From 1979 it made 11.25% a year with a worst fall of -46.1%. The S&P 500 made 12.59% with -64.0%, and HAA-Simple 14.30% with -27.7%, both strategies with euro cash.
In a PEA
For a French investor the design has a real advantage. The canaries are only signals, so the whole portfolio is one S&P 500 fund plus cash, and that fits in a PEA. PEA-eligible S&P 500 ETFs exist, all synthetic (they get the index return through a swap), for example Amundi PEA S&P 500 (FR0011871128) and BNP Paribas Easy S&P 500 (FR0011550185).
Cash in a PEA earns nothing. Since 1999 that takes RotationShield from 8.26% to 7.84% a year, with a worst fall of -44.9%. HAA-Simple held the same way, S&P 500 or cash at 0%, made 10.71% with a worst fall of -22.4%.
Why it goes to the rejection log
RotationShield does what its site says, and since 1999 it beat the S&P 500 on risk. That isn't enough for a place in our catalog. 2 strategies we already publish did better on both return and risk over the same dates. In dollars from January 1999, RotationShield made 8.95% a year with a worst fall of -33.7%. Over the same dates HAA-Simple made 10.71% with -20.1%, and DAA-G12 made 10.29% with -19.5%. Adding it would give you a weaker version of something already there.
So it goes into our rejection log, with these numbers. Thanks to investir.blog for publishing its rules clearly enough to reproduce.
How we tested it
- Our production engine and price data, from the end of January 1999 to 6 November 2026, and from 1979 for the month-end version. Trades at the close of the signal day, 0.1% on each trade, no taxes and no Belgian trading tax.
- Canaries read on the US funds in dollars, the S&P 500 through SPY with dividends. Before the ETFs existed, TIPS come from PIMCO Real Return (from 1998) and Vanguard's TIPS fund, and emerging markets from Vanguard's emerging-markets index fund (from 1994) and EEM.
- Where the site is silent, I used lookbacks in calendar months and counted a score of 0 or less as negative, as our DAA does. Lookbacks in trading days give the same position in 97% of months.
- Euros: each day's dollar value at that day's exchange rate. Euro cash earns overnight euro rates, PEA cash earns 0%. HAA-Simple's euro and PEA rows replay its published signals with its Treasuries and T-bills replaced by that cash.
Backtests are hypothetical and include no taxes. Past returns do not predict future ones.