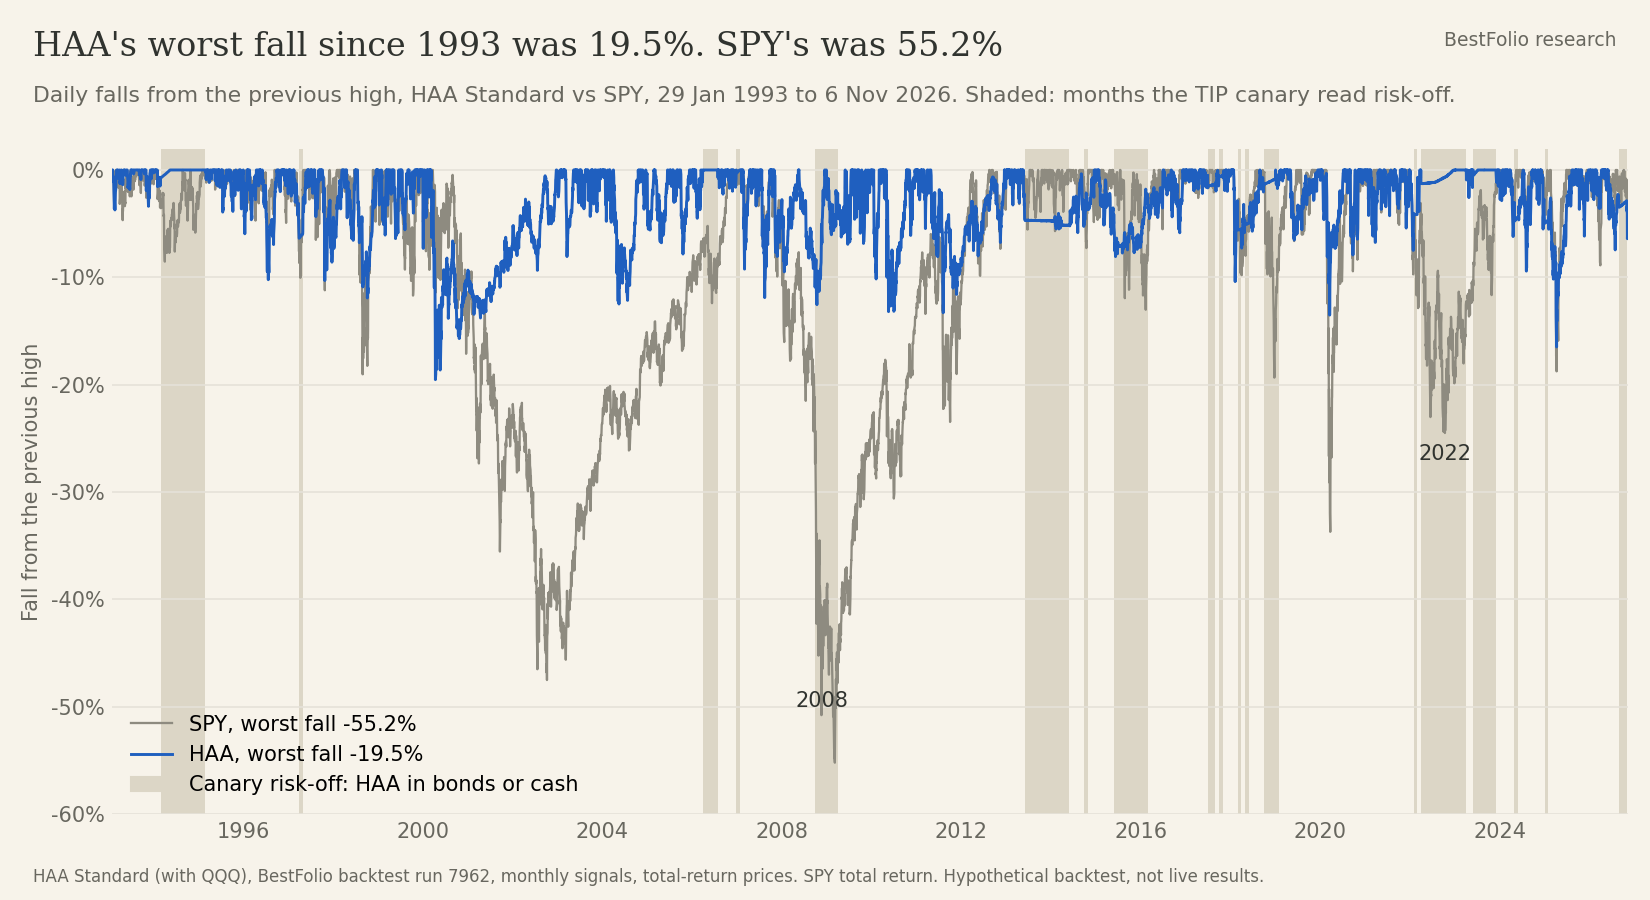
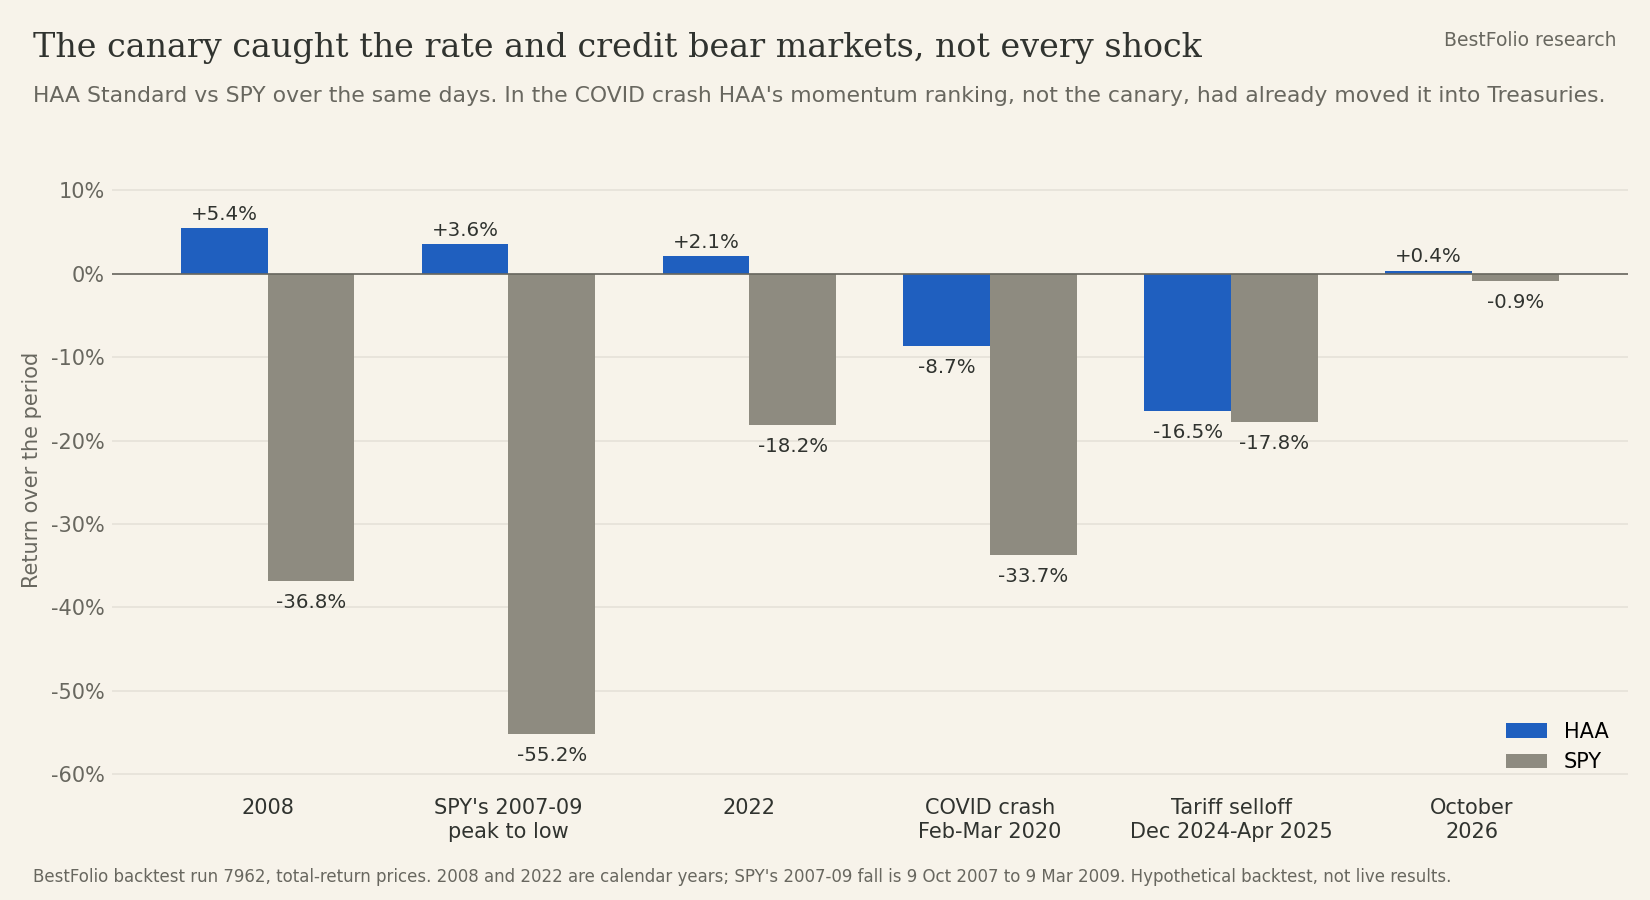
Since January 1993, the earliest date we have SPY's daily prices, HAA made 13.9% a year with a worst fall of 19.5%. SPY made 10.7% a year on the same days, and fell 55.2% at its worst. Much of that difference was made in 2 years. In 2008 HAA gained 5.4% while SPY lost 36.8%. In 2022 it gained 2.1% while SPY lost 18.2% and QQQ 32.6%.
The part of HAA that decides those years is its canary. HAA, the strategy by Wouter Keller and Jan Willem Keuning, watches one fund, TIP, the iShares fund of inflation-protected Treasuries. When TIP's momentum turns negative, HAA moves out of stocks, commodities and real estate into Treasuries or cash. This post looks at what that switch did in the bear markets, where it was late, and the one fast selloff it missed.
The rule
At each month-end, HAA adds up TIP's total return over the last 1, 3, 6 and 12 months. If the sum is above zero, the canary reads risk-on and HAA holds the 4 strongest of its 9 funds. Those are US large and small caps, developed and emerging markets, commodities, real estate, intermediate and long Treasuries, and QQQ. If it is below zero, the canary reads risk-off and HAA moves everything into whichever is stronger of intermediate Treasuries (IEF) and T-bills.
TIP falls when real interest rates rise. So the canary is a rates and credit signal, not a stock-price signal, and that explains both where it helps and where it doesn't.
2008: late, but before the worst of it
The canary read risk-off at the end of September 2008, 2 weeks after Lehman, and stayed there through February 2009. That is late, and it didn't need to be early. From the end of January 2008, HAA's own momentum ranking already held half the portfolio in Treasuries (IEF and TLT). The rest was in commodities and emerging markets. HAA's worst stretch of the crisis was a 12.5% fall from 21 May to 14 October 2008, mostly as commodities rolled over in the summer. The canary then moved everything into IEF for the October and November collapse.
From SPY's top on 9 October 2007 to its low on 9 March 2009, HAA gained 3.6%. SPY lost 55.2% and QQQ 51.6%.
2022: T-bills for 11 months
2022 was the bear market the canary was built for. Real rates jumped, and stocks and bonds fell together. The canary read risk-off at the end of January 2022, risk-on at the end of February, then risk-off at every month-end from March 2022 to February 2023. HAA sat in T-bills for most of the year. Its worst fall was 7.4%, in January, before the switch. Over the calendar year HAA gained 2.1%, against SPY's 18.2% loss and QQQ's 32.6%.
October 2026
The canary read risk-off at the end of August 2026, its first risk-off reading since December 2024, and again at the end of September. HAA spent September and October in T-bills. October was the month the AI trade cracked: QQQ lost 6.7% and SPY 0.9%, while HAA made 0.4%. At the end of October the canary turned risk-on again, and HAA went back into stocks and commodities. From the start of 2026 to 6 November, HAA is up 12.6%, against 8.7% for SPY.
What the canary doesn't do
It doesn't call market tops. TIP reads real rates, and stocks can be at a high when rates turn. Since TIP started trading in December 2003, the canary was risk-on at the top of 5 of the 7 SPY drawdowns I tracked. What it does is get HAA out once a rates or credit bear market is under way. Then it keeps HAA out while it lasts, as in 2008 and 2022.
It also lets fast shocks through, because a monthly rate signal can't react to a crash that comes and goes inside a few weeks:
- In the COVID crash, from 19 February to 23 March 2020, the canary stayed risk-on. HAA still fell only 8.7% against SPY's 33.7%. Its momentum ranking had moved three quarters of it into IEF and TLT at the end of February. HAA ended 2020 up 26.1%, against 18.4% for SPY.
- In the tariff selloff, from 4 December 2024 to 8 April 2025, the canary was risk-off for January 2025 only. HAA fell 16.5%, about as much as SPY's 17.8%, its worst fall since 2004.
So HAA has 2 defences. The momentum ranking moves it toward Treasuries when they lead, which caught 2020. The canary takes it out of everything risky when real rates turn, which caught 2008 and 2022. Neither catches every shock.
What else it reads: commodities
The canary's sharpest read is on commodities, which HAA holds through DBC's twin PDBC whenever they rank in the top 4. From December 2003 to September 2026, DBC averaged a 3.23% loss over the 12 months after a risk-off reading. After a risk-on reading it averaged a 9.23% gain. The gap holds at 1, 3, 6 and 12 months and survives taking out 2008 and 2022. Rising real rates tend to lift the dollar and tighten money, which is bad for commodities priced in dollars. So a risk-off reading also takes HAA out of the asset that has tended to fall next.
| DBC (commodities), Dec 2003 to Sep 2026 | Next 1 month | Next 3 months | Next 6 months | Next 12 months |
|---|---|---|---|---|
| After a risk-off month-end | -0.94% | -2.07% | -2.60% | -3.23% |
| After a risk-on month-end | +0.99% | +2.84% | +5.22% | +9.23% |
How to use it
HAA trades once a month, at the month-end close. The HAA strategy page shows the canary's current reading and the 4 funds it picks, so the whole routine is one check a month. The leveraged versions, HAA 2x and HAA-Simple 3x, use the same switch, and that is where it matters most. A 3x fund loses about 3 times as much in a fall, so being out of stocks in 2022 or October 2026 counts for more.
HAA Standard (with QQQ) from BestFolio backtest run 7962, monthly signals at the month-end close, total-return prices; SPY and QQQ are total return. DBC before February 2006 is the S&P GSCI index. Hypothetical backtests, not live trading results. Past results don't predict future ones.