In September I tested 700 settings of one of our strategies, the Momentum-Correlation Triplet, to see how much of its result came from picking good settings. The clearest finding was about picking itself. If you rank 700 settings on 2010 to 2021 and buy the winner, the winner does no better than a random setting from 2022 on.
On r/BestFolio, u/QuanTradin found the weak spot in that. One family holding up across a 700-setting grid could be luck about that family. If a different one, trend following against the rotation set, shows the same gap between the best pick and the median setting, the result is about grid search itself. That decides whether you can trust any "best settings" table. u/HBCTIA voted for the same test.
So I ran round 2 on GTAA, Meb Faber's trend-following strategy from 2006. Before the first backtest I wrote down the grid, the selection rule and the pass or fail rule. Then I logged a fingerprint of that text with a timestamp, so I couldn't adjust any of it after seeing results.
The gap and the decay show up again. In both families the best of 700 settings looks far better than the median on the years it was picked on. In the years after, that lead is gone. In the trend family the top of the table turned out to be a bond bet.
2 families that work in different ways
The Triplet is a rotation strategy. Each month it ranks 14 asset classes against each other on momentum, keeps the top 5, then holds the 3 of those that moved least alike. Everything depends on comparing assets with each other.
GTAA-5 never compares one asset with another. It holds 5 assets (US stocks, foreign stocks, real estate, 7-10 year Treasuries, commodities) at 20% each. Each one stays in while it is above its own 200-day average and moves to T-bills when it is not. That is plain trend following.
I also looked at VAA, the other candidate in the vote thread. It picks the single best of 4 assets on momentum, so it is a rotation strategy too. It couldn't tell "this family" apart from "grid search".
The same test, with 700 settings each
| Triplet (rotation) | GTAA-5 (trend following) | |
|---|---|---|
| Knob 1 | Momentum lookbacks, 10 sets | Trend window, 10 values from 3 to 18 months |
| Knob 2 | How many to rank, 4 to 8 | Trend rule, 7 versions (price vs average, exponential average, crossover, 12-month return, return above T-bills, Faber's monthly average, a half-and-half blend) |
| Knob 3 | How many to hold, 2 to 4 | Buffer before switching, 0% to 5% |
| Knob 4 | Correlation window, 3 to 24 months | Where the money goes when an asset is out: T-bills or 7-10 year Treasuries |
| Published settings | 3/6/12 months, top 5, hold 3, 1 year | 200 days, price vs average, no buffer, T-bills |
Every setting is one backtest from October 1987 to August 2026 in our production engine, at 10 basis points per trade. Every window below is cut from that one run. Sharpe ratios are above cash, as on the site since 18 October. I reran round 1's 700 Triplet settings on exactly the same basis, so the 2 families are compared like for like. Round 1's numbers moved a little (its median setting went from 11.42% to 11.16% a year) and its conclusions held.
The gap between the best pick and the median
| October 1987 to August 2026 | Triplet | GTAA-5 |
|---|---|---|
| Median of the 700 settings | 11.16% a year | 7.66% a year |
| Best of the 700 | 14.76% | 9.46% |
| Best minus median | 3.60 points | 1.80 points |
| Same gap, in standard deviations of the 700 | 3.28 | 2.47 |
| Published settings | 14.59%, rank 2 of 700 | 7.12%, rank 550 of 700 |
In points the trend family's gap is half the size, because its 700 settings sit closer together. Measured against each grid's own spread, the best setting sits 2.5 to 3.3 standard deviations above the middle. If you drew 700 independent random numbers, the largest would land about 3.15 standard deviations up. So the top row of each table is about where luck alone would put it.
One difference is worth noticing. The Triplet's published settings were 2nd of 700, which I said in September is what fitted settings look like from outside. Faber's GTAA settings rank 550th of 700, and 14 of the 20 settings one step away from them do better, all within 2 points. A sensible default doesn't have to be the top row.
Cheat on purpose, then measure the bill
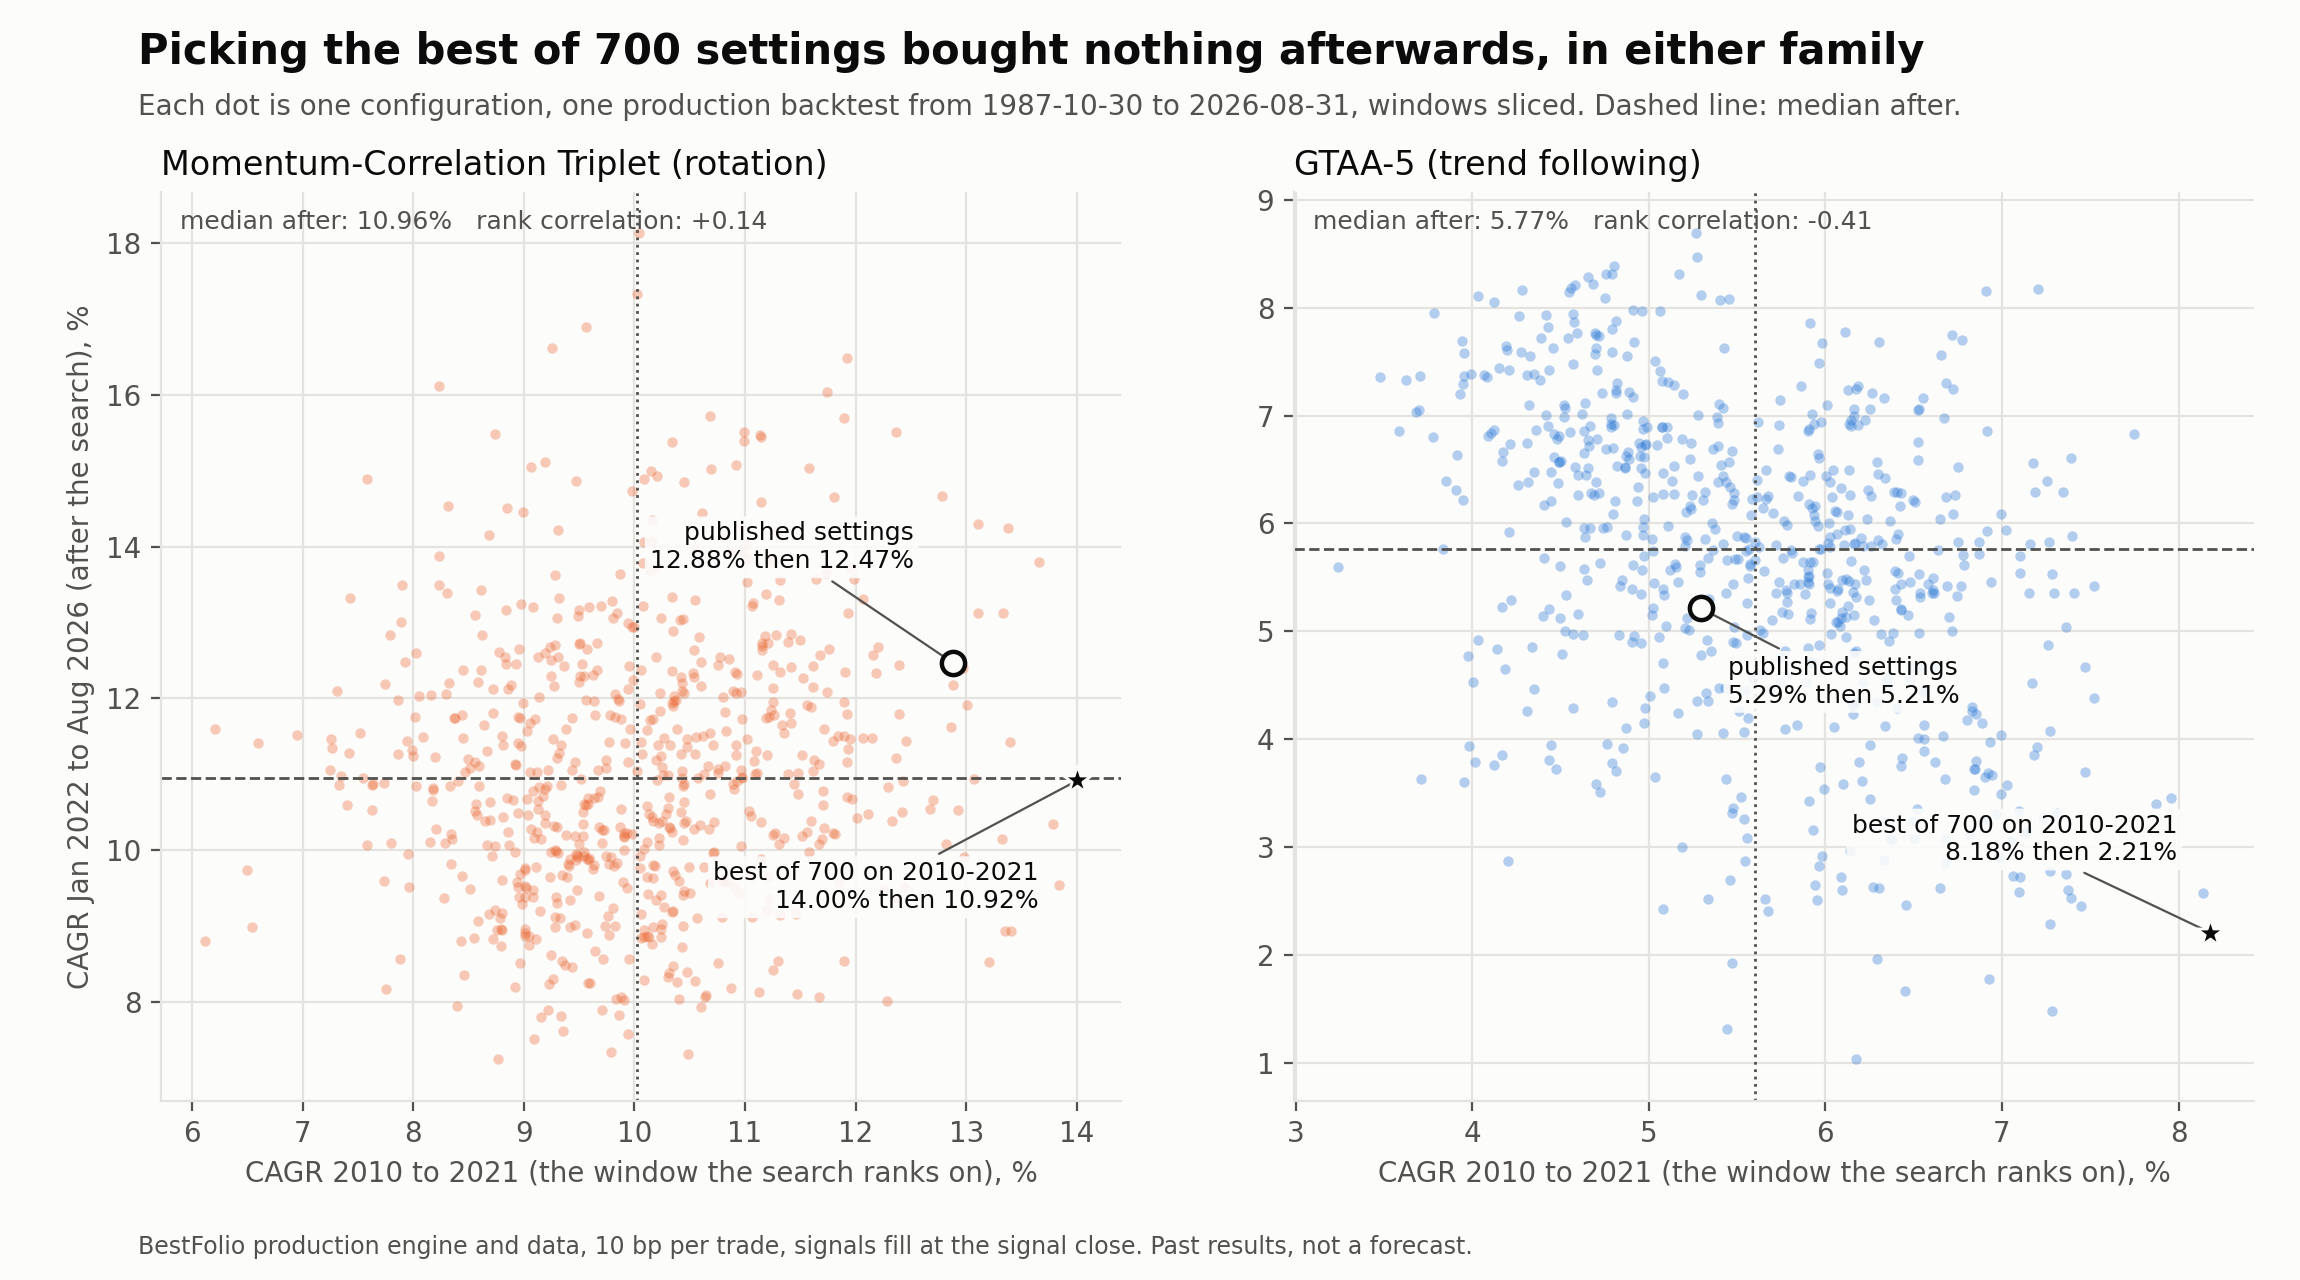
This is the test that matters for a "best settings" table. Rank all 700 settings on 2010 to 2021 only, take the winner, then see what it did from January 2022 to August 2026.
| Ranked on 2010 to 2021 | Triplet: 2010-2021 | Then 2022-2026 | GTAA-5: 2010-2021 | Then 2022-2026 |
|---|---|---|---|---|
| The winner of the search | 14.00% | 10.92% | 8.18% | 2.21% |
| Average of the top 10% | 12.46% | 11.63% | 7.20% | 4.35% |
| Median setting | 10.02% | 10.96% | 5.60% | 5.77% |
| Published settings | 12.88% | 12.47% | 5.29% | 5.21% |
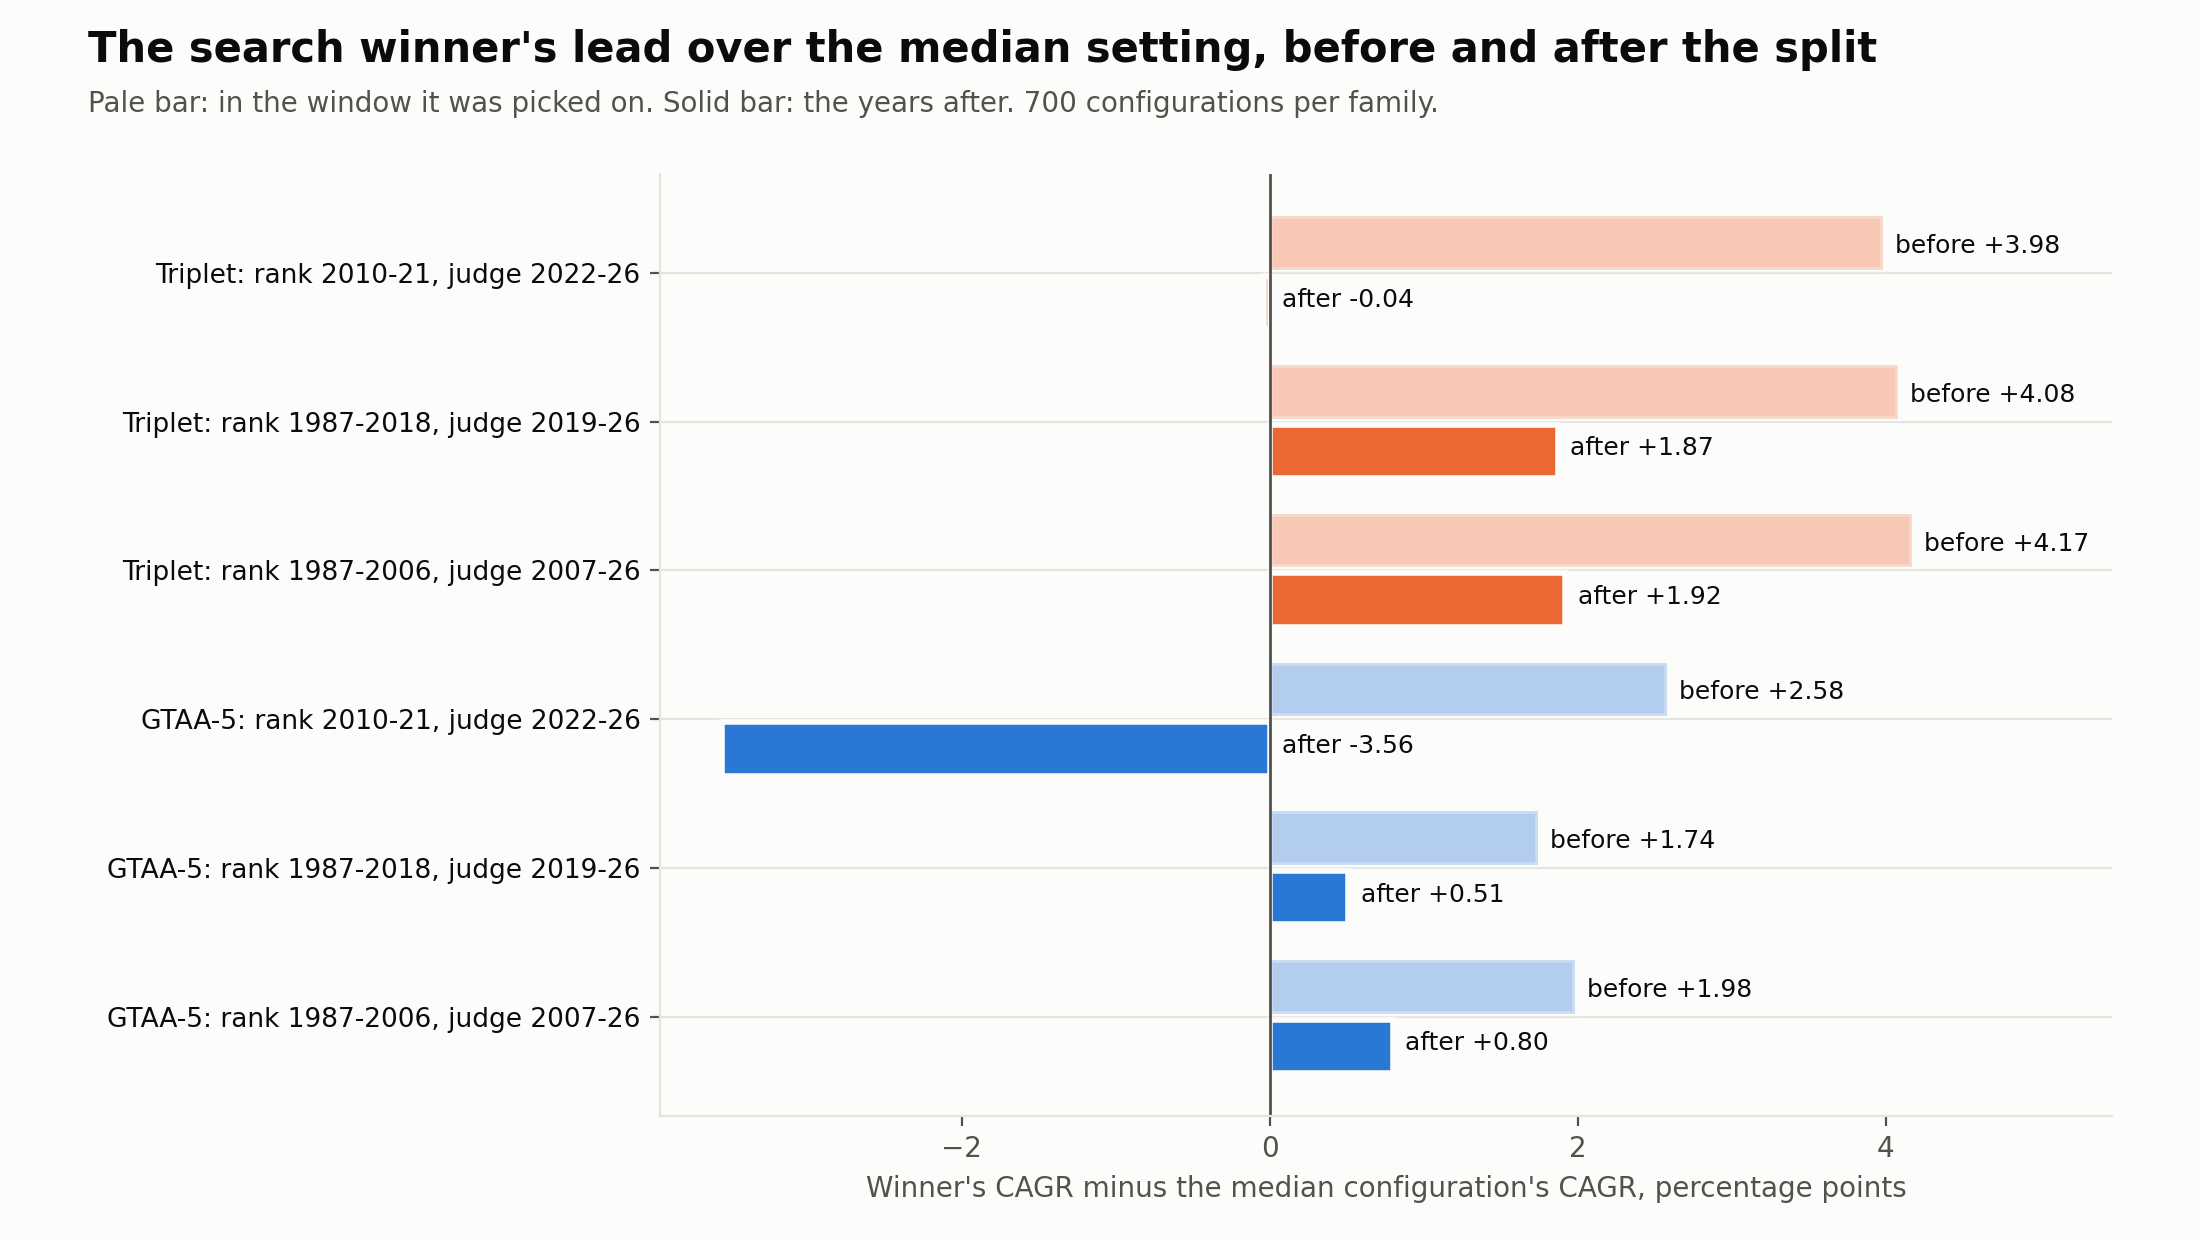
The Triplet's winner led the median by 3.98 points a year on the years it was picked on. Afterwards it trailed the median by 0.04 points and ranked 357th of 700. GTAA's winner led by 2.58 points, then trailed by 3.56 and ranked 693rd of 700. The rank correlation between the 2 periods is 0.14 for the Triplet and -0.41 for GTAA. So a setting's rank on 2010 to 2021 told you nothing useful about its rank afterwards, and for GTAA it pointed the wrong way.
I also ranked on 31 years (1987 to 2018) and judged on 2019 to 2026, the split round 1 used. With the longer window both winners kept part of their lead: 1.87 points of 4.08 for the Triplet, 0.51 of 1.74 for GTAA. Across all 700 the rank correlation was 0.05 and 0.11, close to nothing.
The top of the trend table was a bond bet
GTAA's winner didn't just regress to the middle. It fell to the bottom, and the reason is one knob. 66 of the top 70 settings on 2010 to 2021 sent the money from an out-of-trend asset into 7-10 year Treasuries instead of T-bills. Bonds rose through that whole decade, so that looked like the smart setting. In 2022 bonds fell with everything else. The winner lost 10.58% that year, against 7.70% for the median setting.
The search didn't find a better trend rule. It found a bet on falling interest rates and ranked it first. That's the same lesson HFEA taught in round 1: a strategy can fail because the regime it was fitted to ended, not because of noise.
So I had planned a second look, set down before the runs: the same tests on the 350 settings that always use T-bills. There the 2010 to 2021 winner did hold up. It made 8.17% from 2022 against 6.50% for the median, keeping 72% of its lead. I'd still not read much into it. The top 10% of that half made 6.47% afterwards, no better than the median. And when I ranked the same 350 on Sharpe instead of return, the winner ended in the bottom 8%. One winner got lucky twice, the ranking as a whole didn't carry over.
12,870 more ways to split the years
One split is one draw. So I also ran the cross-validated test from Bailey, Borwein, Lopez de Prado and Zhu. It cuts the 38 years into 16 blocks and tries every way of using 8 blocks to pick the winner and the other 8 to judge it, 12,870 splits in all. The share of splits where the winner ends at or below the median is the probability of backtest overfitting, PBO.
| Grid | PBO | Winner's average percentile afterwards |
|---|---|---|
| Triplet, 700 settings | 54% | 48th |
| GTAA-5, 700 settings | 28% | 65th |
| GTAA-5, T-bill half (350) | 47% | 51st |
For the Triplet and the T-bill half of GTAA, picking the best setting is close to a coin flip. The full GTAA grid looks better, and that's the part that should worry you. Its lower PBO comes from the same bond knob, which helped in most of the 38 years. A test built from past splits can't see a regime the past didn't contain. Here it would have made you more confident in exactly the setting that failed in 2022.
The deflated Sharpe ratio doesn't settle this either. It asks whether a Sharpe could be the luckiest of 700 tries. Every setting in both grids clears that bar easily (the luck line is about 0.28 for the Triplet and 0.24 for GTAA). So it tells you the family earns something above cash. It can't tell you which row of the table is best.
So, can you trust a "best settings" table?
By the rule I set before running it, the round-1 result holds for both families. The search winner kept less than half of its lead over the median afterwards, and the ranking didn't carry over. So it's about grid search, not about one strategy. The T-bill half of GTAA failed that rule, and I'm reporting it because the rule said I would.
What I'd take from it, for any table someone shows you:
- Expect the median row, not the top row. The top row's lead is mostly the luck of the search.
- Look at what the top rows have in common. If they share one choice, like bonds instead of cash, the table may be ranking a market regime rather than a rule.
- Prefer a setting whose neighbours all work over the single best one. Faber's 200 days rank 550th of 700 and every neighbour is within 2 points.
- A single holdout period is one draw, and a many-split test only knows the past. Neither proves much on its own.
What this does not show
2 families are still 2 samples, so this supports "it's grid search" twice and doesn't prove it. The grids are mine, and a different set of knobs would give different numbers. GTAA's extra knobs are study code built on our production GTAA. At the published settings they reproduce it exactly, but the other settings aren't strategies on the site. Before each fund existed (SPY in 1993, the others between 2001 and 2007), its history is reconstructed from older indexes. All of this is past data, and none of it is a forecast.
Thanks to u/QuanTradin for the question and u/HBCTIA for the vote.