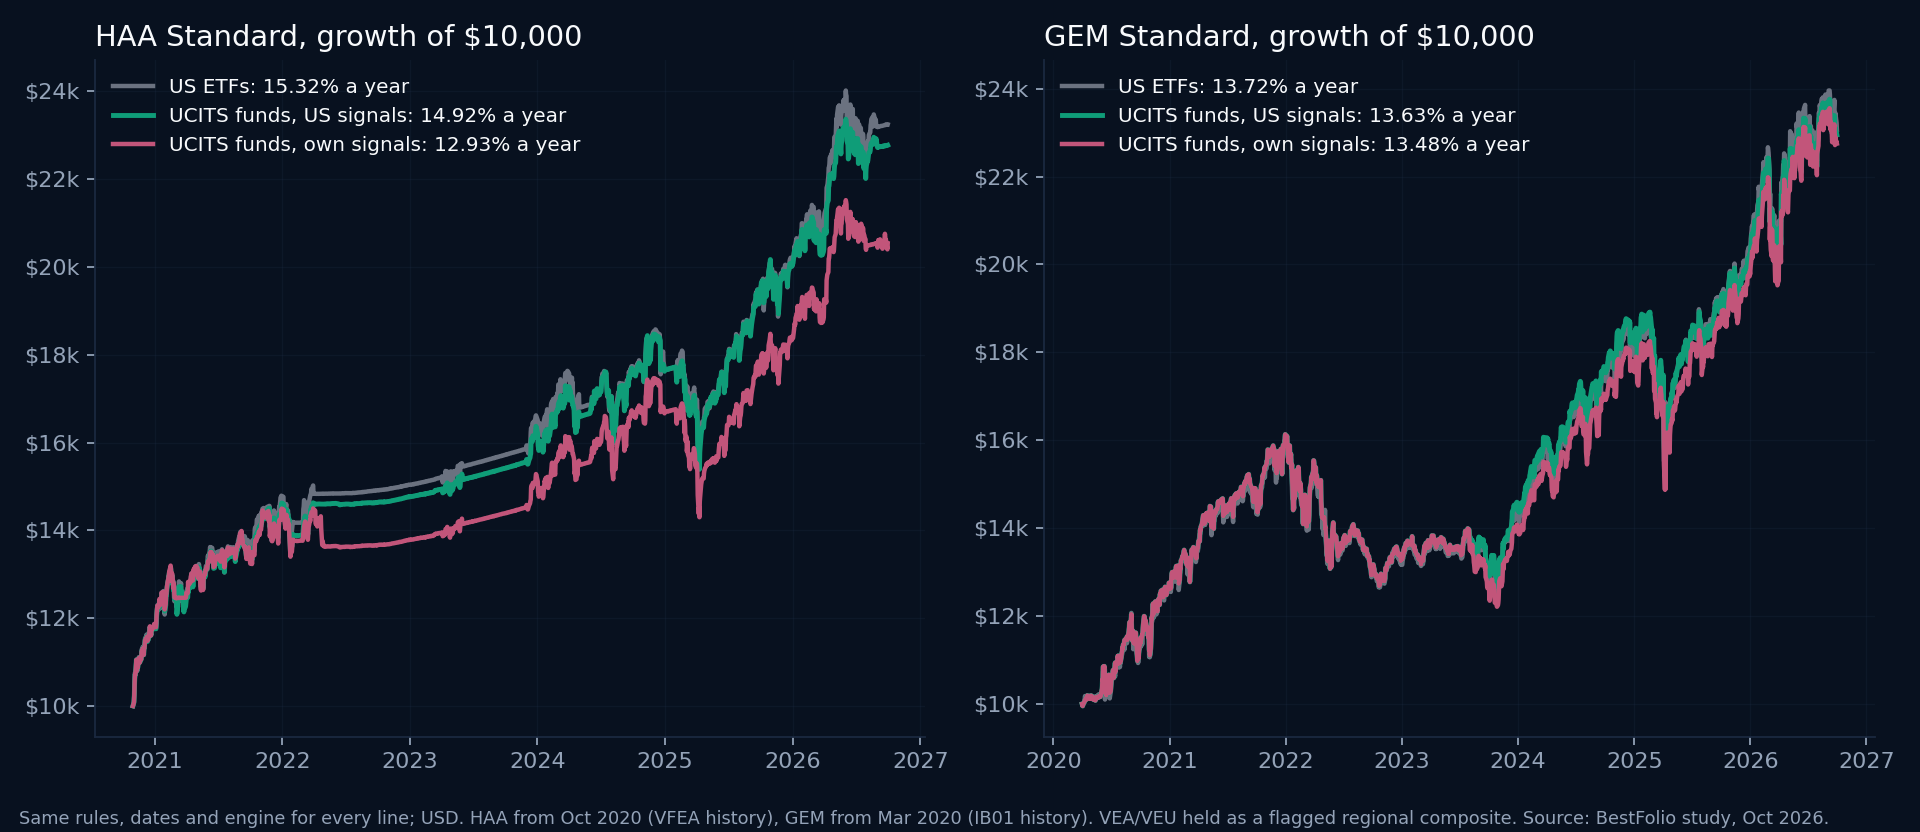
If you live in Europe, you can hold HAA and GEM with UCITS funds. Keep following the US signals and buy the European twin of each pick: over the 6 years where every twin has prices, that gave up 0.40 points a year on HAA (14.92% against 15.32%) and less than 0.1 point on GEM (13.63% against 13.72%).
Recomputing the signals from European prices costs more. HAA dropped to 12.93% a year. And if you compute HAA on prices in euros, it falls apart: 5.02% a year, because the canary ends up reading the euro-dollar exchange rate instead of US inflation-protected bonds.
This was option 1 in the "What should we test next?" thread on r/BestFolio. u/HBCTIA asked for it first ("especially for HAA, the most promising strategy of all at the moment") and u/confettofetti voted for it too. I built it the same way as the Triplet UCITS study from September.
What to do at a European broker
Follow the monthly signal on the HAA or GEM page, then buy the mapped fund for each pick. The UCITS Finder gives the ISIN, which is what your broker searches on. Check the listing currency: several of these funds trade in USD in London and in EUR on Xetra under different tickers. The HAA and GEM pages now say this in one line, with the measured cost.
2 legs have no clean twin with a long record: VEA and VEU (more below). Commodities and US property only have approximate twins.
The European funds
| US leg | UCITS fund used | ISIN | Mapping | Yahoo price history from |
|---|---|---|---|---|
| SPY | CSPX, S&P 500 | IE00B5BMR087 | exact | 2010-09-15 |
| QQQ | CNDX, Nasdaq 100 | IE00B53SZB19 | exact | 2010-09-15 |
| IWM | ZPRR, Russell 2000 (EUR line; R2US is the USD line) | IE00BJ38QD84 | exact | 2014-11-10 |
| IEF | CBU0, US Treasury 7-10 year | IE00B3VWN518 | exact | 2011-03-08 |
| TLT | DTLA, US Treasury 20+ year | IE00BFM6TC58 | exact | 2018-05-10 |
| AGG | IUAA, US Aggregate Bond | IE00BYXYYM63 | exact | 2017-04-13 |
| VWO | VFEA, FTSE Emerging Markets | IE00BK5BR733 | close | 2019-09-24 |
| TIP | IDTP, US TIPS | IE00B1FZSC47 | close | 2008-01-02 |
| BIL | IB01, US Treasury 0-1 year | IE00BGSF1X88 | close | 2019-02-20 |
| DBC (shown as PDBC on the card) | WCOA, WisdomTree Enhanced Commodity | IE00BYMLZY74 | approximate | 2016-04-27 |
| VNQ | IUSP, US Property Yield | IE00B1FZSF77 | approximate | 2009-01-02 |
| VEA, VEU | EXUS, MSCI World ex USA (backtest: regional composite) | IE0006WW1TQ4 | approximate | 2024-03-06 |
The window is set by the youngest fund: VFEA for HAA (prices from September 2019, so the first signal is October 2020 after the 13-month warmup) and IB01 for GEM (first signal March 2020). That is about 6 years, with 2022 in it. It says nothing about how these funds would have done in 2008.
The numbers
| Common window | CAGR | Worst fall | Sharpe above cash | Sortino above cash | Same picks as US |
|---|---|---|---|---|---|
| HAA, US ETFs (USD) | 15.32% | -16.48% | 1.15 | 2.63 | reference |
| HAA, UCITS funds, US signals (USD) | 14.92% | -16.68% | 1.14 | 2.49 | 71 of 71 |
| HAA, UCITS funds, US signals (EUR) | 15.52% | -20.26% | 1.24 | 2.40 | 71 of 71 |
| HAA, UCITS funds, own signals in USD | 12.93% | -18.14% | 0.91 | 1.79 | 53 of 71 |
| HAA, UCITS funds, own signals in EUR | 5.02% | -20.89% | 0.34 | 0.55 | 34 of 71 |
| GEM, US ETFs (USD) | 13.72% | -21.85% | 0.84 | 1.42 | reference |
| GEM, UCITS funds, US signals (USD) | 13.63% | -21.46% | 0.82 | 1.35 | 78 of 78 |
| GEM, UCITS funds, US signals (EUR) | 13.13% | -22.73% | 0.93 | 1.61 | 78 of 78 |
| GEM, UCITS funds, own signals in USD | 13.48% | -24.31% | 0.79 | 1.30 | 73 of 78 |
| GEM, UCITS funds, own signals in EUR | 12.98% | -22.73% | 0.91 | 1.56 | 73 of 78 |
Sharpe and Sortino are measured above the cash of the currency the result is in, the way the site does it: US T-bills (the BIL chain) for USD results, the euro overnight rate (€STR) for EUR results. Cash paid 3.06% a year in dollars over the HAA window and 1.71% in euros. That is why the EUR rows can show a higher Sharpe on a lower return.
Every line uses the site's own engine and the same cost model: signals fill at the month-end close, positions drift until the next signal, 0.10% per trade. As a check, my US runs matched the published HAA and GEM signals in every month of the window.
Why HAA flips and GEM barely does
GEM makes 2 comparisons: S&P 500 against T-bills, then S&P 500 against world ex-US, on 12-month returns. With twins that track their index closely, those comparisons rarely change. 5 of 78 months picked a different fund, all of them the US-versus-international call.
HAA ranks 9 assets on 4 lookbacks, keeps the top 4, swaps any negative one for bonds or cash, and gates the whole thing on TIP momentum above zero. Small differences in a fund's month-end price move it across a rank or across zero. 18 of 71 months came out different, and turnover went up from 3.38 to 3.96 a year (one way).
No single fund causes it. When I put only one leg on its European fund and left the rest on US ETFs, the commodity fund and the ex-US composite each changed 7 months, CSPX changed 5 (an exact S&P 500 twin, so that part is London closing hours before New York, plus fees), and TIPS and property 4 each. Same lesson as the Triplet: a top-N rule turns tiny price noise into different picks.
The euro trap: HAA's canary reads the exchange rate
This is the one to remember. If your broker shows everything in euros and you compute HAA's momentum on those prices, every return includes the move in the dollar. Ranking survives that, because all 9 assets get roughly the same shift. The canary doesn't, because it compares TIP with zero.
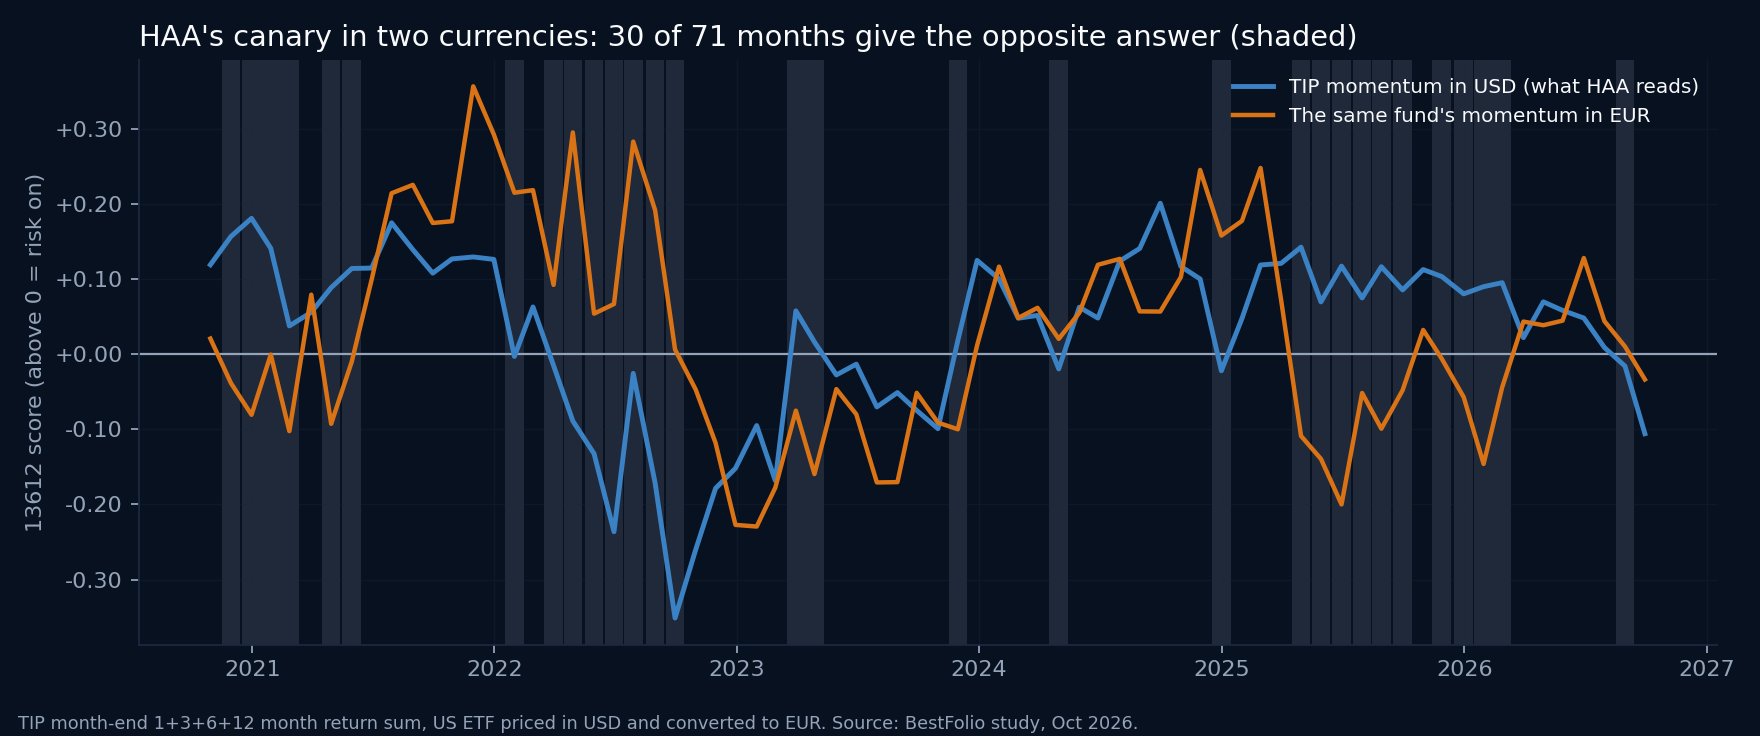
Over the window, the euro-dollar trend term averaged 0.122 in size, against 0.098 for TIP's own score. The shift in the euro score follows the exchange rate almost perfectly (correlation 0.999). So in euros the canary mostly tells you what the dollar did.
2022 is the clearest case. The dollar rallied, so TIP looked fine in euros. In April, July and August 2022 the euro-priced HAA held SPY, VNQ, DBC and IEF while the US signal sat in T-bills. With the European funds, the euro-computed version returned 5.02% a year against 15.52% for the US signals in the same funds, same currency. Repricing the US ETFs themselves in euros gives 3.86%, so the damage comes from the currency of the calculation.
GEM is immune to this as long as the threshold stays T-bills: both of its comparisons are between prices in the same currency, so the dollar cancels out (78 of 78 months identical). Swapping the T-bill threshold for euro cash (XEON) does change it: 11 risk-on or risk-off calls flipped and the result fell from 12.98% to 12.83% in euros. Keep the US threshold.
The legs with no clean twin
VEA and VEU. The only mapped fund, EXUS (MSCI World ex USA), has prices from March 2024, I didn't find a developed ex-US UCITS fund with a long record, and the exact FTSE All-World ex US twin (VXUA) launched in August 2026. So the backtest holds a fixed mix of 4 regional iShares funds already in the mapping (Europe 58.4%, Japan 21.4%, Pacific ex Japan 11.4%, emerging 8.9% for VEA; 45.6 / 16.5 / 9.0 / 29.0% for VEU). I fitted the weights on 2014 to 2019 returns, before the test window, and froze them. Over the window they tracked VEA at 0.987 monthly correlation and VEU at 0.987.
That mattered for GEM. EXUS excludes emerging markets, and over its 30 months it trailed VEU by 2.43 points a year. So after this study the site maps VEU to VXUA, the Vanguard fund on VEU's own index, and that is the fund to buy when GEM says international. VXUA only has prices from August 2026, so portfolio backtests fill the months before with 73.5% EXUS and 26.5% EIMI, the index's developed and emerging weights. VEA keeps EXUS.
Commodities. The card shows PDBC, whose twin is WCOA. It tracked DBC with 0.904 monthly correlation and trailed it by 1.30 points a year. The other candidate, ICOM (Bloomberg Commodity), did a little worse: HAA with ICOM returned 14.66% with US signals.
US property. IUSP screens for dividend yield, VNQ does not. Correlation 0.952, 0.47 points a year behind.
HAA without QQQ
u/Decent-Possession465 holds this one, so I ran it too. US ETFs 13.66%, UCITS funds with US signals 13.35%, own signals in USD 12.03%, own signals in EUR 5.03%. Same picture.
Limits
- 6 years is short and the window is set by fund launch dates. No proxy history before them.
- VEA and VEU are a 4-fund composite, not one fund you can buy.
- Yahoo's adjusted prices stand in for total return on the distributing funds.
- No broker access, spreads, FX conversion fees or taxes are modelled. Fund fees are inside the prices.
So the practical answer for both strategies is the same as for the Triplet: use the site's signals and hold the twins. And if you rebuild HAA in a spreadsheet, score it on the dollar prices.