Can you hold the Momentum-Correlation Triplet from Europe? Yes: following its US signals with the mapped European funds returned 15.95% a year versus 16.68% for the US basket in our model. Recomputing the signals from European quotes returned 11.86%. The practical choice is to keep the US signal feed.
What to actually do at a European broker
Follow the monthly signals published on the strategy page and buy the mapped instrument for each pick. Use the UCITS Finder to identify it by ISIN, then check the listing currency. The signal chooses the sleeve; the mapping identifies its European holding. Confirm broker access, the available KID and dealing costs for your account.
The European basket
The 14 risky sleeves map to 13 instruments: 12 UCITS ETFs and 1 physical gold ETC, IGLN, which is UCITS-eligible. Confidence is the site's mapping label, not a tracking guarantee.
| US sleeve | European instrument | ISIN | Confidence |
|---|---|---|---|
| SPY | CSPX, S&P 500 | IE00B5BMR087 | exact |
| QQQ | CNDX, Nasdaq 100 | IE00B53SZB19 | exact |
| VNQ / RWX | IWDP, developed property | IE00B1FZS350 | close |
| IEF | IBTM, Treasury 7-10yr | IE00B1FZS798 | exact |
| TLT | DTLA, Treasury 20+yr | IE00BFM6TC58 | exact |
| TIP | ITPS, US TIPS | IE00B1FZSC47 | exact |
| VGK | IMEA, MSCI Europe | IE00B4K48X80 | close |
| EWJ | IJPA, Japan IMI | IE00B4L5YX21 | close |
| SCZ | WSML (IUSN), world small cap | IE00BF4RFH31 | close |
| EEM | EIMI, EM IMI | IE00BKM4GZ66 | close |
| BWX | IGLA, global government bonds | IE00BYZ28V50 | approximate |
| DBC | ICOM, broad commodities | IE00BDFL4P12 | close |
| GLDM | IGLN, physical gold ETC | IE00B4ND3602 | exact |
Cash is additional: BIL maps to IB01, ISIN IE00BGSF1X88, labeled exact.
Keep the US signals: a 0.74-point annual gap
We ran US-generated signals through the European basket over the same 6.42 years. Its 15.95% CAGR tracked the US basket's 16.68% within 0.74 percentage points a year. We calculate gaps before rounding the displayed returns. That is the useful result for a European holder: the mapped twins tracked the chosen sleeves closely in this sample.
Recomputing from European quotes lost 4.8 points a year
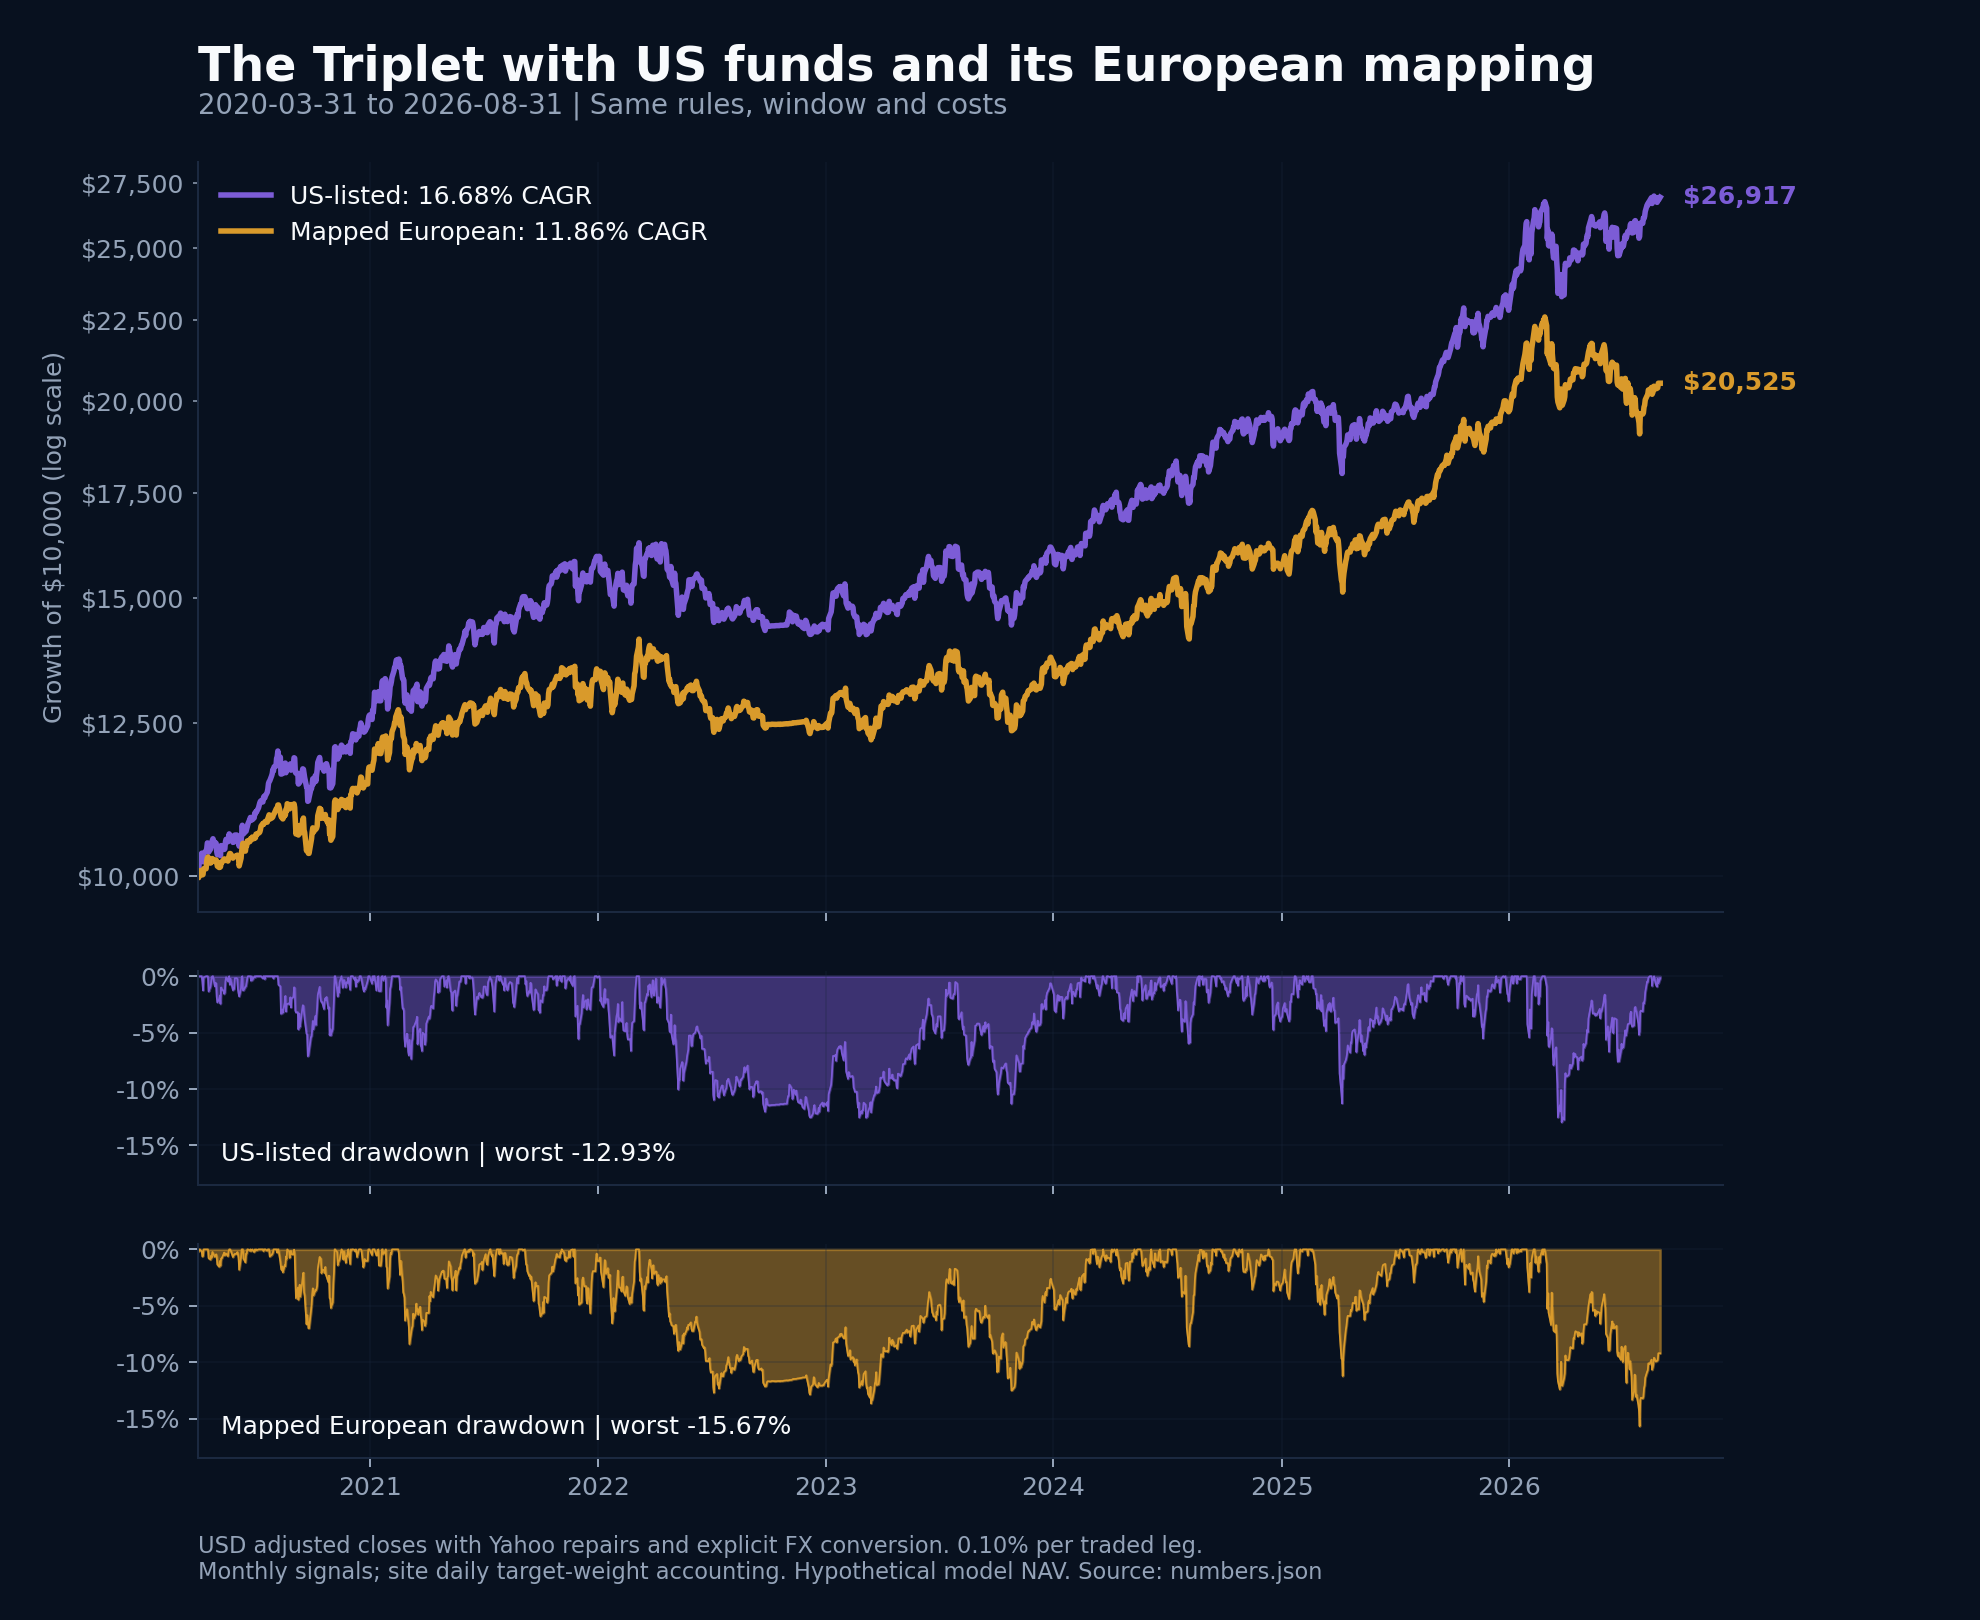
We also ran the original selection code on European prices, with the same window, monthly dates and costs. CAGR fell to 11.86%. The table compares US signals, US funds; European signals, European funds; and US signals, European funds. The charts show the recomputed-signal comparison.
IB01 sets complete coverage at 2019-02-20; the shared warmup skips 13 monthly buckets. Performance runs from the initial signal on 2020-03-31 to 2026-08-31: 6.42 years, 77 invested months. The initial COVID crash informs decisions but falls outside measured performance.
| Common-window metric | US signals, US funds | European signals, European funds | US signals, European funds |
|---|---|---|---|
| CAGR | 16.68% | 11.86% | 15.95% |
| Annualized volatility | 12.98% | 11.96% | 11.71% |
| Sharpe, own cash benchmark | 1.03 | 0.75 | 1.07 |
| Maximum drawdown, daily | -12.93% | -15.67% | -12.25% |
| Maximum drawdown, month-end | -10.85% | -13.15% | -11.40% |
| Worst complete year (2022) | -9.39% | -7.38% | -7.00% |
| Terminal multiple | 2.69x | 2.05x | 2.58x |
| Rebalance reviews | 77 | 77 | 77 |
| Reviews that changed targets | 48 | 53 | 48 |
| Average held funds, including cash | 2.90 | 2.88 | 2.90 |
| Annualized turnover, half traded notional | 3.19x | 3.56x | 3.19x |
At month-end, we average 3-, 6- and 12-month returns, require assets to beat cash, keep the top 5 and choose the least-correlated 3 over 252 daily observations. Each slot gets 33.33%; unused slots hold cash. Original ties and rounding apply; weights activate next session.
All 3 slots matched in 31 of 77 months (40.3%); 2 matched in 33 (42.9%), and 1 in 13 (16.9%). There were 0 months without overlap. We count mapped slots, including cash and duplicates; original sleeve identities give the same full-agreement rate.
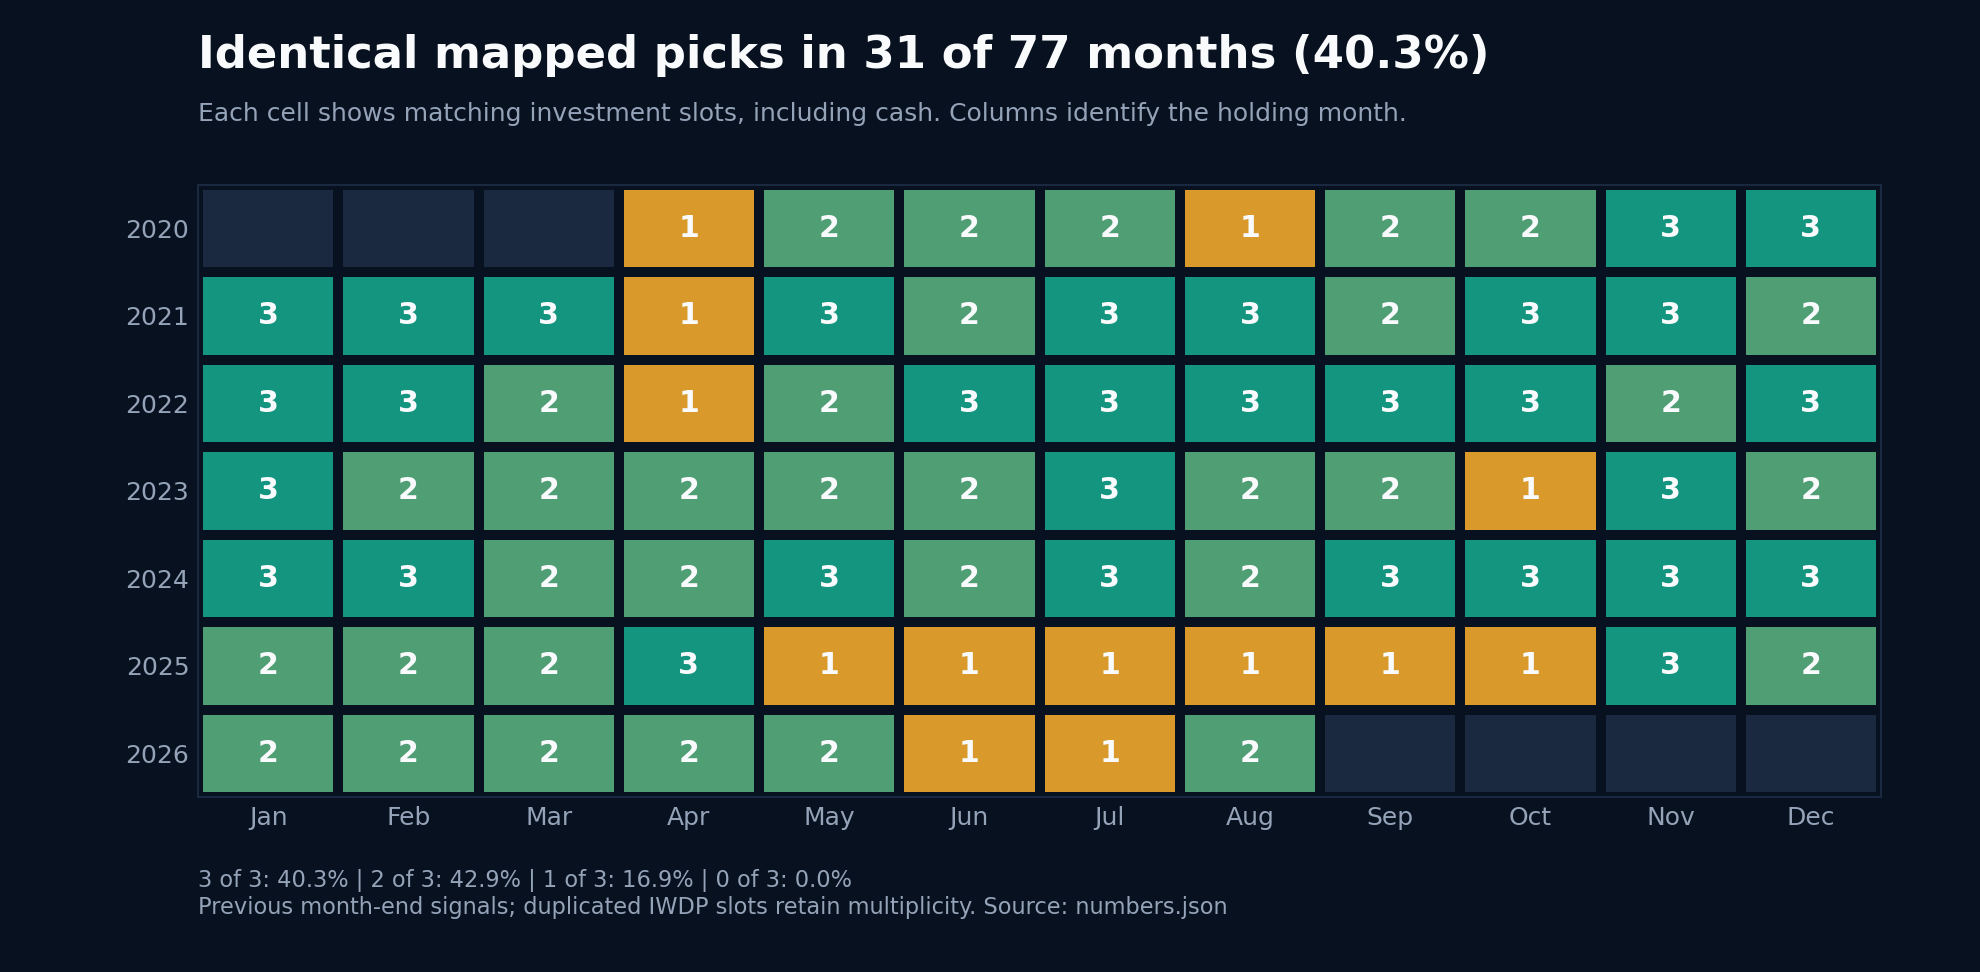
Small quote differences can flip this discrete selection rule. Switching 3 funds to their USD lines, IDWP, IDTM and IDTP, keeps the same ISINs but changes 8 decisions and lifts recomputed CAGR to 13.98%. Close-time and FX-fixing noise can change picks without changing fund exposure.
We converted IBTM and ITPS from GBP, IWDP from pence and IMEA from EUR into USD, and used USD-listed WSML instead of EUR-listed IUSN. USD measurement leaves underlying currency exposure intact.
Different-pick months account for 4.67 points of the 4.83-point annual gap; identical-pick months contribute 0.04, cash 0.03 and costs 0.08. We link monthly log-return differences to CAGR, with 0 unrounded residual; displayed totals can differ through rounding. These groups include holdings' return differences, so they do not isolate selection's causal effect.
The mapping's structural compromises
VNQ and RWX both map to IWDP, labeled close: global developed property replaces separate US and international sleeves. Both occupied the top 5 in 11 months, crowding out another candidate, but were jointly selected in 0. Dropping RWX changes 4 allocations and lowers recomputed CAGR by 0.67 points to 11.19%.
BWX excludes US Treasuries; IGLA, labeled approximate, includes them. Dropping that sleeve changes 1 allocation and raises CAGR by 0.12 points to 11.97%. These deletion tests remove whole sleeves, so they cannot isolate geography's cost.
Other close twins also differ: WSML includes US small caps; IMEA uses MSCI instead of FTSE Europe; IJPA adds Japanese small caps; EIMI broadens emerging markets; ICOM supplies Bloomberg Commodity exposure through a swap.
We verified an Amundi global ex-US government bond fund, correcting the mapping's older note, but not enough history for this test; no cleaner ex-US property candidate was verified.
The honest limits
- IMEA.L has Yahoo history but is absent from the issuer's listing table, leaving its listing identity unresolved.
- We applied Yahoo's repair option to every fund, retained originals and cross-checked IWDP's corrected dividends against its USD line; vendor total returns lack independent reconstruction and repair heuristics can err.
- Daily target weights imply daily resets without extra trading costs, so holdings that drift between monthly trades will differ.
- We charged both legs 0.10% per bought or sold notional, including entry, while the site charges half that notional with stress scaling.
The longest complete US run without proxies starts 2019-07-31 and returns 16.91%, versus 17.02% from matching public NAV endpoints. Exact overlapping daily drawdown is unavailable; the site names GLD where our source uses GLDM, limiting reconciliation.
This short sample cannot establish the site's long, proxy-extended US history for Europeans. Holidays require carried-forward marks. Taxes, investor FX charges and broker execution are outside the model. These are modeled returns, not brokerage results.