Should a cautious portfolio hold less cash, or add an energy fund? A reader asked us to test both on Charles Gave's portfolio. Both changes looked better in the decade he tested, 2000 to 2008. Over the full history since 1972, neither made the portfolio better. Less cash added return only because it added risk. Energy paid off in 2 oil booms and cost money in between. This post builds the case step by step, starting with the portfolio itself.
The portfolio
Charles Gave is a French economist and a co-founder of the research firm Gavekal. His portfolio is a variation on Harry Browne's Permanent Portfolio. That's the old idea of holding a quarter each in stocks, long-term bonds, gold and cash, so that something is always working.
Gave's version holds 3 parts instead of 4:
- a third in cash (T-bills),
- a third in US stocks (the S&P 500),
- a third in either gold or long-term Treasuries, never both.
Once a year, in December, it picks between gold and Treasuries. It compares the price of gold with the price of long Treasuries. If that ratio is above its average of the last 7 Decembers, gold has been winning and the third goes to gold. If not, it goes to Treasuries.
That's a slow rule. Since 1972 it switched only 5 times and held gold about half the time. The version on our strategy page uses long Treasuries (TLT) and decides once a year. From January 1972 to October 2026 it returned 10.12% a year with a worst fall of 17.3% at month-end. The S&P 500 alone returned 11.04% with a worst fall of 50.8%. So it gives up about a point a year for a much smoother ride.
The reader's 2 ideas
u/MediumNeutral, a reader on r/BestFolio, proposed 2 changes:
- Less cash. Hold 25% cash instead of a third, and put the difference in stocks.
- An energy fund. His best mix holds 20% in the S&P 500, 20% in an energy fund (XLE), 20% cash and 40% in gold or Treasuries.
His evidence was 2000 to 2008, a decade when US stocks lost ground and cash did its job. He suggested a blog post rather than another strategy, since the cash question goes beyond Gave.
Step 1: his numbers check out
He tested on yearly data in a spreadsheet. We re-ran everything on our own monthly data, the same as the strategy pages. Every trade pays a 0.10% cost. Here are the real returns, after US inflation, for 2000 to 2008:
| 2000 to 2008, real return a year | His result (S&P 500 / total market) | Ours (S&P 500) |
|---|---|---|
| Gave's portfolio, a third in cash | 1.98% / 2.15% | 2.18% |
| Same with 25% cash | 1.42% / 1.71% | 1.68% |
| His energy mix: 20% S&P 500, 20% XLE, 20% cash, 40% gold or Treasuries | 4.7% / 4.84% | 4.96% |
| The S&P 500 alone | not tested | -6.03% |
Our numbers match his closely, and the direction is the same on every line. In that decade, less cash cost about half a point a year and the energy mix came out well ahead.
Step 2: one decade isn't enough
2000 to 2008 was an unusual decade: stocks fell, and oil prices soared. A change that wins there could be winning because of that decade. So we ran the same portfolios over the full 54 years, from January 1972 to October 2026. We also looked at each decade on its own.
Step 3: less cash means more stocks, and more risk
Over 54 years, 25% cash did earn more: 10.72% a year against 10.12%. But it also swung more. Its volatility, a measure of how much it moves month to month, went from 8.60% to 9.44%. Its worst fall went from 17.3% to 19.5%. That makes sense. Taking money out of cash and putting it in stocks raises the return and the risk together.
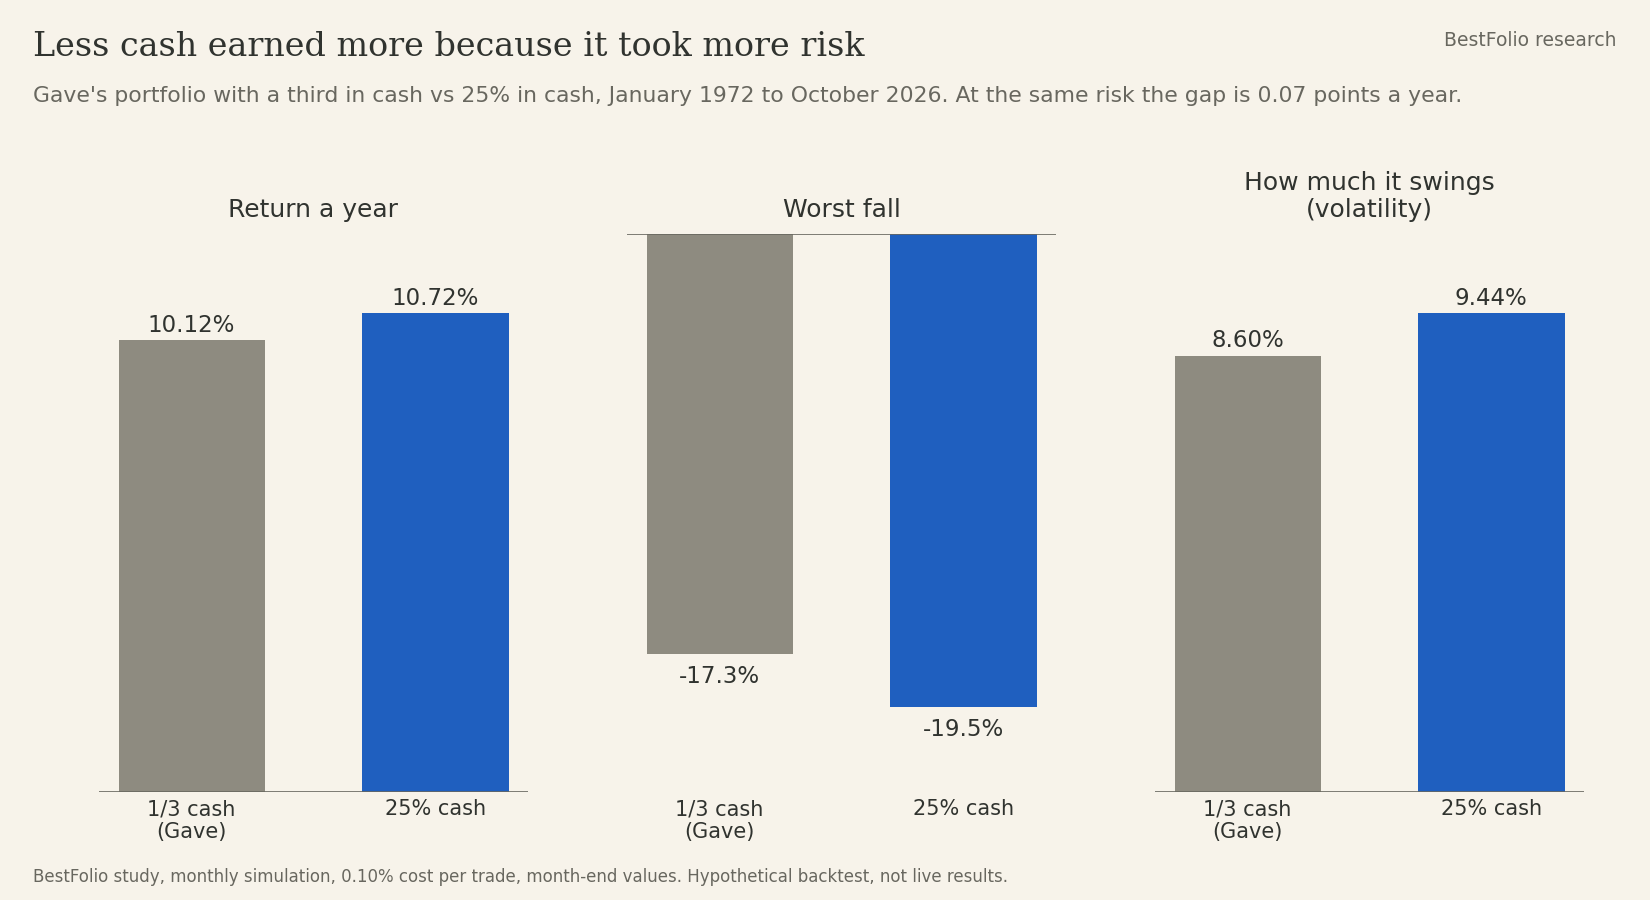
To see whether the change is actually better, compare the 2 at the same risk. Take the 25% cash version and set aside just enough extra cash next to it that it swings exactly as much as the original. The extra return then shrinks to 0.07 points a year from 1972, and to -0.02 from 1985. So nearly all of the extra return is the pay for holding more stocks. The design isn't better.
The reader's own measure tells the same story from another side. He looks at the highest yearly withdrawal, raised with inflation, that left you with at least your starting money after inflation in every 30-year period since 1972. Less cash raises it from 4.75% to 5.15%. If you can live with deeper falls, that's a fair reason to want less cash. You can get it without a new strategy: hold Gave's portfolio and put a little more into an S&P 500 fund next to it.
Step 4: energy only won in the 2 oil booms
His energy mix returned 11.19% a year from 1972, about a point more than Gave's portfolio. But it changes 3 things at once: less cash, a bigger gold-or-Treasuries slot, and the energy fund. To see what the energy fund itself adds, we ran the same mix with the S&P 500 in place of XLE. That no-energy mix made 11.17% a year. It also swung less (10.25% volatility against 10.68%) and fell less at its worst (23.5% against 30.0%).
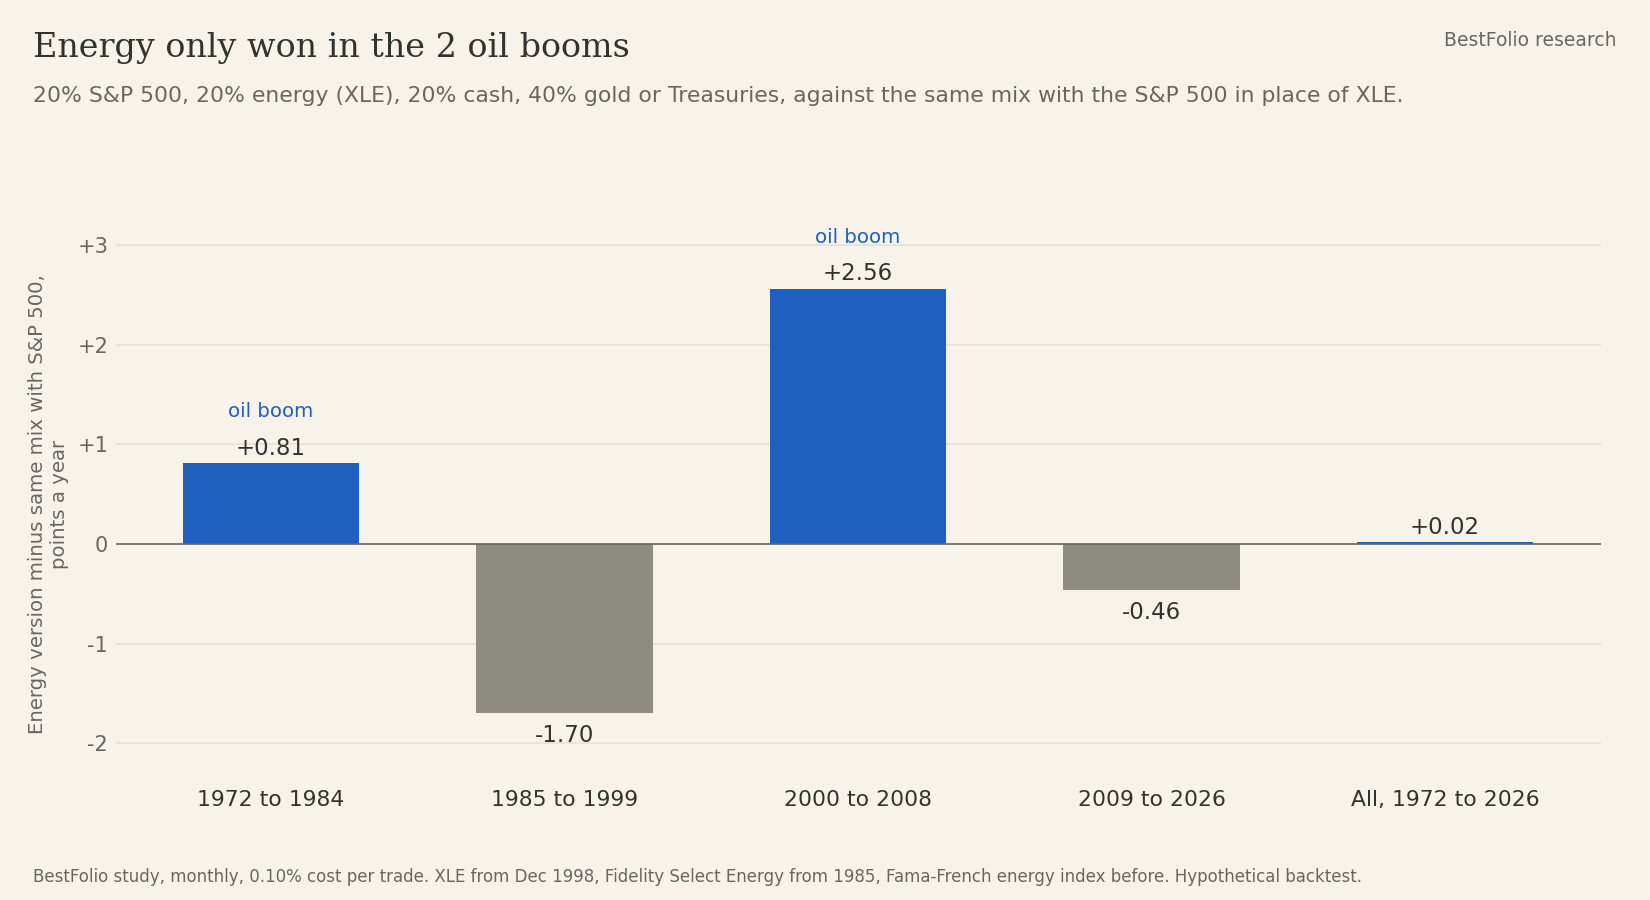
So the extra point came from the mix's shape, which again means more risk. The energy fund itself added 0.02 points a year. Decade by decade, it's clear where energy helped:
| Before inflation | Energy (XLE) a year | S&P 500 a year | Energy mix minus same mix with S&P 500, points a year |
|---|---|---|---|
| 1972 to 1984 | 12.83% | 8.61% | +0.81 |
| 1985 to 1999 | 9.48% | 18.62% | -1.70 |
| 2000 to 2008 | 8.16% | -3.66% | +2.56 |
| 2009 to 2026 | 9.64% | 14.68% | -0.46 |
| 1972 to 2026 | 10.10% | 11.04% | +0.02 |
Energy won the 2 oil booms, the 1970s and the 2000s, and lost the 2 decades in between. At the same risk it comes out behind: -0.24 points a year from 1972 and -0.53 from 1985. On the reader's withdrawal measure it also loses, 4.55% against 5.00% for the same mix without it.
2000 to 2008 happens to be energy's best stretch against the S&P 500 in all 54 years. That's why it looked so good there. Gave's portfolio already holds an inflation hedge in gold, so I'd only add energy with a specific reason to expect another oil boom.
What we're keeping, and what you can do
Gave's portfolio stays on our strategy page as it is, with a third in cash. We won't add a 25% cash version or an energy version, because neither is better at the same risk.
If you want more return and can accept deeper falls, the simple way is to hold the strategy and add a little S&P 500 next to it. That gets you the 25% cash result without changing the strategy.
Thanks to u/MediumNeutral for pushing on this. Both of his numbers were right; the question was what was behind them.
How we tested it
Monthly simulation from January 1972 to October 2026, on the same price chains as the strategy pages. In an earlier study it matched the live strategy cards to within 0.01 to 0.11 points a year. Gave's rule: TLT against gold on the average of their price ratio over the last 7 Decembers, decided each December, rebalanced yearly. 0.10% cost on every unit traded. XLE from 22 December 1998, Fidelity Select Energy (FSENX) from 2 January 1985, and the Fama-French 12-industry energy index before that. Cash is T-bills. "At the same risk" means each portfolio is mixed with T-bills, monthly, until its volatility matches the one it's compared with.
Hypothetical backtests on one country's history, not live results. Past results don't predict future ones.