Long bonds have had a terrible few years, and most of the commentary still treats high rates as bad news. For anyone who held them through the last bond crash, it was. For the next holder, it is the opposite. On 28 September the 30-year Treasury closed at 5.56%, its highest level since 2004, up from 4.77% a year earlier and 1.90% at the end of 2021. The price damage has been taken, and the income is there to collect.
This post is about why high rates are good news for long bonds and for the strategies that can hold them, and about the one idea that makes the case stronger than the yield alone: convexity. It is also about where the case breaks, because it does.
What 5.6% buys you
Three numbers set the scene, all from the Federal Reserve's data for 28 September. The 30-year nominal yield is 5.56% (FRED DGS30). The 30-year real yield, the return above inflation on inflation-protected Treasuries, is 3.28% (FRED DFII30), the highest since that series began in 2010. And the market's expected inflation over the next 10 years is 2.34% a year (FRED T10YIE).
Put together, a buyer of long Treasuries today locks a return well above expected inflation for decades. In 2021 the same buyer locked 1.90% nominal, below the inflation that followed. That difference is the whole story of the last 5 years in bonds, run backwards.
The starting yield is most of the return
The simplest fact about bonds is also the most useful one: over a long enough holding period, the yield you start with is roughly the return you get. I tested it on the 10-year Treasury back to 1953. The Fed's monthly yields (FRED GS10) let me rebuild the total return of a constant-maturity 10-year bond, coupons included. From 760 monthly starting points between 1953 and 2016, the correlation between the starting yield and the annual return over the next 10 years is 0.95.
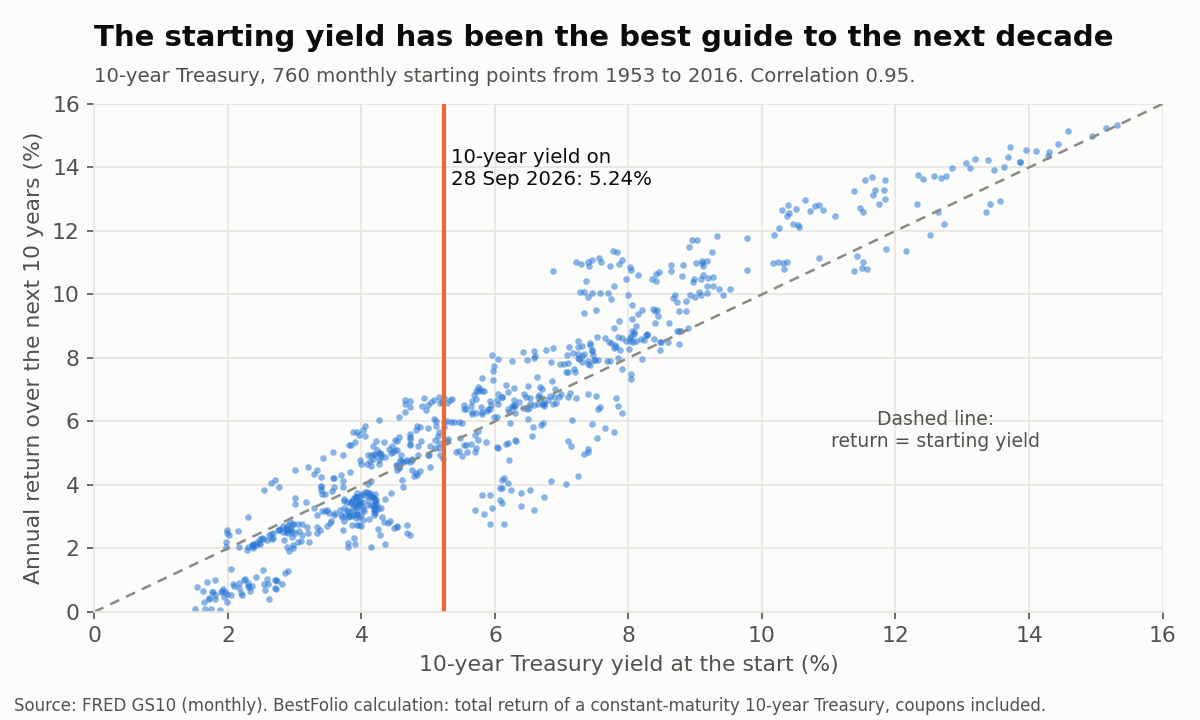
The 10-year yields 5.24% today (FRED DGS10). When it started between 5% and 6%, the next 10 years returned 5.9% a year on average, with a range of 2.8% to 8.1%. When it started below 3%, as it did for most of the 2010s, the average was 1.6% a year. Half the time, the realized return landed within 0.78 points a year of the starting yield.
There is a mechanical reason. If yields rise, the bond's price falls, but every coupon from then on is reinvested at the higher rate. Over a holding period close to the bond's duration, the two effects roughly cancel, so you end up near the yield you started with. Rising rates hurt the price and help the reinvestment. Falling rates do the opposite.
Convexity: why the next big move is tilted your way
Duration tells you how much a bond's price moves when yields move: roughly 1% for every year of duration per 1 point of yield. But that is a straight line, and the real relationship is curved. When yields fall, the price rises by more than duration says. When they rise, it falls by less. That curvature is convexity, and it grows with the square of maturity, so it matters most at the long end.
Take two funds that hold the long end. TLT holds Treasuries with 20 years or more to maturity. GOVZ holds STRIPS, Treasury bonds stripped of their coupons, 25 years and longer, so each one pays everything at maturity. That makes GOVZ close to a single 27-year zero-coupon bond, and zero-coupon bonds carry the most convexity per dollar. On 28 September iShares reported an effective duration of 14.78 years for TLT, a convexity of 3.10 and a yield to maturity of 5.61%. For GOVZ the same figures were 26.43 years, 7.13 and 5.62%.
Here is what that means over the next 12 months. The table assumes yields move at once by the amount in the first column. Each fund then earns its current yield for a year, fees deducted.
| Change in long yields | TLT, 1-year return | GOVZ, 1-year return |
|---|---|---|
| -2 points | +41.2% | +75.5% |
| -1 point | +21.8% | +35.8% |
| No change | +5.5% | +5.5% |
| +1 point | -7.8% | -17.7% |
| +2 points | -17.9% | -35.4% |
Look at GOVZ at plus or minus 1 point. A fall in yields returns 35.8%. The same rise costs 17.7%. Part of that gap is the yield itself, which lifts every row by about 5.5 points. The rest is convexity. At 1 point of yield change it adds 3 to 4 points to GOVZ, whichever way yields go, and at 2 points it adds 12 to 17.
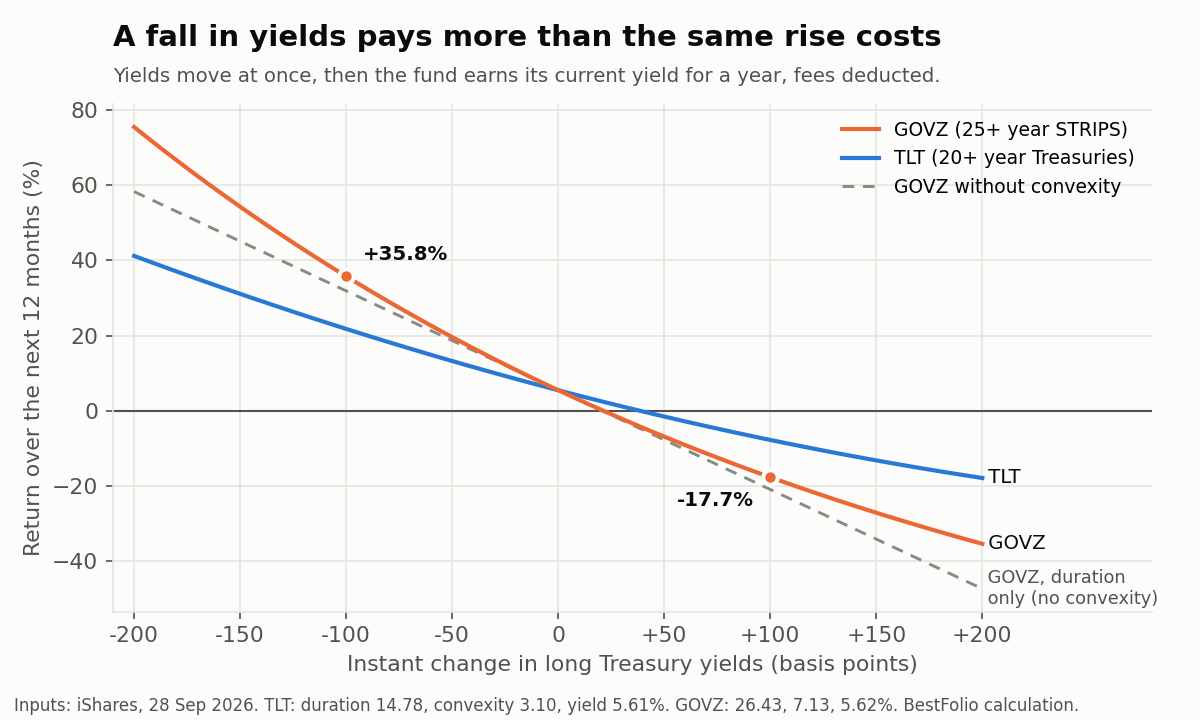
This is why I think today's level is good news for long bond holders, and not just a higher coupon. With yields at 5.6%, the pieces line up. There is a large income, a starting point that has historically predicted a good decade, and a payoff curved in the holder's favor. A recession, a drop in inflation or a flight to safety each tend to push yields down, and at this duration a move of 1 or 2 points is a very large gain.
Where the case breaks
Convexity says the payoff is tilted. It does not say which way yields go next, and 3 limits matter.
First, the income cushion is thin over a single year. TLT's yield covers a rise of about 38 basis points before the year's return turns negative. GOVZ's covers about 21. The long end can move that much in a few weeks.
Second, yields can keep rising for longer than anyone expects. The 30-year went from 0.99% in March 2020 to 3.97% at the end of 2022 and 5.11% in October 2023, and it is higher again today. In the 1970s, yields rose for most of a decade. If inflation comes back, or the market demands more to hold government debt for 30 years, a 2-point rise is not exotic. It would cost GOVZ more than a third of its value in a year.
Third, the starting-yield rule is a statement about holding periods close to the bond's duration: about 15 years for TLT and 26 for GOVZ. Over shorter periods the price moves dominate: a 1-point move in yields changes GOVZ's price by about a quarter.
How strategies can use this
About 4 in 10 strategies in our catalog can hold long Treasuries, in 2 very different ways.
Static portfolios hold them all the time. The Permanent Portfolio keeps 25% in long bonds, the Golden Butterfly keeps 20%, and the leveraged UPRO / ZROZ / GLD baseline keeps 25% in ZROZ, which holds long STRIPS like GOVZ. They collect the full 5.6% and the full convexity, and they take every rise in yields on the chin, as they did in 2022.
Tactical strategies hold them only when they earn their place. HAA, for example, holds its top 4 assets by momentum, which can include long Treasuries, and rotates to the best of bonds or cash when its TIP canary turns negative. A momentum rule will not buy long bonds at the start of a rally. It will usually be in them once yields have been falling for a few months, and out of them while yields climb.
Which one suits you depends on how much of that one-year range you can sit through. At 5.6%, both kinds of strategy start from the highest long-bond yield in more than 20 years.
This is an analysis, not a recommendation to buy any security. Scenario returns assume an instant parallel move in yields and the funds' reported duration, convexity and yield, and ignore changes in the shape of the curve. Past returns do not predict future ones.