Most tactical strategies in our catalog watch prices. Verdad Countercyclical watches the bond market's mood instead. Graham Infinger designed it in a pair of Verdad research notes in the spring of 2021, and it joined BestFolio in late October. This is how it decides, what our backtest says, and the 4 things its page tells you before you use it.
How it decides
At each month-end it compares 2 readings with their own median over the trailing 10 years. The first is the corporate credit spread: the Moody's Baa corporate bond yield minus the 10-year Treasury yield. The second is the slope of the yield curve, the 10-year minus the 1-year Treasury yield.
- Spread above its median: Growth. 50% S&P 500, 40% US small-cap value, 10% gold. Wide spreads mean investors are pricing in a recession, and the strategy buys exactly then.
- Spread at or below its median, flat curve: Inflation. 50% S&P 500, 10% small-cap value, 40% gold.
- Spread at or below its median, steep curve: Slowdown. 50% investment-grade corporate bonds, 40% 7-10 year Treasuries, 10% small-cap value.
The state holds for the whole month and changes about once a year. On top runs a daily trend rule: the S&P 500 or gold moves into 7-10 year Treasuries after 5 closes below its 200-day average and comes back after 5 closes above. All in, the book changes about 4 times a year.
What the backtest says
From January 1980 to October 2026, on our engine with 10 bps a trade, Sharpe ratios measured above cash:
| 1980 to Oct 2026 | Return a year | Sharpe ratio | Worst fall |
|---|---|---|---|
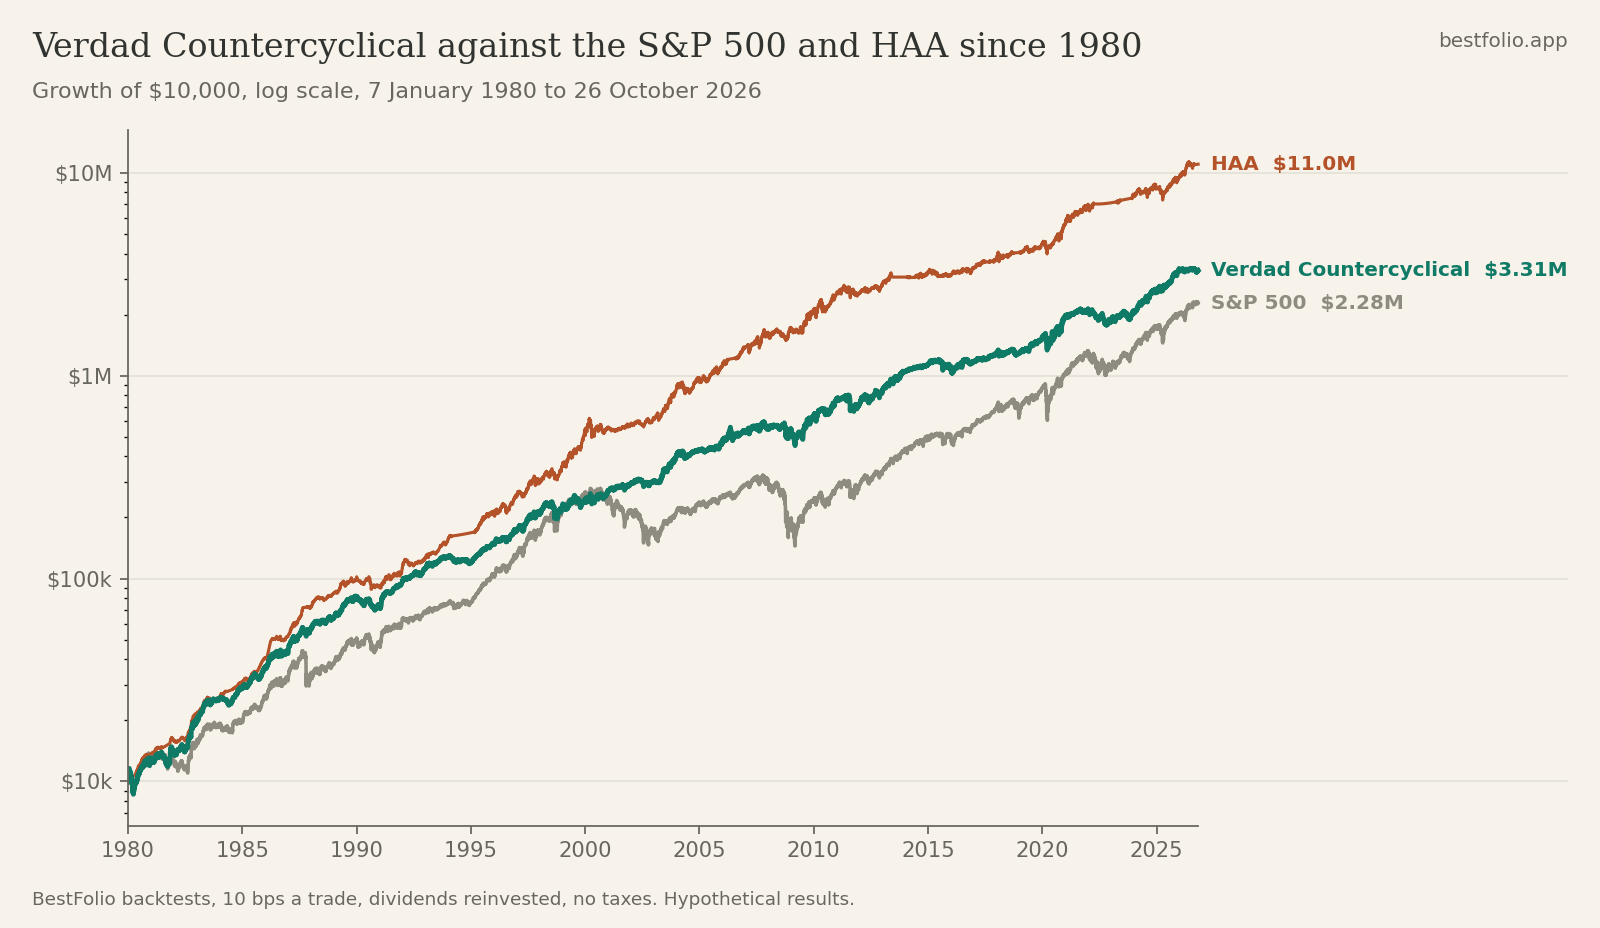
| Verdad Countercyclical | 13.2% | 0.83 | -25.5% |
| Hybrid Asset Allocation (HAA) | 16.1% | 1.10 | -19.5% |
| S&P 500 | 12.3% | 0.57 | -55.2% |
Against the S&P 500 the result is clear: a better return with less than half the worst fall, and a risk-adjusted lead that is statistically significant from 1980 and from September 2000. $10,000 in January 1980 grew to about $3.32 million, against $2.25 million in the index.
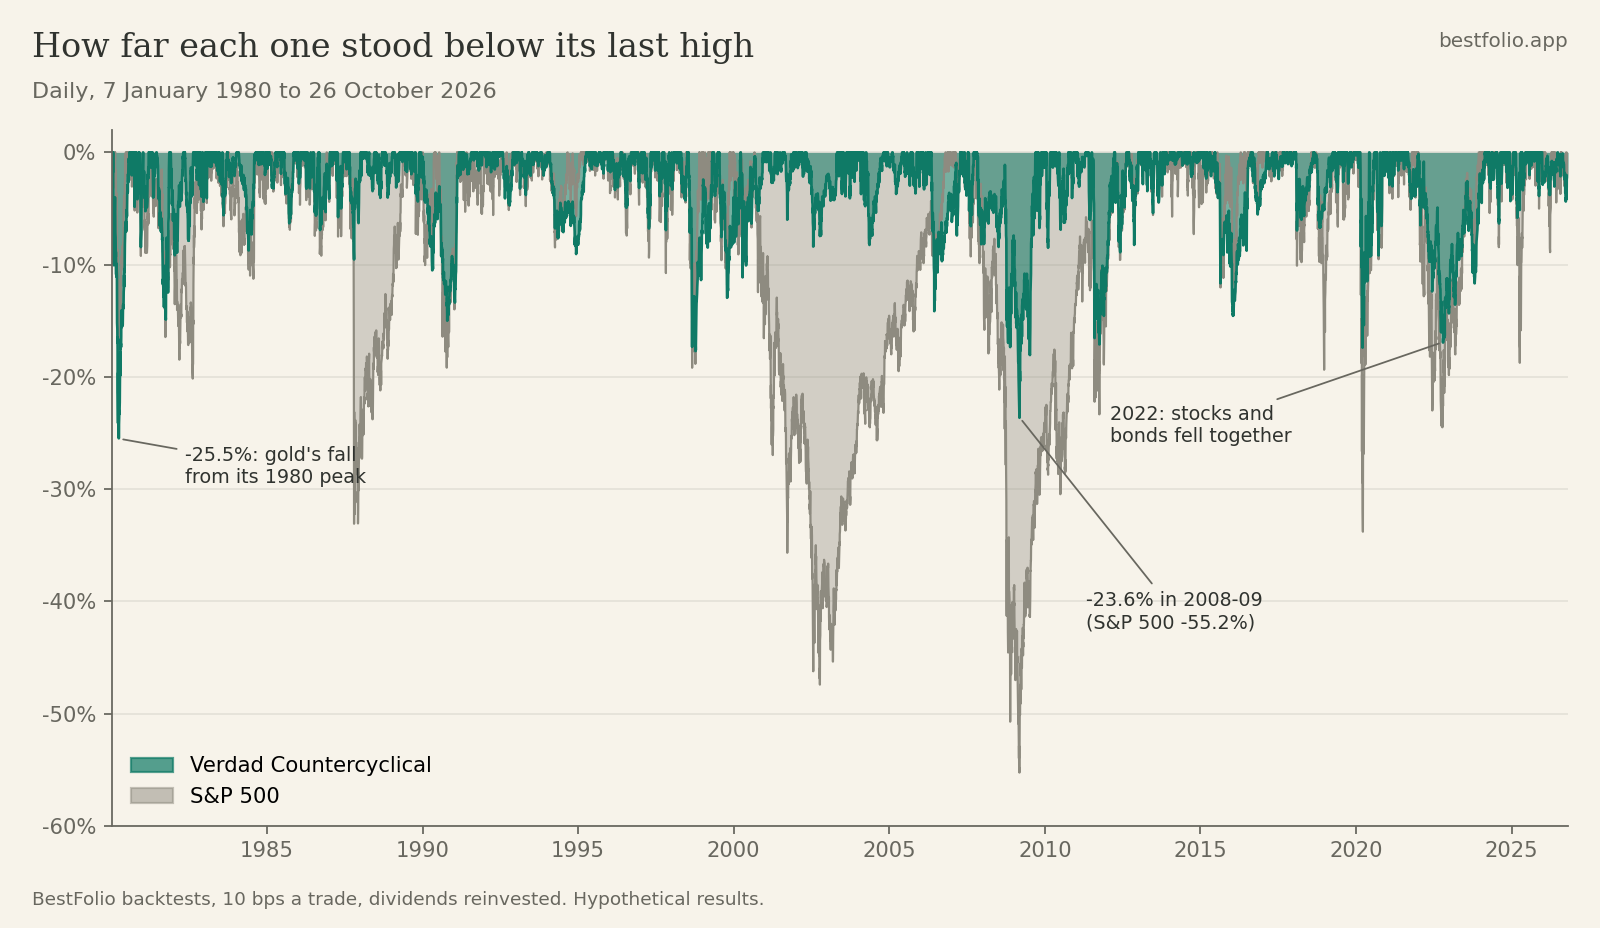
The worst fall of -25.5% came first, from January to March 1980, as gold fell from its January 1980 peak. In the 2008 crash it lost 23.6% from October 2007 to March 2009, while the S&P 500 lost 55.2%.
The rest of the story is why its page is unusually plain about its limits.
The 4 caveats
1. HAA does this job better. Hybrid Asset Allocation, already in the catalog, returned more, with better risk-adjusted returns, in every long window we tested from 1980, in dollars and in euros. Its risk-adjusted lead is not statistically significant since September 2000, but it is never behind.
2. The business-cycle switch is not proven. The trend rule carries the edge. Without it the same allocation had a Sharpe ratio of 0.67 and fell 49% from October 2007 to March 2009. Holding the same 5 funds at their average weights with the same trend rule, and no cycle signal at all, returned 11.2% a year with a Sharpe ratio of 0.70. The gap to the 0.83 here is not statistically significant, and since September 2000 the two are level (0.86 and 0.82). The credit-spread state added about 2 points of return a year: read it as a tilt, not as a proven way to time the cycle.
3. It lags strong bull markets, including since it was published. From May 2021, after Verdad's notes, to October 2026 it returned 9.5% a year against 13.0% for the S&P 500. It beat the S&P 500 in 20 of the 46 calendar years from 1980 to 2025 and trailed it through the 1990s and the 2010s. Verdad's own note warns that it lags when the index returns more than 15% a year.
4. It does not run on the spread its author describes. Verdad reads a high-yield spread, the ICE BofA US High Yield index spread, which FRED now serves only from September 2023. We use the Moody's Baa minus 10-year spread for the whole history as a long-history proxy. Where both exist the 2 spreads are only loosely correlated (0.54), over a window too calm to say how they compare in a crisis. Swapping in another long-history spread, Baa minus Aaa, moved the result by about 1 point a year.
One more thing worth knowing: the small-cap value sleeve is never trend-protected, and the Growth state, which wide spreads in a crisis switch on, holds 40% of it. That sleeve explains most of the 23.6% it lost in 2008 and 2009. And in 2022 the bonds it moves into fell with stocks, which makes 2022 its worst calendar year, at -13.6%.
Who it is for
It suits someone who wants a rule with an economic reason behind it, wants a much shallower worst fall than the index, and can live with trailing the S&P 500 in strong years. If you want the best risk-adjusted record in this family, HAA has it. A member asked us to build this one, and we did, with every caveat on its page.
The strategy page has the full rules, the data notes and the live signal for Pro members.
Backtested results are hypothetical and include no taxes. Past returns do not predict future ones. Figures from our backtests with data to October 2026; the 2 counterfactual versions (no trend rule, fixed average weights) are research reruns over the same dates and are not strategies we list.