The worst time to retire is just before a crash. You sell funds at low prices to pay your bills, and the shares you sold miss the recovery. Planners call this sequence risk: the same average return does much more damage when the bad years come first. Most advice for it is defensive. Hold more bonds, keep two years of spending in cash, spend less after a bad year.
Zack Hughes, who documents his own early retirement on his YouTube channel Zack Going FIRE, built a rule that does both. It cuts spending after a crash, as the defensive advice says, and it also buys more risk. He calls it the Trigger Ratchet. He sent it to us with his code and data and asked for an independent test. He also asked that the caveats come first when I published it, so they do. On corrected data, his own January 2000 example runs out of money. The trigger itself helped across US history, at the cost of very deep falls, and it failed in Japan.
The rule
The portfolio holds 13 funds. The three big ones are GPIQ (45%), a Nasdaq-100 fund that sells call options for income, and two bond funds: PYLD (15%), from PIMCO, and SCYB (15%), which holds high-yield bonds. The rest is small pieces: gold, long Treasuries, managed futures, international and US small-value stocks (5% between them) and TQQQ (5%).
TQQQ is a 3x leveraged fund: each day it aims to return three times the Nasdaq-100's daily move. It does that by borrowing, so it pays interest on twice its value.
The trigger watches the S&P 500 against its recent high:
- When the index closes 20% below that high, TQQQ goes from 5% to 10% and small value from 5% to 10%. The other funds are trimmed in proportion to pay for it.
- At 40% below, both go to 20%.
- Every quarter the two are topped back up to their target if they have fallen below it. They're never trimmed while the trigger is on.
- Everything goes back to the base weights when the S&P 500 makes a new high, or after 7 years, whichever comes first. After a 7-year exit, the next fall is measured from the highest close of the previous 12 months.
Spending follows the same index. Zack withdraws 7% of the starting value each year, raised with inflation. When the S&P 500 is 20% below its high the rate drops to 5%, at 40% below to 4%, and it only goes back to 7% at a new high. Each month's withdrawal is sold from whichever funds have grown above their target first, the way his broker, M1 Finance, handles a sale.
His backtest, rerun
Zack updated his rules while I was writing this, to sell each withdrawal the way M1 does, and this post uses the current version. I first ran his rules in our own simulator on his data and his stand-in funds, for the years before each fund existed. It reproduces his main result to within 0.04%: a retiree with $1M in January 2000, withdrawing 5% a year raised with inflation, still has $1.44M at the end of September 2026 and never missed a payment. So the rules are written clearly enough to test. Then I swapped in the data we would use, one fund at a time.
| Change, each on top of the ones above | Money left at the end of September 2026 ($M) | Missed payments (number) |
|---|---|---|
| His data and stand-ins | 1.44 | 0 |
| GPIQ: an option model instead of 0.56 x QQQ | 0.06 | 0 |
| SCYB: broad high yield instead of short-duration | 0.06 | 0 |
| PYLD: PIMCO's Income fund | 0.79 | 0 |
| TQQQ and TMF: borrowing at the actual short rate | 0 | 22 |
| Managed futures: the BTOP50 index | 0 | 20 |
| Every other fund on our data | 0 | 10 |
| Our inflation series, and the S&P 500 index as the trigger | 0 | 10 |
Two changes do most of the work.
The first is the covered-call fund. A covered call means owning the index and selling someone else the right to buy it from you at a set price, for a fee. The fee is your income. In return you give up most of the gains above that price, but you keep almost all of the losses. Zack modelled GPIQ before 2014 as 0.56 times the Nasdaq-100 fund QQQ, which treats it as a smaller copy of the index that also falls less. Real funds don't behave like that. Since 2014, QYLD, the oldest Nasdaq covered-call fund, has moved 0.38 times QQQ in months when QQQ rose and 0.73 times when it fell. GPIQ, which sells calls on only part of its holdings, has moved 0.76 and 0.96 times since it launched in late 2023. In February and March 2020, QYLD lost 16.4% while QQQ lost 12.9%. The 0.56 rule says 7.3%. I replaced it with an option model: hold the Nasdaq-100 and sell one-month calls each month, priced from the market's implied volatility. Calibrated on QYLD's record, the model returns 8.2% a year against QYLD's real 8.5%, and fitted to GPIQ's record it sells calls on about 25% of the portfolio.
The second is the cost of leverage. Zack charged synthetic TQQQ a flat 1.5% a year. A 3x fund borrows twice its value, and in 2000 and again in 2006 and 2007 short-term rates were around 5 to 6%.
On our data, the January 2000 retiree misses a first payment in December 2025, and 10 in all. The highest safe starting withdrawal, the largest rate raised with inflation that would have made every payment from January 2000, falls from Zack's 5.5% to 5.0%. The same 13 funds without the trigger run out years earlier, as do the S&P 500 alone and a 60/40 portfolio with aggregate bonds. A plain 60/40 with long Treasuries gets through with $0.67M left, and its highest safe rate is just over 5.5%.
The trigger on its own, back to 1928
The trigger is the part of Zack's idea that can be tested over a long history. Three-quarters of the portfolio is in funds launched in 2023, so any long test of it is mostly a test of stand-in data. The trigger can go on any portfolio. So I put the same rule on a simple base: 54% S&P 500, 36% US bonds, 5% 3x growth stocks and 5% US small value, which is a 60/40 with Zack's two small sleeves. The 3x sleeve before 1985 is three times a growth-stock index, with the borrowing charged at the short rate of the time.
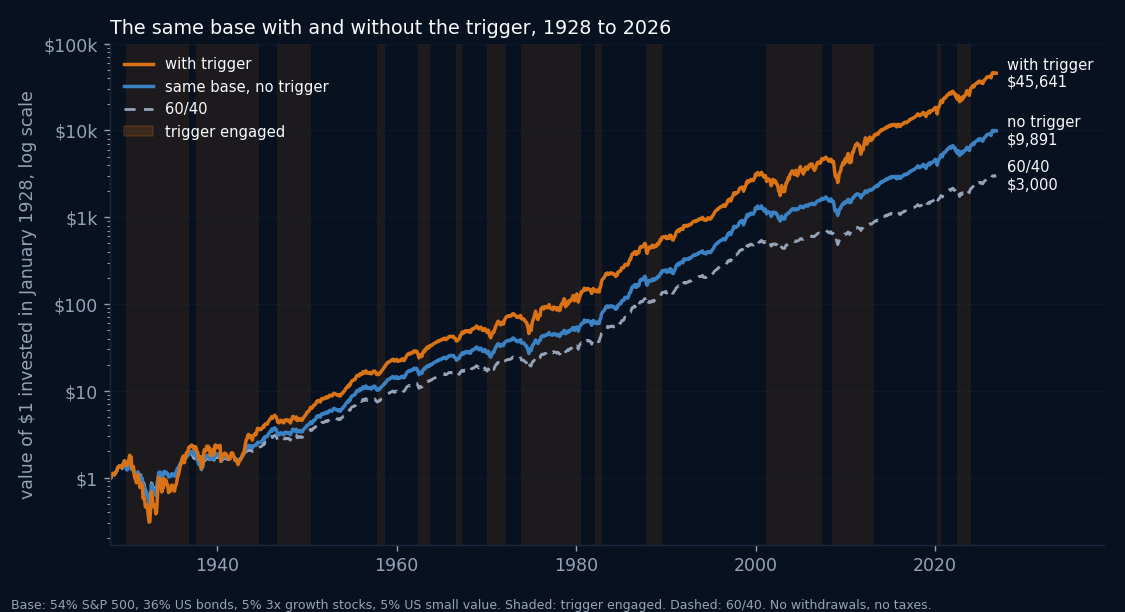
Without withdrawals, $1 grew to $45,641 with the trigger and $9,891 without it. The gap opens in the recoveries. In 2008 the rule went to 20% leverage in October, five months before the low, and held it until the new high in March 2013.
Then the retirement test. I ran 276 thirty-year retirements, one starting every quarter from 1928 to 1996, each with $1M.
| Withdrawal rule | With trigger (% of retirements that made every payment) | Same base, no trigger (%) | 60/40 (%) | S&P 500 (%) |
|---|---|---|---|---|
| 4% a year, raised with inflation | 100 | 100 | 96 | 96 |
| 5% a year, raised with inflation | 93 | 84 | 78 | 80 |
| Zack's 7%, cut to 5% and 4% after falls | 85 | 74 | 61 | 76 |
At 5% the trigger also left more money at the end in 91% of start dates. Zack's own Monte Carlo test, which shuffles five-year blocks of history, points the same way: the trigger lifts his portfolio from 66.7% to 78.8% of paths that make every payment. His 13 funds still trail plain S&P 500 there, at 83.7%, which says more about the funds than about the trigger.
What it costs
The trigger adds leverage at the moment a portfolio is already down, and the topping up keeps adding it while the market keeps falling. The simple base with the trigger fell 84% between April 1930 and June 1932, as far as the S&P 500 itself, against 70% without it. In the worst of the 4% retirements, which started in October 1929, the portfolio dropped to 19% of its starting value after inflation before it recovered. On Zack's 13 funds it fell 64% from 2000 to 2003, against 54% without the trigger.
The 7% starting rate isn't safe either, even with the spending cuts: 15% of the retirements above ran out. A retiree who started in October 1929 did make every payment under Zack's rule, with or without the trigger, because the cuts came early. At a fixed 5% with no cuts, the same 1929 start ran out in both versions, and sooner with the trigger: 116 missed payments against 35.
When the market doesn't come back
The trigger is a bet that a market that has fallen 20 to 40% recovers within about seven years. That held after every US crash since 1928. Japan after 1990 is the case where it didn't. I ran a simplified version there: the Nikkei 225 with dividends, cash at Japanese short rates, and 3x Nikkei for the leveraged sleeve, with the Nikkei again in place of small value.
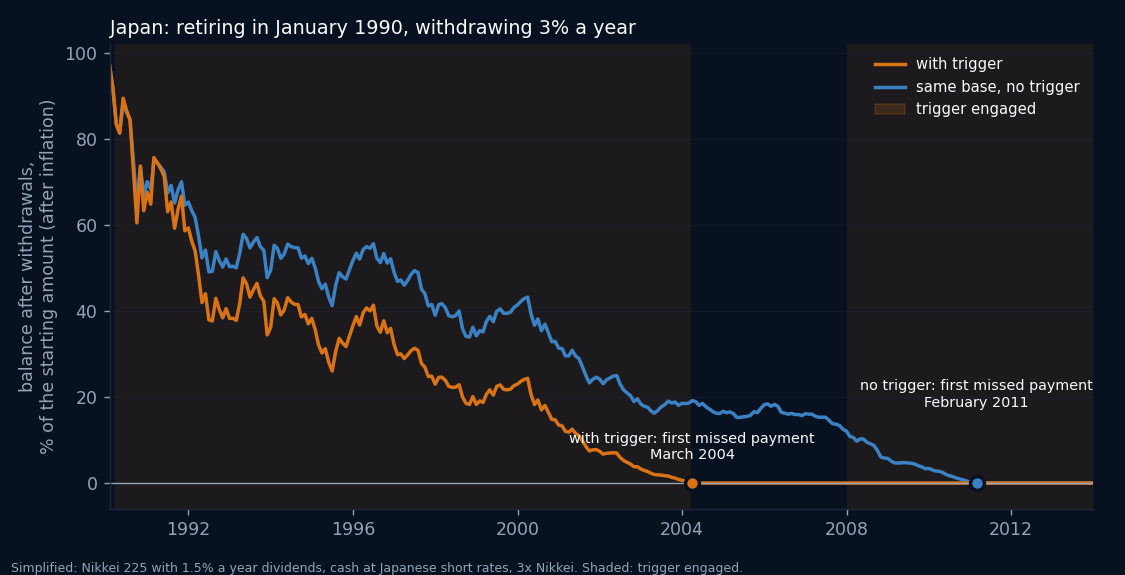
From 1987 the rule triggered 7 times, and 3 of those runs ended on the 7-year clock, with no new high in between. After the 1997 exit, the next fall was measured from the past year's highest close, so the trigger fired again six days later. It stayed leveraged almost without a break from 1990 to 2004, topping up each quarter in a market that kept falling. A retiree who started in January 1990 with 3% a year missed a first payment in March 2004 with the trigger, and in February 2011 without it. Over the 44 thirty-year retirements starting from 1986 to 1996, at 3% a year, 32% made every payment with the trigger against 77% without it. The trigger version never ended with more money than the version without it.
So the rule did better across US history and worse in Japan, for the same reason: it adds leverage when prices are low and holds it until they recover. Whether that's a good trade depends on two things. How sure are you that your market comes back within seven years? And can you live with a portfolio worth a fifth of what you started with while you wait?
A related rule already runs on BestFolio. Randy Harris's Bamboo+ and Bamboo++ also add 2x or 3x leverage after a 15% fall, but only once momentum has turned positive again. That way they sit out the part of a crash that is still going down. From 2000 to early 2024, their worst month-end fall was the same as the unleveraged Bamboo's, -18.5%. A momentum check like that is the obvious next test for Zack's trigger.
We won't add the 13-fund portfolio as a strategy, because most of its history would be stand-in data. The trigger is a different matter, since it can be tested on almost any portfolio.
How this was tested: Zack's rules as of 25 October 2026 and daily data, with the trade at the next day's close as in his rules. Withdrawals come out at month-ends, from overweight funds first, raised with US inflation (Japanese inflation for Japan). The S&P 500, bond, gold, managed-futures and leveraged-fund histories come from the same data the site uses. For the years before these funds launched in 2023, GPIQ is the option model above and SCYB is broad high yield. For PYLD, those years use PIMCO's Income fund back to 2007 and a bond mix before that. I build BestFolio. Backtests are hypothetical, include no taxes, and past returns do not predict future ones.