A subscriber who holds Buy the Dip recently asked me whether there is a write-up of how the parameters were derived, and whether they were ever sensitivity-tested.
The straight answer is no to both, and it starts with where the strategy comes from. Buy the Dip is a Reddit community take on an RSI dip-buying rule that had been around for longer, and I couldn't trace its exact roots. I didn't write it. What I changed in 2024 was the holdings: I reworked the aggressive and defensive mixes slightly to add a bit of return stacking on both sides. The signal side came as it was, and I never touched it: RSI over 14 days, with 30 as oversold and 80 as overheated, the 200-day moving average with a 3% band, and a 1% buffer around each RSI level, copied from the testfol.io version of the rule. Nobody swept anything.
So I did it now. About 2,300 backtests on the production engine and the same price data the site uses, with 10 bps per trade. Some of what came out doesn't flatter the strategy.
What the rule does
Every day it looks at QQQ and picks one of 4 regimes:
- Oversold (RSI under 29.7): 100% TQQQ.
- Overheated (RSI over 80.8): 100% SQQQ.
- Aggressive (QQQ above its 200-day average plus 3%): 20% TQQQ, 30% managed futures (DBMF), 10% 2x gold, 20% min-vol US stocks, 20% zero-coupon Treasuries.
- Defensive (otherwise): the same mix with intermediate Treasuries in place of TQQQ.
The published backtest starts in 1985: 24.7% a year, Sharpe 1.04, worst drop -76.2%. Since 2007 it's 30.1% at 1.52 with a -36.9% worst drop. Since 2010, when TQQQ itself exists, it's 29.7% at 1.61 and -21.2%. QQQ over the same 3 windows did 15.4%, 16.3% and 19.6%.
The site's figure moved from 22.5% to 24.7% on 28 September (24.9% after the 17 October data refresh), when the engine started letting holdings drift with their own prices until the next signal, the way you'd actually hold them. Every figure below is on the new engine.
Where the return comes from
The oversold leg is tiny in time and huge in effect. Since 2010 the strategy held TQQQ in the oversold regime on 41 days, 1.0% of all days, across 24 separate episodes. Those 41 days produced 42.7% of the total log return. QQQ rose on 73% of them.
Switch that leg to cash and the 2010+ result drops from 29.7% to 16.0%. Since 1985 it drops from 24.7% to 14.1%. Turn off both RSI legs and you're left with a plain trend switch between the 2 mixes: 14.4% since 2010 and 13.5% since 1985.
The SQQQ short matters less. Sending the overheated leg to cash costs 2.4 points a year since 2010 (27.3% instead of 29.7%) and only 0.4 points since 1985 (24.3%).
| Version of the rule | CAGR since 1985 (% a year) | CAGR since 2010 (% a year) |
|---|---|---|
| Published rule | 24.7% | 29.7% |
| Overheated leg sent to cash | 24.3% | 27.3% |
| Oversold leg sent to cash | 14.1% | 16.0% |
| Both RSI legs off (trend switch only) | 13.5% | 14.4% |
That plain switch isn't the safe version, though: it lost -70.3% from March 2000 to March 2002. From 1988 on, the published rule's worst drop was -46.7%. With no RSI flips, nothing trades the book back to target for years, so the 20% TQQQ slice kept growing through the late 1990s. On 28 March 2000 it was 84% of the portfolio. The published rule held 30% that day, because every flip resets the mix.
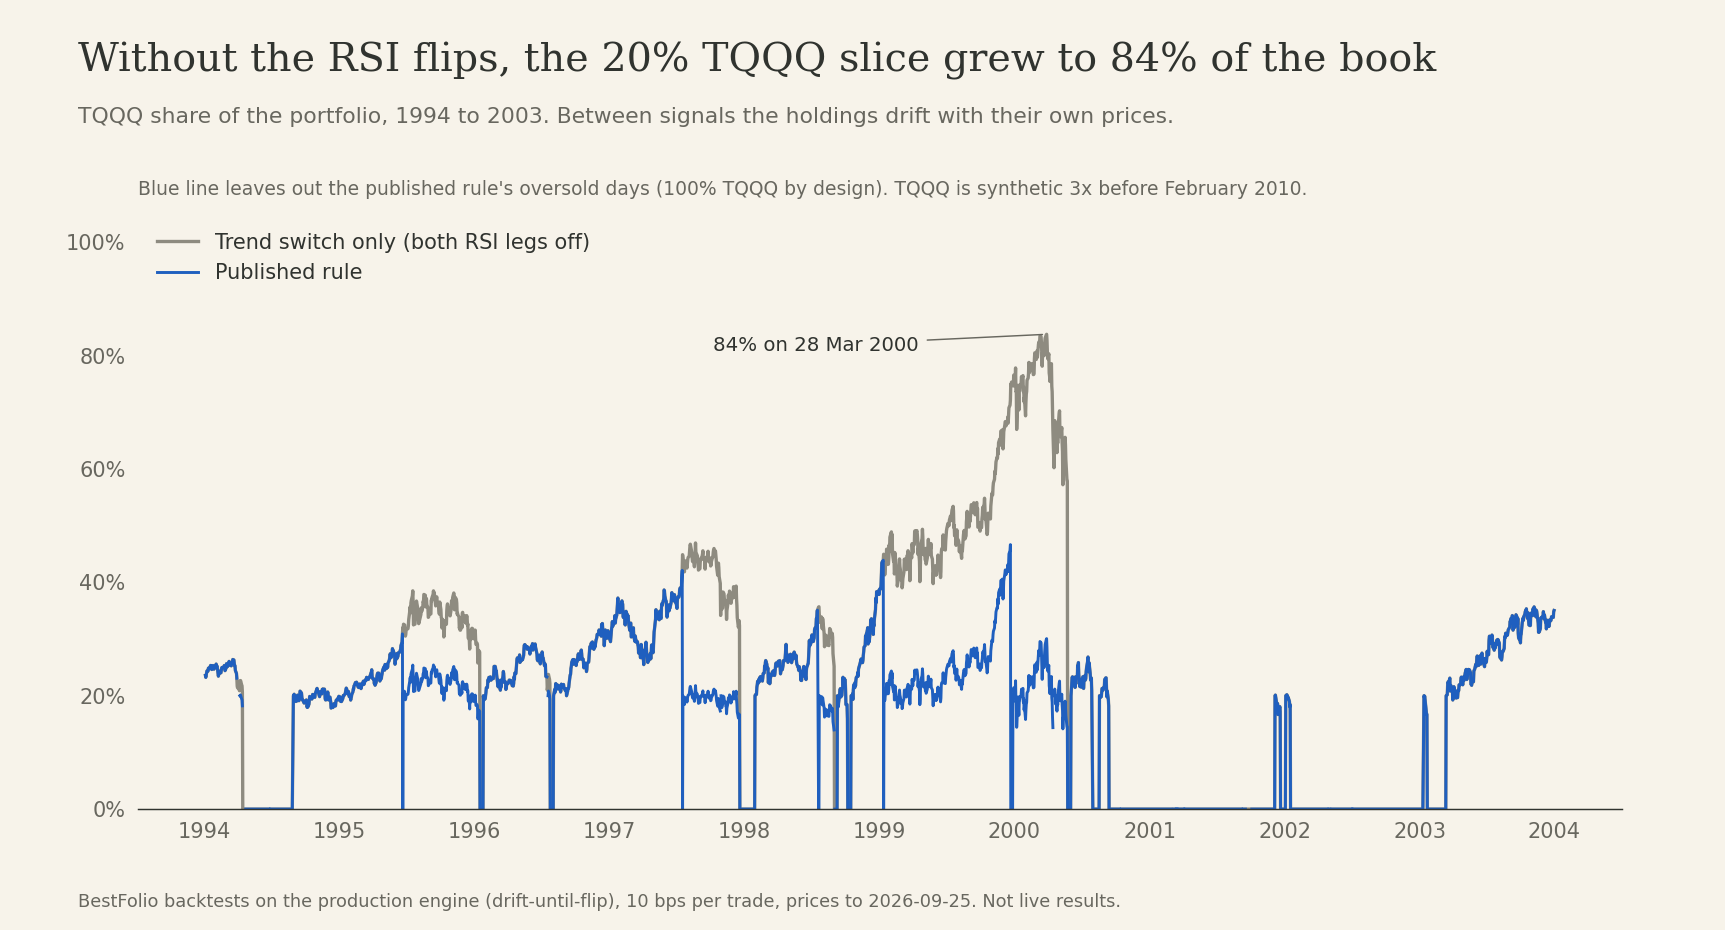
So the RSI legs do 2 jobs. They make the money, and they stop the TQQQ slice from taking over. That's why the parameter question is mostly about them.
The trend half doesn't care
I ran every combination of moving average length from 100 to 300 days and band width from 0% to 5%. That's 99 settings. Since 1985 they all land between 23.2% and 26.4% a year, with Sharpe between 0.99 and 1.08. Since 2010 the range is 27.0% to 31.5%.
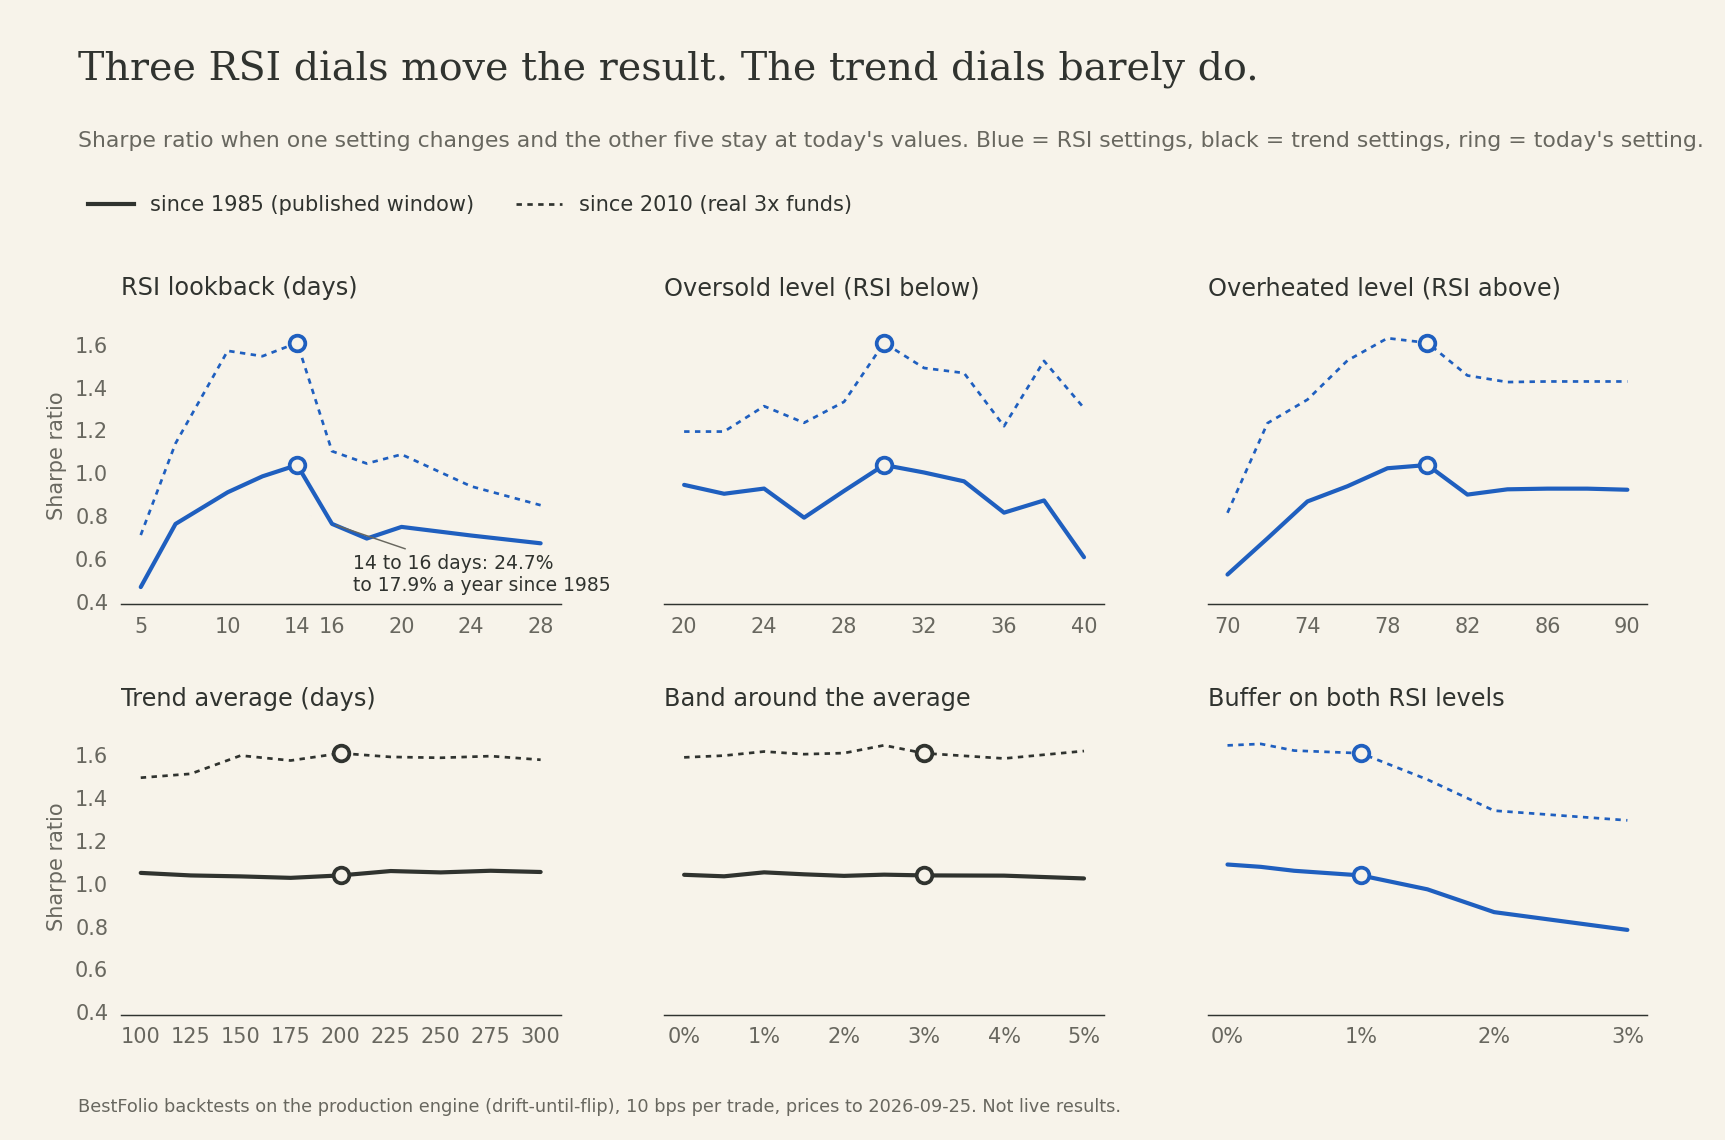
That's a plateau. The 200-day average and the 3% band are fine, and so is almost anything nearby. If you run this with a 150-day average, you're not running a different strategy.
The RSI half does care, a lot
Move the RSI lookback from 14 days to 16 and the 1985+ result falls from 24.7% to 17.9%. Since 2007 it falls from 30.1% to 18.0%. That's 12 points a year for a 2-day change in a lookback I took from the textbook.
The oversold level behaves the same way. At 28 instead of 30, the 2007+ result is 22.1%. At 32 it's 32.2%. Higher levels hold TQQQ more often, so CAGR can go up while the drawdowns get worse, which is why I judge these on Sharpe.
The overheated level has a floor: below about 76 the short fires too often and results fall fast (10.5% since 1985 at a level of 70). Push it to 84 or higher and it rarely fires at all, which costs about a point and a half a year since 1985 (23.3% at 84).
The 1% buffer turns out to be a small cost. With no buffer at all the 1985+ result is 25.9% at Sharpe 1.09. With 3% it's 19.3%. A buffer like this is there to stop the regimes flickering. On this data the flicker was worth more than the calm.
1,000 random settings
One-at-a-time sweeps can miss interactions, so I also drew 1,000 settings at random, all 6 dials at once: RSI 7 to 28 days, oversold 20 to 40, overheated 70 to 90, buffer 0% to 3%, average 100 to 300 days, band 0% to 5%.
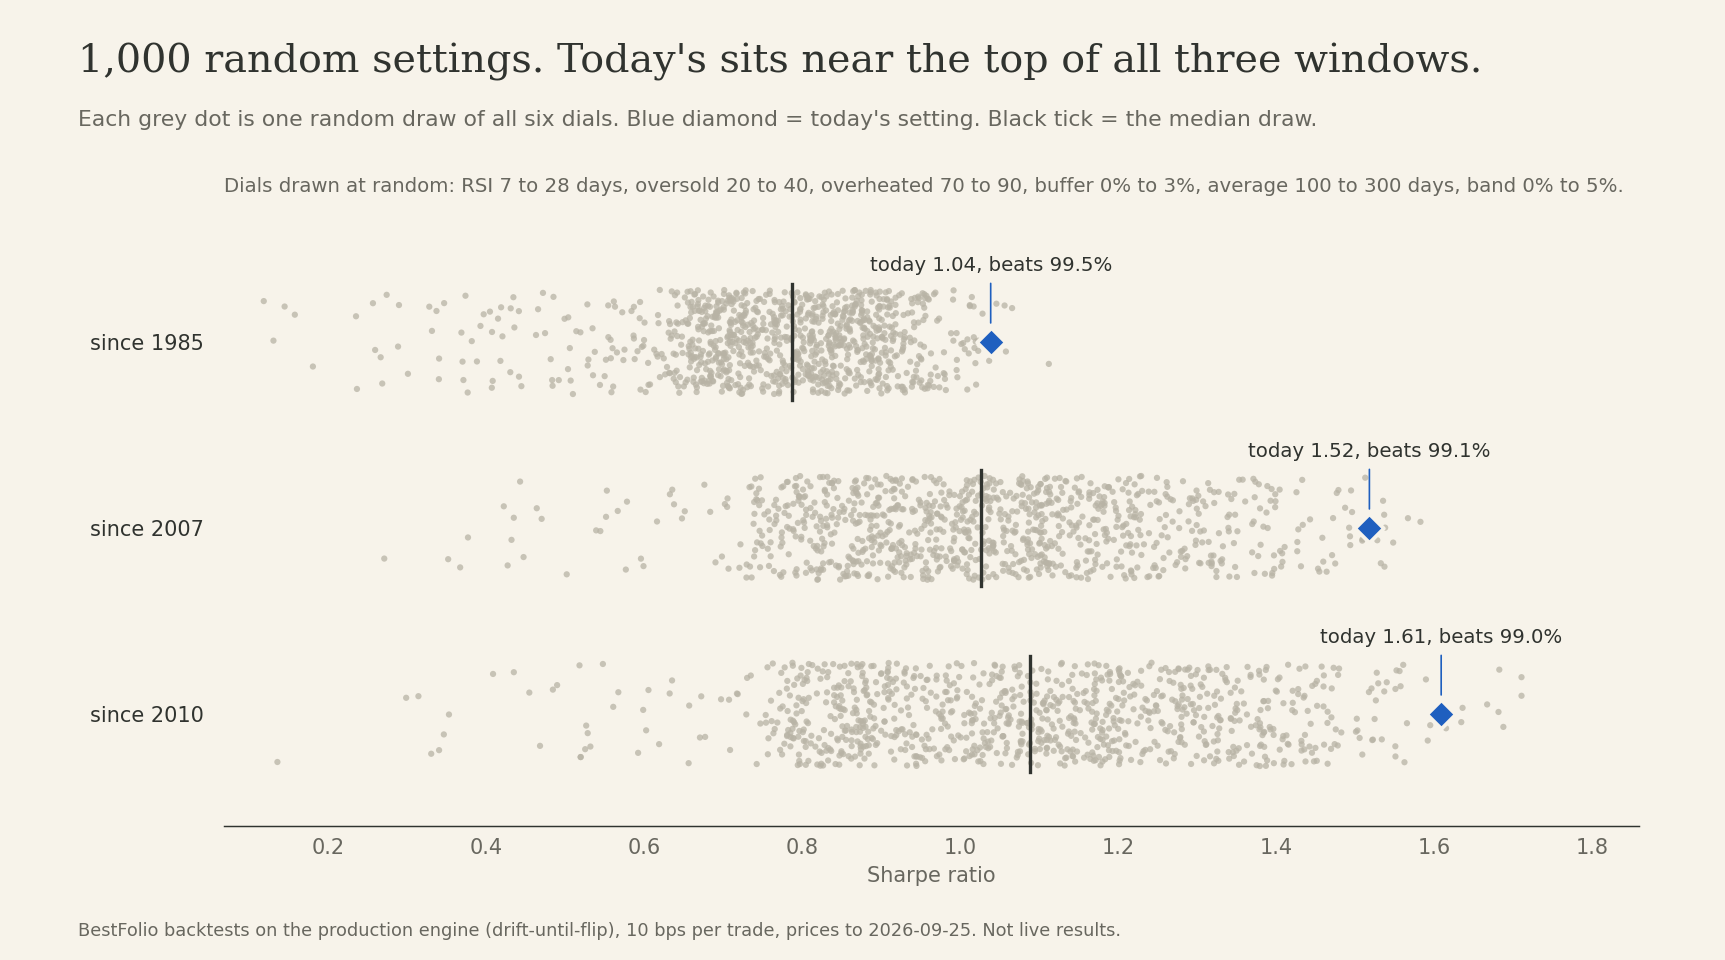
The current setting sits near the top. Its Sharpe beats 99.5% of them since 1985, 99.1% since 2007 and 99.0% since 2010. Only 9 of the 1,000 did better since 2007.
The median random one made 17.2% at Sharpe 0.79 since 1985, and 19.7% at 1.03 since 2007. Even the 50 settings closest to the current one only managed a median of 25.5% at 1.24 since 2007, against the published 30.1% at 1.52.
The RSI idea itself holds up, though. 79.1% of the random settings beat the plain trend switch on Sharpe since 1985, and 85.3% since 2007. Part of that is the drift problem above: with both RSI legs off, the Sharpe since 1985 falls from 1.04 to 0.68.
So the answer to "plateau or peak?" is both. The trend half sits on a plateau. The RSI half sits near a peak, and the published line is closer to the best case of this family than to its typical case.
Did I get lucky, or did I get it right?
I can't go back to 2024 and pretend I didn't know the history. But I can ask a cleaner question: if I had tuned the dials on the first half of the data, would that have helped in the second half?
I split the history at the end of 2006 and ranked the 1,000 settings on 1985 to 2006. Then I checked the same settings on 2007 to 2026.
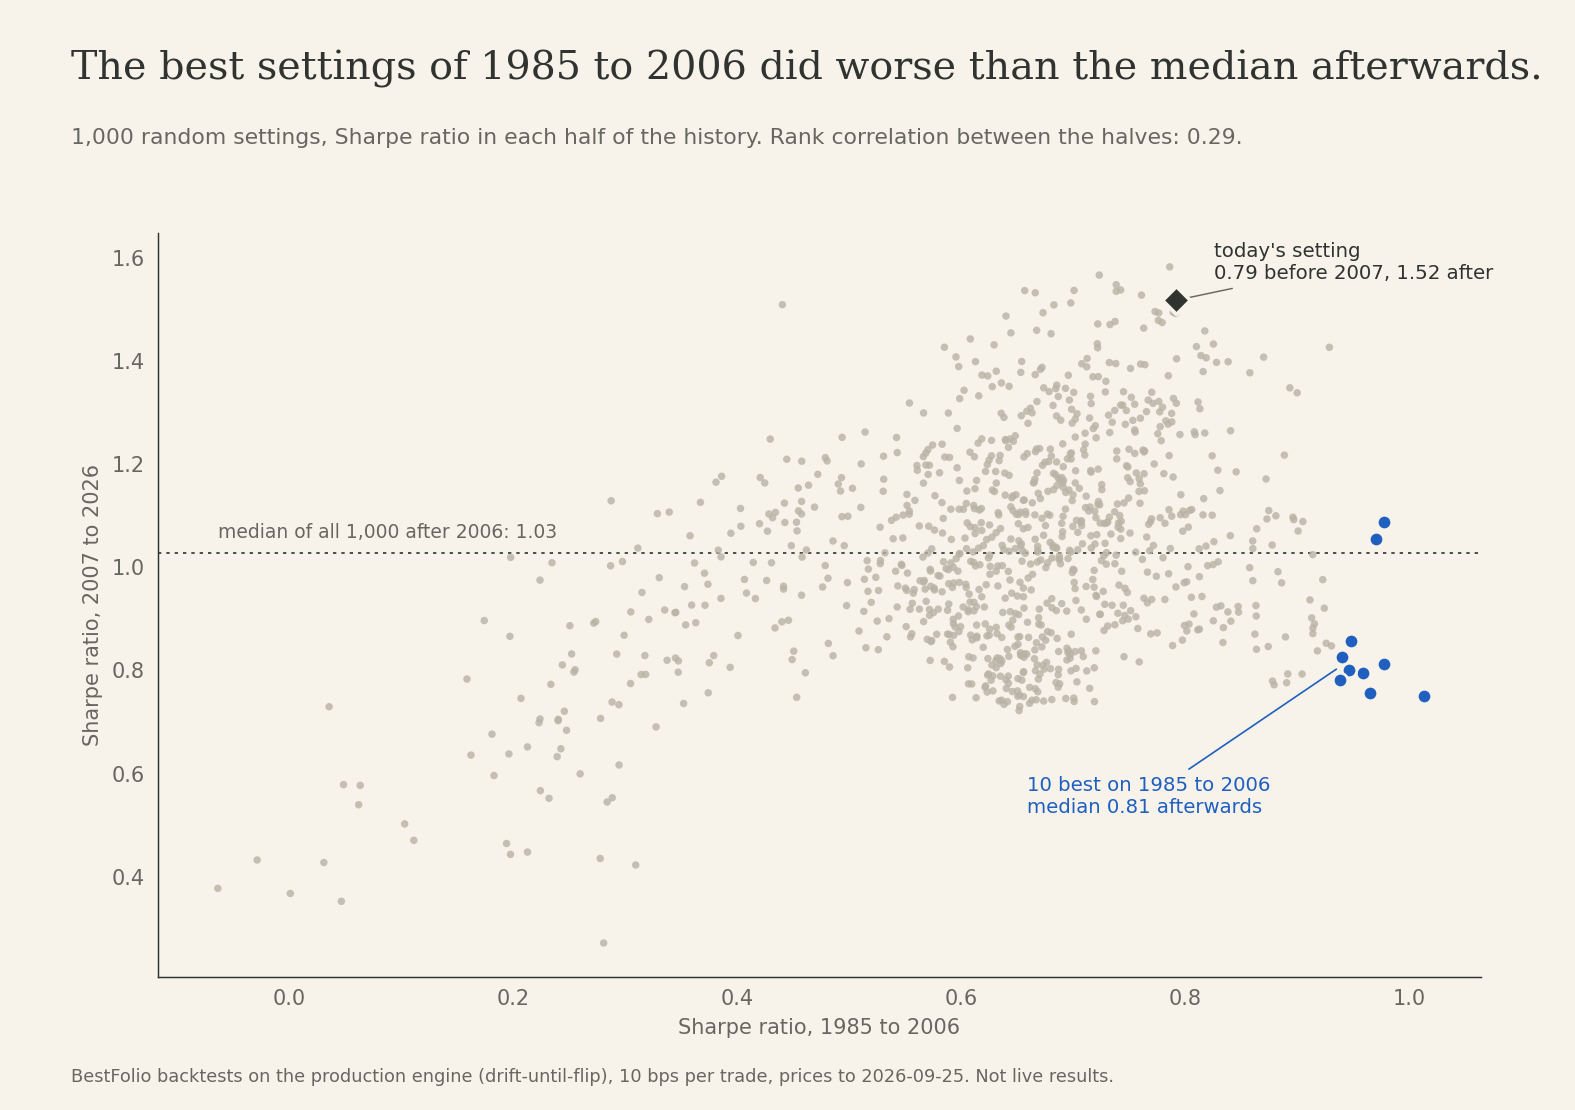
The rank correlation between the 2 halves is 0.29. Some of the ordering carries over, not much. And the very top doesn't: the 10 best settings of the first half had a median Sharpe of 0.81 in the second half and made 13.5% a year. The median of all 1,000 did 1.03 and 19.9%. Picking the winners of the first 21 years would have made the next 20 worse.
The current setting was good before 2007 without being the best. Its 1985 to 2006 Sharpe was 0.79, better than 88.5% of the settings. It only moves to the very top after 2007.
I also ran the deflated Sharpe test, which asks how high the best of 1,000 random tries would look by luck alone. On the full history the bar is 0.48. The published 1.04 clears it (probability 99.7% that the edge is real after the haircut). The odds that 14/30/80 beats the median setting over the full history come out at about 89%. So it's probably better than a typical version of this rule. How much better is the part I can't pin down.
I think the RSI dip idea has an edge, the exact numbers sit near a sharp peak, and nobody can pick next decade's best setting from the last one. I'm leaving the parameters alone. Re-tuning them now would only fit the backtest I already have.
If you want a number to plan around, I'd use the neighbourhood: something in the mid-20s since 2007, about 5 points under the published 30.1%, and lower if you can't trade near the close.
If you trade it with real money, read this part
The backtest fills every change at the close of the day the signal fires. The RSI is computed on that close, so you can't do this exactly. You can get close: if you're on Pro and hold it, BestFolio sends a preview alert about an hour before the close on any day the signal looks set to change, and filling then is the version that tracks the backtest. The preview uses prices from that moment, so on a borderline day it can disagree with the final signal.
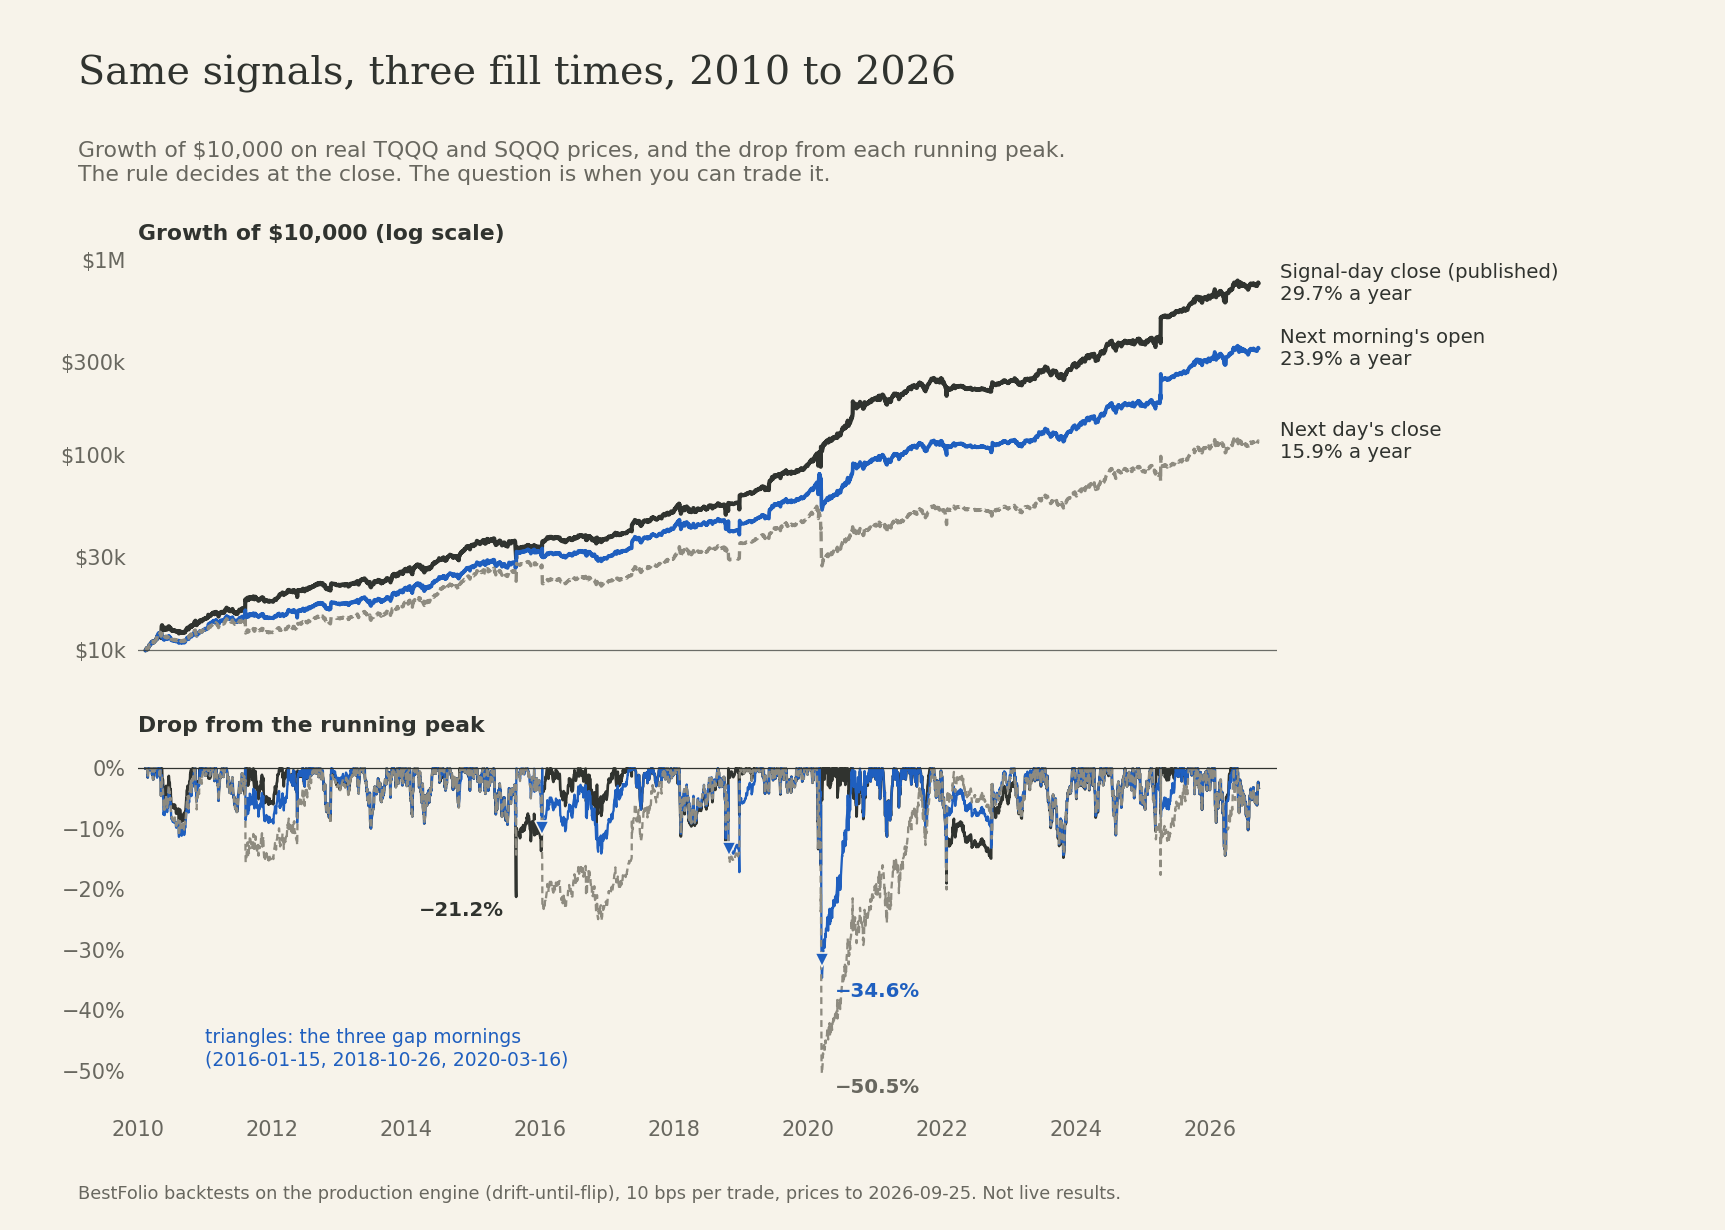
Filled at the next morning's open, the 2010+ result drops from 29.7% to 23.9% and the worst drop goes from -21.2% to -34.6%. Most of that damage came from 3 mornings (2016-01-15, 2018-10-26 and 2020-03-16) when the market gapped down right after the oversold leg had exited. You'd have been holding TQQQ into the gap. Take those 3 out and the open costs 1.9 points. So the typical cost is small, and the bad case is very bad.
I've quoted about 1.4 points a year for trading at the open before. That number only counted the entries, and it was on the old engine (1.7 points on today's). Counting the exits too, it's 5.9 points since 2010.
Filled a full session late, at the next close, it drops to 15.9% with a -50.5% worst drop. That's roughly the trend switch alone. The dip leg earns its money on the day after the RSI print. One day late, you miss the bounce and often catch the pullback after it.
Where the history is soft
The 1985 number carries more construction than the recent ones:
- TQQQ and SQQQ are synthetic 3x and -3x of the Nasdaq-100 before February 2010. The published -76.2% drawdown is October 1987, including a -45.4% synthetic TQQQ day on Black Monday. A real 3x fund might not have survived that, and today's circuit breakers would cap the index move.
- Managed futures before 2008 are the monthly BTOP50 index spread evenly over each month, so that sleeve's daily swings are far too smooth. From 2008 to 2019 it's a managed-futures mutual fund scaled to match. Real DBMF starts in May 2019.
- Min-vol stocks are SPY at 75% before late 2011, zero-coupon Treasuries are TLT at 140% before late 2009, and 2x gold is synthetic before December 2008, built on monthly gold prices before 2000.
- Only the period since 2024 is truly out of sample. Everything earlier is history the rule was written after, even if nobody tuned it.
- The oversold leg's return since 2010 rests on 24 episodes. A handful of them decide the number.
None of this changes the ranking of the findings. It does mean the 2010+ window is the one I'd trust most.
What I'd take away
The trend half is solid and boring, which is what you want from it, as long as the RSI legs stay on.
The RSI half is where the return lives, and it's sharp. The exact settings sit near a peak. Measured against the 50 nearest settings, the published CAGR is about 4.6 points a year above what a nearby version of this rule made since 2007.
If you hold it, size it for the neighbourhood, and plan lower, with the -35% to -50% drawdowns you get when execution slips, if you can't trade near the close.
All numbers are backtests, not live results. The rules as the site runs them are on the Buy the Dip strategy page.