In 5,000 Classic 60/40 paths, the middle 30-year return barely reacted to the bootstrap setting. The 95th-percentile maximum drawdown worsened by 23.78 percentage points.
A Monte Carlo chart can look authoritative while hiding its most important assumption. Resampling 1 month at a time treats the historical months as loose tiles. Resampling long blocks keeps more of their original order, including the clusters that make prolonged bear markets painful.
The difference barely touched median compound return in this test. It changed the bad drawdown tail dramatically.
One return history, 6 block lengths
The study used Classic 60/40 monthly returns from 1923-01 through 2026-08: 1,244 monthly observations and an 8.72% historical CAGR. Each setting generated 5,000 moving-block bootstrap paths over a 30-year horizon with seed 42.
Only the block length changed. A 1-month block samples individual months. A 36-month block samples 3-year sequences, preserving far more of the historical ordering inside each draw.
| Block length | Median CAGR | Median maximum drawdown | 95th-percentile maximum drawdown |
|---|---|---|---|
| 1 month | 8.72% | 24.57% | 38.97% |
| 3 months | 8.70% | 26.38% | 42.42% |
| 6 months | 8.76% | 27.40% | 44.57% |
| 12 months | 8.82% | 28.93% | 51.65% |
| 24 months | 8.85% | 30.78% | 57.76% |
| 36 months | 8.82% | 30.78% | 62.75% |
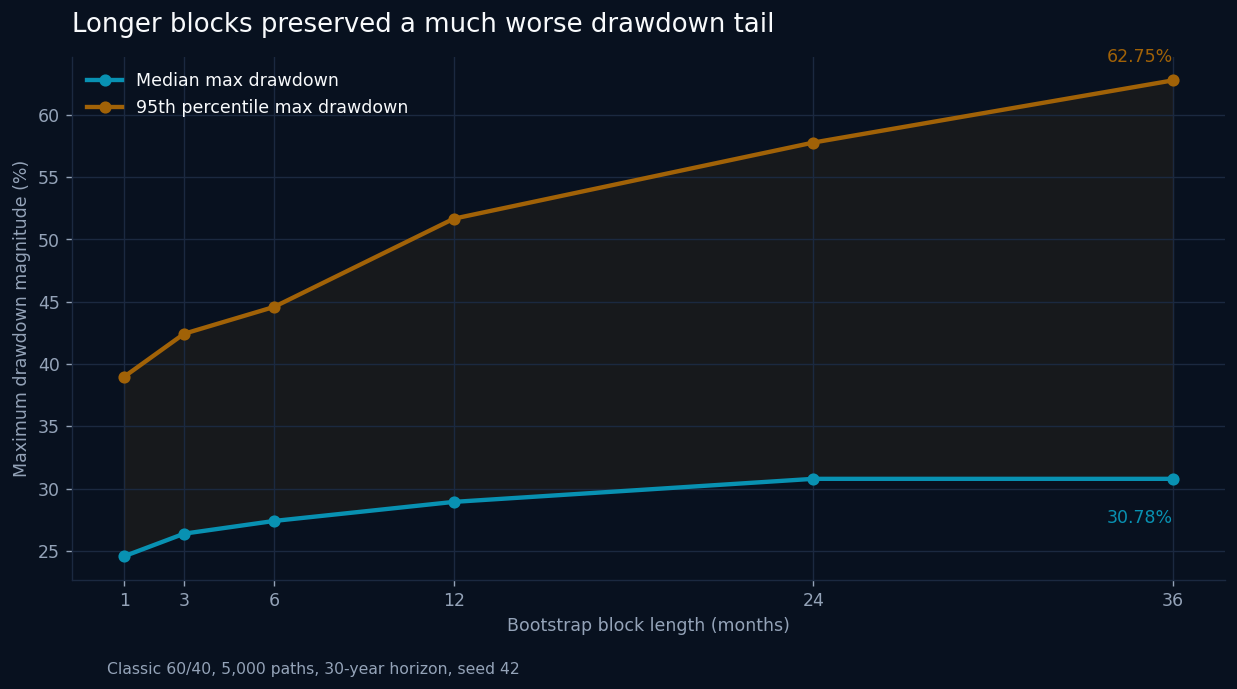
From 1 month to 36 months, median CAGR moved from 8.72% to 8.82%, a change of 0.10 percentage points. The 95th-percentile maximum drawdown moved from 38.97% to 62.75%, a change of 23.78 percentage points.
Why the middle stays put
Every setting draws from the same monthly return history. Over 30 years, many paths receive a broadly similar collection of good and bad months. Changing their local order has limited effect on the middle terminal compound rate.
Sequence still matters for compounding, which is why the medians are not identical. The 0.10-point endpoint difference is small beside the width investors usually see in a 30-year return distribution.
Why the tail changes
Maximum drawdown is an order statistic. A long run of weak months matters much more than the same months scattered among recoveries.
Short blocks break historical stress sequences into pieces. Bad months still appear, but a randomly inserted good month can interrupt a developing drawdown. Long blocks preserve more bear-market continuity. The path can remain below its prior peak while another weak sequence arrives, deepening the measured loss.
This is exactly the part of a retirement model that return-only summaries can obscure. A plan can reach an acceptable median terminal value and still face a long, deep loss at a time when withdrawals or investor behavior make recovery harder.
The 95th percentile is a model output, not a forecast boundary
A 62.75% drawdown at the 95th percentile means 5% of the simulated paths were worse under that setting. It does not establish a 5% real-world probability. The bootstrap can only rearrange patterns contained in the historical sample, according to the selected block rule.
New inflation structures, policy responses, market closures, or asset relationships remain outside the generator unless the source history already contains a useful analogue. The extra decimal places measure the simulation, not certainty about the future.
What to inspect in a Monte Carlo report
- Source return frequency and total history length.
- Independent draws, moving blocks, stationary blocks, or a fitted return model.
- Block length and a sensitivity table around it.
- Path count, horizon, and random seed.
- Whether the chart reports terminal wealth, drawdown, withdrawals, or all 3.
- Which historical features the generator cannot reproduce.
The stable median is useful because it isolates the effect. Block length did not rewrite the central return story for Classic 60/40. It rewrote the severity of the drawdown story, which is precisely where a retirement model needs more scrutiny.
Strategy source
BestFolio Classic 60/40 strategy page
Past performance does not guarantee future results. Backtested results are hypothetical and do not represent actual trading.