Last week we published a study that tried to convict our own flagship strategy of overfitting. The conclusion was uncomfortable: which parameter settings looked best on 31 years of history told you nothing about the next 7, published strategies tend to fade after publication, and HFEA, a strategy with almost nothing to fit, still lost 60% in a single year.
The fair reply to all that is a question. If most backtests are worth so little, what is worth anything?
Here is our answer, and it is not our best-performing strategy. It is the one with the highest ratio of evidence to complexity in our entire catalogue.
The whole strategy in one sentence
HAA-Simple, from Wouter Keller's Hybrid Asset Allocation paper, works like this: hold the S&P 500 only when 2 things are true at the same time, and otherwise hold whichever of intermediate Treasuries or T-bills is doing better.
The 2 conditions are:
- Inflation-protected Treasuries (TIP) have positive momentum. This is the "canary": when TIPS are falling, something is wrong with the rate and inflation weather, and it usually shows up in equities shortly after.
- The S&P 500 itself has positive momentum, measured as the average of its 1, 3, 6 and 12-month returns.
Check once a month. That is the entire rule set. Two signals, three possible holdings, twelve decisions a year.
Why we trust it more than things that score better
Our catalogue has strategies with higher returns and higher Sharpe ratios. The full HAA, which holds 4 assets from a broad universe instead of 1, compounds at 16.15% against this one's 12.67%. We are not going to pretend the simple version wins on the numbers.
What it has instead is 52.5 years of history, one of the longest credible record we can build for a tactical strategy, and almost nothing to fit. That combination is rare and it is the thing worth paying attention to.
| 1974 to 2026 | HAA-Simple | 100% US stocks | Classic 60/40 |
|---|---|---|---|
| Annual return | 12.67% | 11.61% | 8.04% |
| Sharpe ratio | 1.17 | 0.80 | 0.73 |
| Sortino ratio | 1.62 | 1.13 | 0.96 |
| Worst drawdown | -20.1% | -55.2% | -65.8% |
| Time to recover it | 23 months | years | years |
| Robustness score | 1.0000 |
The stock column is a true like-for-like race: same engine, same 52.5 years, same total-return basis, no tax and no costs on either side. The 60/40 column uses the longest window we have for it, which is shorter, so treat that one as a reference point rather than a result.
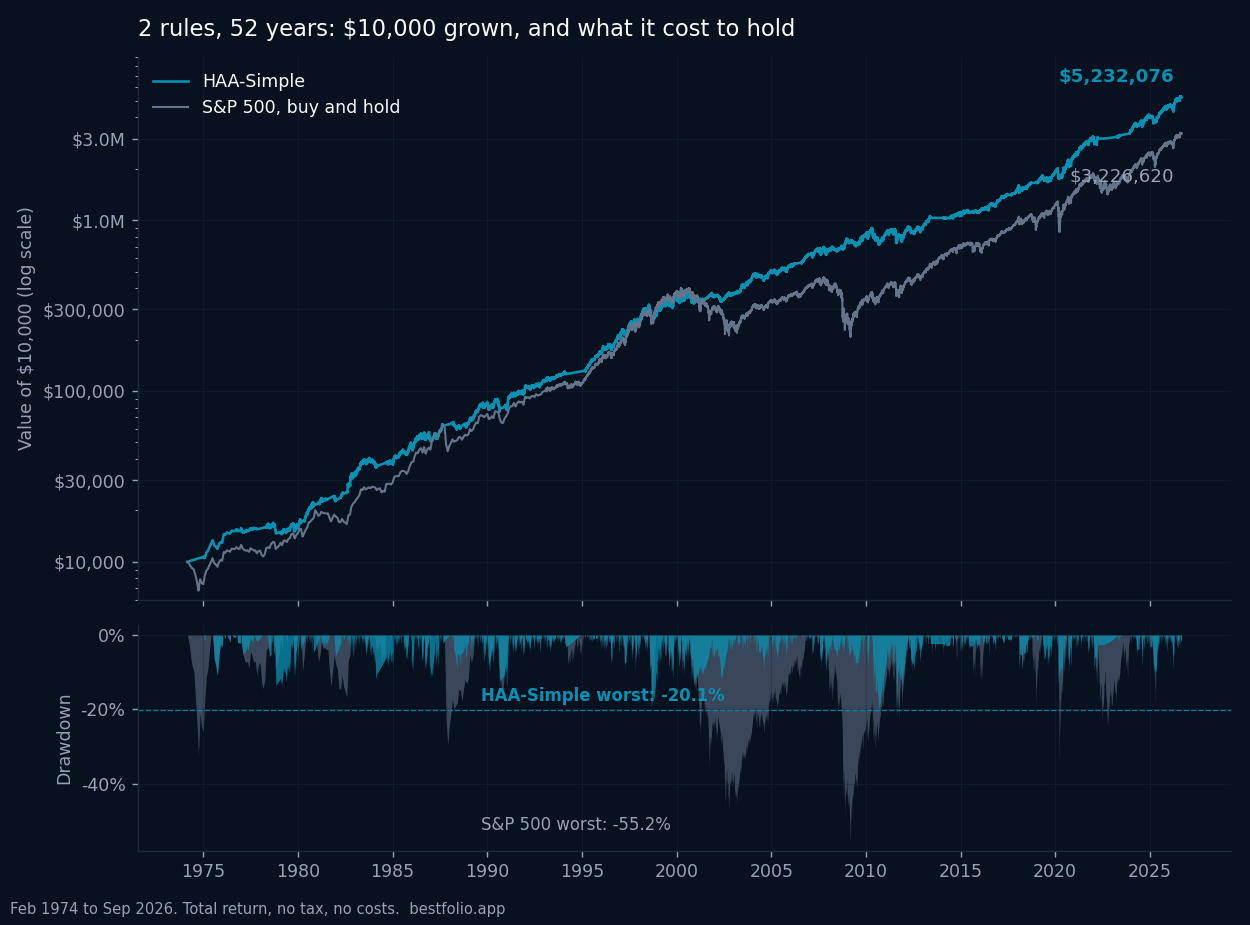
The number we would draw your eye to is not the return. It is the drawdown. A third of the pain of holding equities outright, for more return, using 2 rules that fit in a sentence.
What it did when things went wrong
This is the table that matters, and it comes from the stress-window figures now published on every strategy page.
| Period | HAA-Simple return | Worst drop inside the window |
|---|---|---|
| 2000 to 2002, dot-com bust | +10.07% | -13.79% |
| 2007 to 2009, financial crisis | +11.82% | -9.92% |
| Q4 2018 | +0.44% | -0.09% |
| Q1 2020, COVID crash | -4.64% | -13.56% |
| 2022, stocks and bonds together | -1.42% | -10.43% |
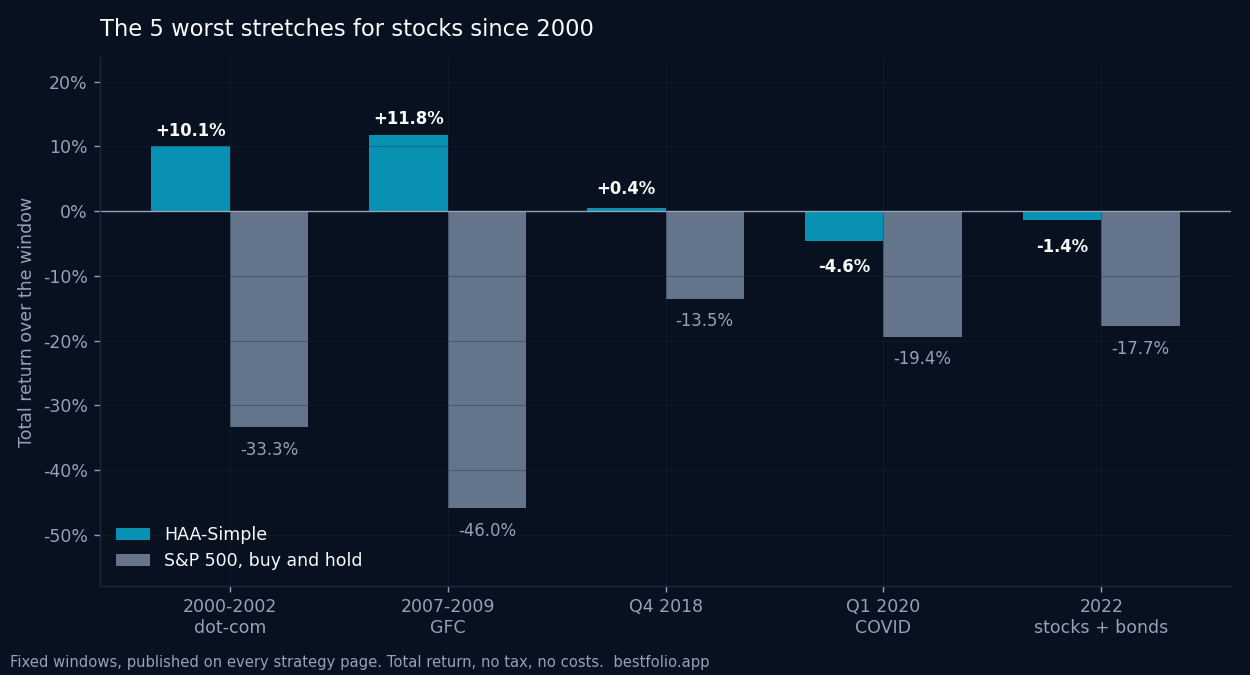
It made money through the 2 worst equity bear markets in living memory. Not "lost less", made money, because in both cases the canary and the momentum rule turned it defensive before the worst of it and kept it there.
2020 is the honest exception. A crash that fast cannot be dodged by a rule that only looks once a month, and it took a 13.56% hit before the next check. If you want protection from single-month events, no monthly strategy provides it, and anyone claiming otherwise is fitting.
Simple is not the same as safe, and HFEA is the proof
This is where we have to be careful, because "keep it simple" is the laziest advice in investing and we do not want to add to it.
HFEA is about as simple as a strategy can get: hold 55% of a 3x leveraged S&P 500 fund and 45% of a 3x leveraged long Treasury fund, rebalance quarterly. Two funds, one weight, one schedule. By the folk rule that complexity is the enemy, it should have been among the safest things anyone could own.
It returned 34.77% a year from 2010 to 2021, and then lost 60.54% in 2022.
So what separates it from a strategy that is equally simple and has survived 5 decades? Not the number of parameters. It is what the simplicity rests on.
HFEA had 2 funds but 1 idea: that long Treasuries reliably rise when equities fall. That was true for roughly 40 years and it was a real relationship, not a curve-fitted one. It was also a structural bet, and when inflation returned in 2022 both legs fell together and 3x leverage did the rest. A strategy resting on 1 assumption inherits the lifespan of that assumption.
HAA-Simple makes no equivalent bet. It does not claim TIPS predict equities, or that bonds hedge stocks, or that any relationship holds forever. It reads 2 cheap signals and steps aside when both say to. Its only real assumption is that things which have been falling for months tend to keep falling for a few weeks longer, which is the single most documented pattern in financial markets and one that has been tested to death across assets, countries and centuries.
Count the assumptions, not the parameters. That is the lesson we would take from putting these 2 strategies side by side, and it is the opposite of what "keep it simple" usually means.
The forward test nobody can fake
Keller published the HAA paper on 3 February 2023. Everything since then is out of sample in the strictest sense: the rules were public and fixed before the data arrived.
Over the 3 years since, HAA-Simple has returned 18.14% a year, against 12.67% across the full 52.5-year record.
Two honest caveats about that. Three and a half years is a short window, and it happens to have been a good one for US equities, which is exactly the environment where a rule that mostly holds the S&P 500 will look clever. A forward test that flatters a strategy in a friendly regime is weak evidence, just as a bad stretch would be weak evidence against it. What it does rule out is the most common failure, where a published strategy stops working the moment its author stops choosing the sample.
What it costs you
Three things, stated plainly.
Turnover of about 2 round trips a year. That is cheap to trade and expensive to tax. In a taxable account, gains realised every time the canary flips will eat a meaningful share of the edge, and none of the numbers above account for tax. This belongs in a sheltered account or it belongs nowhere.
Whipsaw. The rule will pull you out and put you back in within 2 months, more than once, and it will feel idiotic each time. That is the cost of the insurance that made 2000 to 2002 and 2008 profitable. You cannot keep the good half.
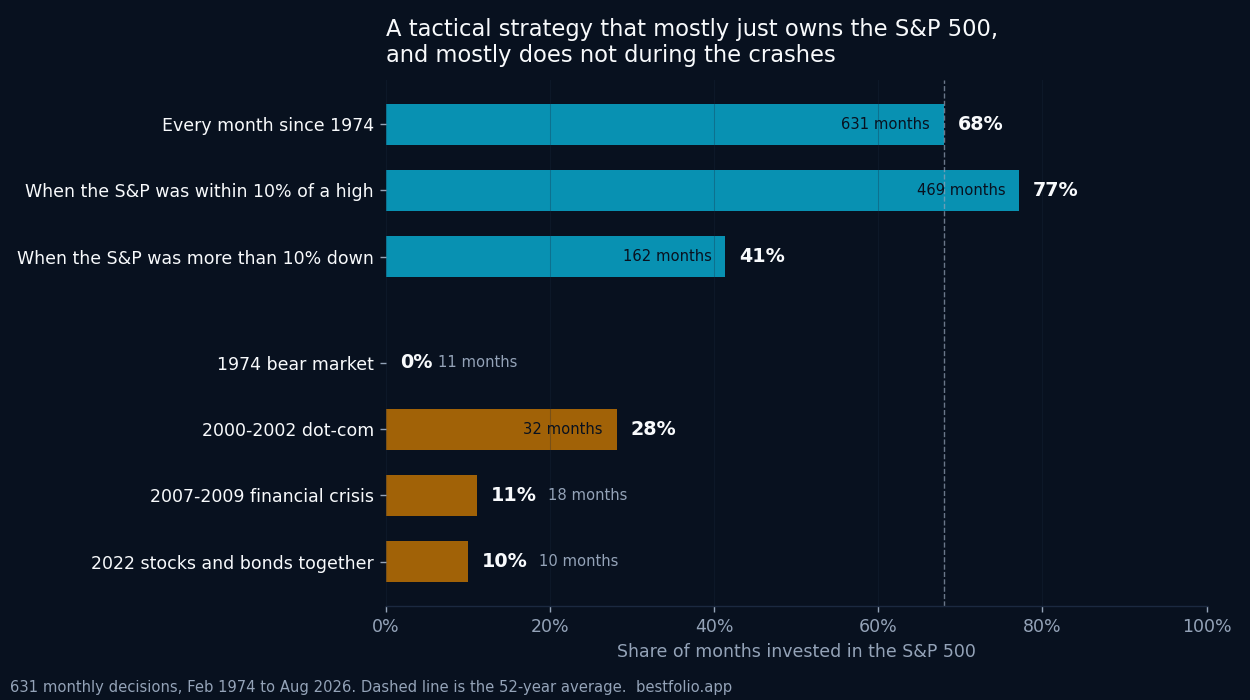
You are still mostly just holding the S&P 500. That is a feature rather than a cost, but it is worth being concrete about, because "tactical" makes people picture a rule that keeps them out of the market for years. It held the S&P 500 in 429 of 631 months, so roughly 2 months in 3 the portfolio is the index and nothing more. The defensiveness is concentrated exactly where it should be.
It is not our highest return. The full HAA does 16.15% with a Sharpe of 1.49 by holding 4 assets from a wider universe. Choosing the simple version means deliberately giving up return for a rule set you can hold in your head and a record that goes back 5 decades. That is a real trade, and for many people the wrong one.
Where this leaves the overfitting question
We started with the question our last study raised: if most backtests are worth little, what is worth something? The answer this strategy suggests is a checklist, not a strategy.
Prefer rules you can state in a sentence, because a rule you cannot state cannot be checked. Prefer records long enough to include regimes you have not personally lived through, because the ones you remember are already priced into your intuition. Count the assumptions rather than the parameters, since 1 fragile assumption beats 20 harmless knobs at destroying a portfolio. And treat anything published recently with a short backtest as a hypothesis rather than a finding.
By that checklist, this 2-rule strategy from a 2023 paper with a 1974 start date is close to the best-evidenced thing we publish. It is also not the thing that will make you the most money, and both of those statements are true at once.
The full rules, the monthly signals and every number above are on the HAA strategy page, and the study that prompted this one is here.