Across the same 52-year history, Hybrid Asset Allocation's 2x variant beat 3x on CAGR, Sharpe, Sortino, and drawdown. The signals were unchanged and turnover nearly so.
Most leverage comparisons change several things at once. The 3x portfolio holds different assets, uses a faster trend rule, or starts after the 3x fund launched. The resulting performance gap cannot be assigned cleanly to the leverage dose.
Hybrid Asset Allocation, credited to Wouter Keller and Jan Willem Keuning, offers a tighter comparison. BestFolio's 1x, 2x, and 3x variants use the same signals, the same 1974-02-28 through 2026-09-25 history, and nearly the same annual turnover (3.05 to 3.13). The leveraged versions substitute funds with leveraged proxies, but in different places. The 2x variant swaps nearly every fund for its 2x version, the defensive IEF included; only DBC and BIL stay at 1x. The 3x variant swaps only SPY, QQQ, IWM and TLT and holds everything else at 1x. Measured on the target weights, both average about 1.8x exposure (1.798x and 1.800x), so 3x is not a bigger dose overall.
The dose curve peaks at 2x
| Full-period result | HAA Standard, 1x | HAA Leveraged 2x | HAA Leveraged 3x |
|---|---|---|---|
| CAGR | 16.38% | 26.54% | 24.05% |
| Sharpe | 1.10 | 1.04 | 0.88 |
| Sortino | 2.08 | 1.97 | 1.61 |
| Maximum drawdown | -19.53% | -36.46% | -47.11% |
| Volatility | 10.97% | 21.20% | 23.50% |
| Annual one-way turnover | 3.05 | 3.11 | 3.13 |
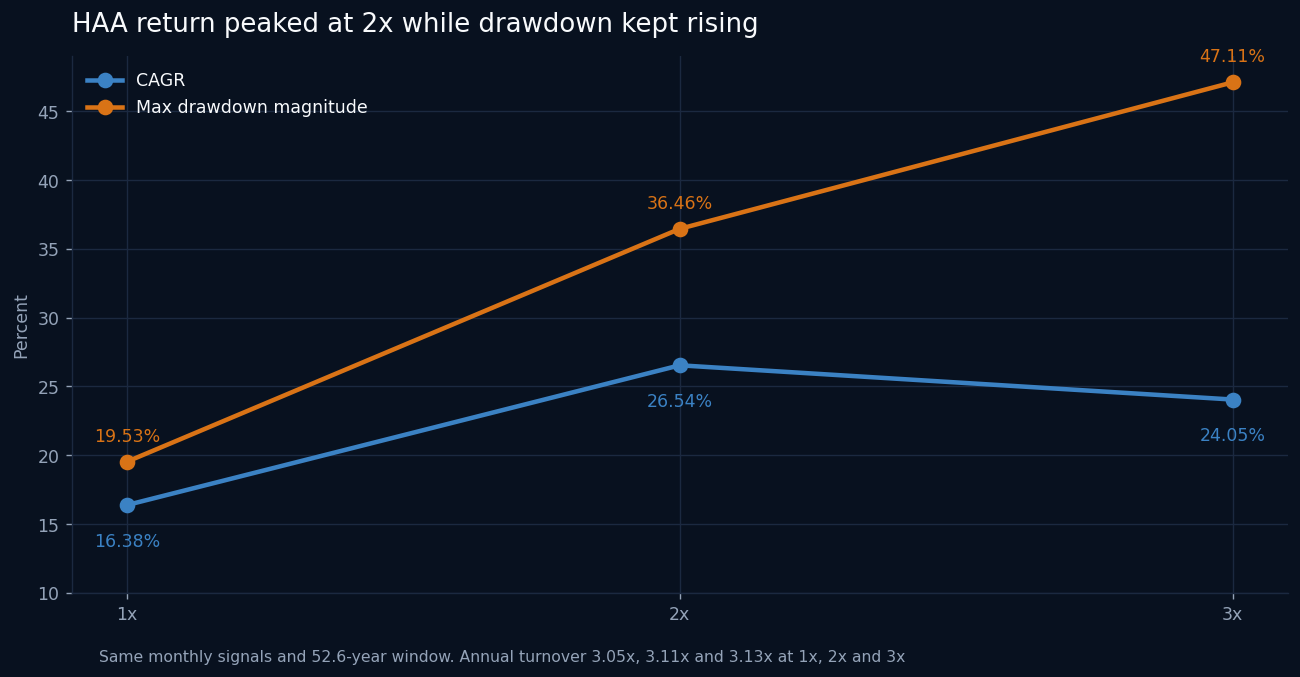
The 2x variant beat 3x CAGR by 2.49 percentage points. The 3x maximum drawdown was 10.65 percentage points deeper. Its volatility rose by another 2.30 points, while Sharpe declined from 1.04 to 0.88 and Sortino from 1.97 to 1.61.
That combination is the central result. Both variants carry about 1.8x exposure, so the gap compares leverage spread evenly with leverage concentrated in US stocks and long bonds. In this path the concentrated version had more risk and less compound return.
Why a 3x sleeve can trail 2x
The comparison does not isolate a single cause, but 3 mechanisms fit the result.
1. Compound return pays for variance. A deeper loss requires a disproportionately larger gain to recover. The extra daily movement in a 3x proxy raises the variance drag even when its arithmetic average return rises.
2. Leverage has a financing bill. Leveraged fund expenses and embedded financing consume more return as exposure rises. A rule that rotates about 3 times a year adds trading friction on top.
3. A monthly tactical signal cannot remove every fast decline. The portfolio can remain in a leveraged risk asset between evaluation dates or during a confirmation period. Raising the dose makes those unavoided days more important.
The backtest shows their combined historical outcome. It cannot allocate the 2.49-point CAGR gap among daily reset effects, financing, path order, and missed exits without a separate decomposition.
The 1x result still owns the best risk-adjusted record
The 2x variant has the highest absolute compound return. HAA Standard has the highest Sharpe at 1.10, the highest Sortino at 2.08, and the shallowest drawdown at -19.53%.
This creates 3 different answers depending on the investor's objective. The historical CAGR winner is 2x. The historical risk-adjusted winner is 1x. The 3x variant, with about the same average exposure as 2x but concentrated in fewer funds, wins on none of these measures.
What the match controls, and what it leaves open
Same dates and signals, and near-identical turnover, make this stronger than comparing unrelated strategies. The proxy mapping still prevents a pure scalar experiment. Assets without an eligible leveraged proxy remain at 1x, so the portfolio is not literally the standard return multiplied by 2 or 3 each day.
The 3 observed doses also cannot establish a universal optimum. A different history, financing spread, rebalance timestamp, or proxy set could move the peak. The 2x result is evidence from this specification and this path.
A leverage comparison checklist
- Hold the signal and date range constant.
- List every asset that receives a leveraged substitute and every asset that stays 1x.
- Publish financing, expenses, and turnover assumptions.
- Compare CAGR with Sharpe, Sortino, drawdown depth, and recovery time.
- Inspect whether the highest leverage also has the highest compound return.
HAA passes the most useful test in that list: the variants can be compared on common ground. On that ground, spreading the leverage (2x) delivered the highest historical CAGR, and concentrating about the same exposure in US stocks and long bonds (3x) delivered a deeper loss with a lower return.
Data sources
Past performance does not guarantee future results. Backtested results are hypothetical and do not represent actual trading.