A TIP canary improved the return of a leveraged trend sleeve by 5.25 percentage points a year in BestFolio's 2004 to 2026 reproduction. Its maximum drawdown moved only from -40.3% to -37.8%.
That pairing is the useful result. A signal can add a lot of return and still leave the worst crash almost intact.
The study grew out of a recurring question around Hybrid Asset Allocation, the strategy by Wouter Keller and Jan Willem Keuning, as credited on the live BestFolio card. HAA uses TIP as its canary. When TIP's 13612 momentum is negative, HAA leaves its offensive universe and chooses between intermediate Treasuries and bills. The live standard card covers February 1974 through August 2026 and reports 16.4% CAGR, a 1.50 Sharpe ratio, and a -19.5% maximum drawdown.
Isolate the canary
The research test used a faster version of the same idea. Both arms read a 200-day trend signal on SPY. The 2nd arm also required TIP to sit above its own 200-day average. That extra condition could send the portfolio defensive earlier. It could never force an earlier return to risk.
Everything else stayed fixed. The diversified risk-on sleeve held 75% UPRO, 10% ZROZ, and 15% GLDM. The defensive sleeve held 50% IEF, 25% GLDM, and 25% SGOV. Synthetic UPRO before inception included the federal funds rate, a 0.50% borrowing spread, and the fund expense ratio. Signals were computed at the close and filled at that same close.
| Sleeve and window | Baseline CAGR | With TIP | TIP effect | Sharpe | Max DD |
|---|---|---|---|---|---|
| Diversified, 2004 to 2026 | 15.31% | 20.56% | +5.25 pp | 0.69 to 0.94 | -40.3% to -37.8% |
| Diversified, 2010 to 2021 | 19.90% | 24.44% | +4.54 pp | 0.83 to 1.06 | -37.3% to -37.3% |
The 2010 to 2021 result deserves attention because it excludes both the financial crisis and the 2022 rate shock. The canary still added 4.54 points of CAGR. The annual average hides how that return arrived.
A few years did nearly all the work
| Year | Baseline return | With TIP | TIP effect | Read |
|---|---|---|---|---|
| 2008 | +11.5% | +11.5% | 0.0 pp | SPY trend had already moved the sleeve out |
| 2013 | +69.6% | +28.6% | -41.0 pp | TIP fired a costly false alarm |
| 2015 | -16.9% | +6.5% | +23.4 pp | The earlier exit avoided much of the selloff |
| 2018 | -20.7% | +46.5% | +67.2 pp | The rate-driven break produced the largest gain |
| 2020 | +14.8% | +14.8% | 0.0 pp | TIP rallied during the flight to safety |
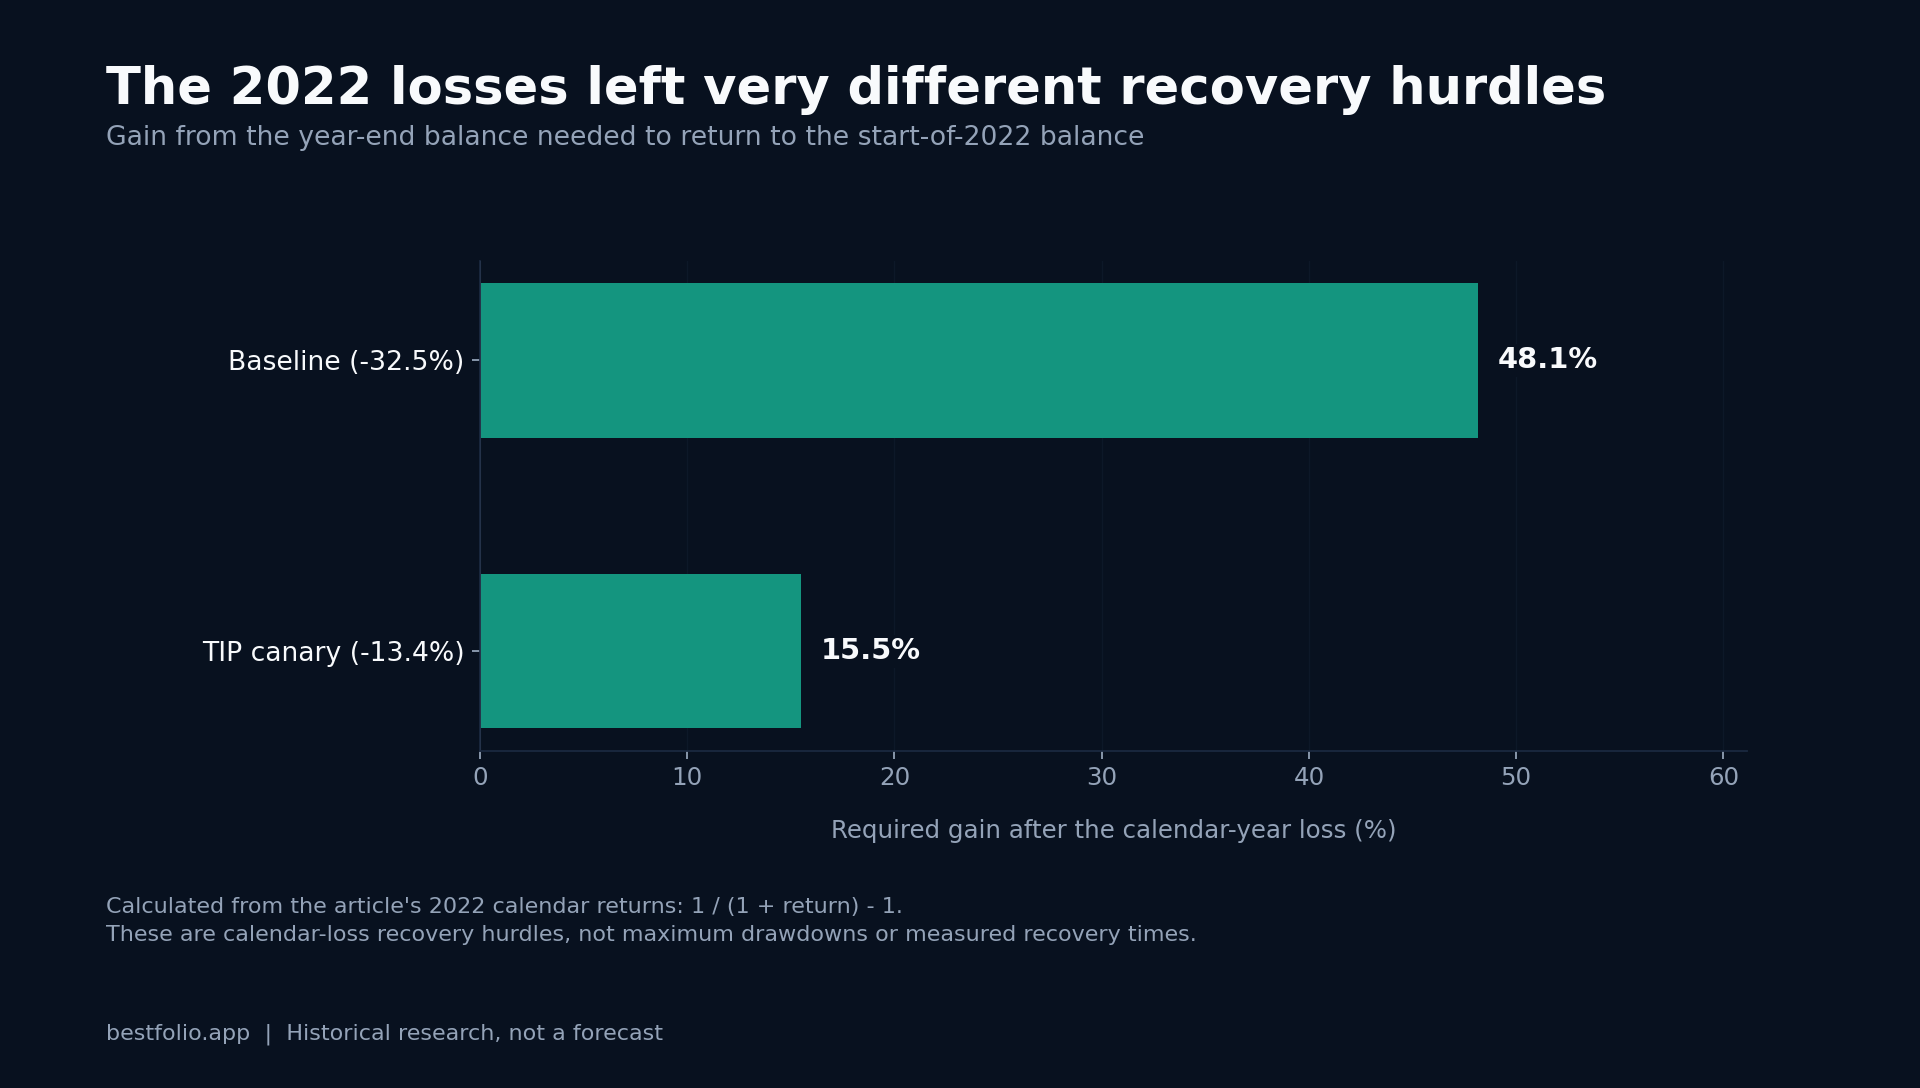
| 2022 | -32.5% | -13.4% | +19.1 pp | The canary reacted to rising real yields |
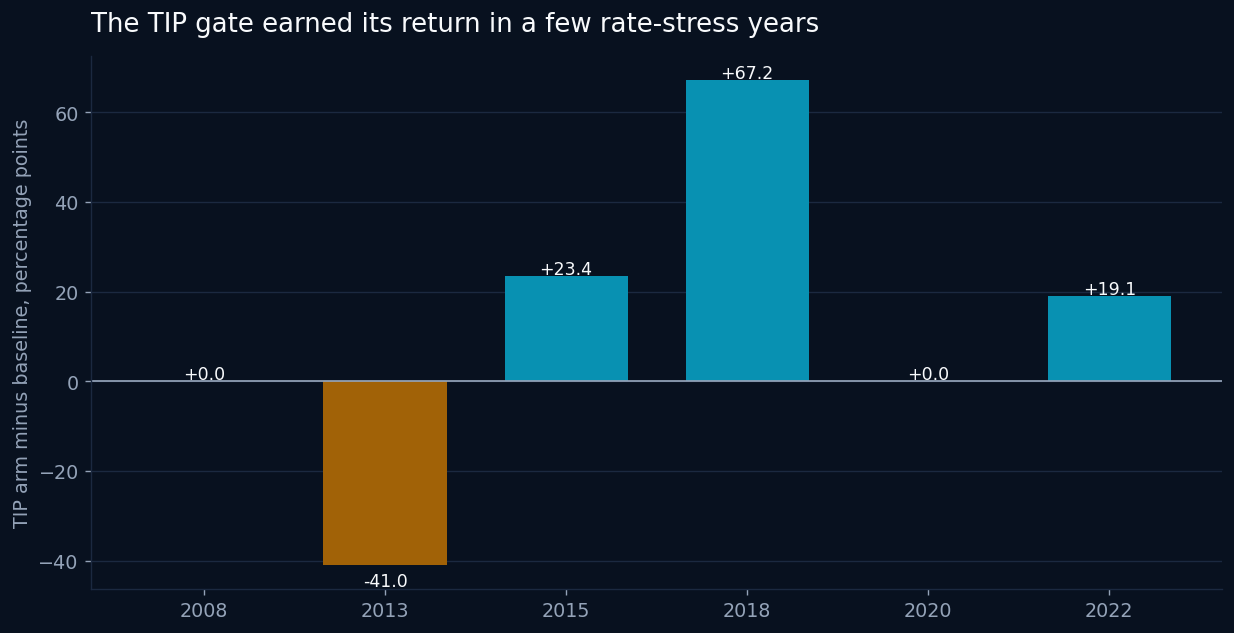
TIP added 0.0 points in 2008 and 2020. In both crashes, the ordinary equity trend rule carried the protection. TIPS held up during the flight to safety, so the canary had no extra warning to give.
The pattern reverses during rate stress. TIP reacts to real yields and inflation expectations, which made 2015, 2018, and 2022 the important years. The same sensitivity produced the 2013 mistake. This is a lumpy signal. Its average came from a few large decisions, including one decision that went badly wrong.
Why the deepest drawdown barely changed
The worst loss in the full sample still belonged to the financial crisis. The TIP condition did little in that event, so the deepest path stayed close to -40%. Sharpe rose from 0.69 to 0.94 because the canary changed several medium-sized rate episodes. The deflationary tail remained.
This distinction matters even more with leverage. Avoiding a 2018-style fall in a 2.4x sleeve compounds into a large return gap. Missing the protection in the single worst crash still leaves the investor with a drawdown that can end the experiment.
How this carries back to HAA
HAA's live rule uses monthly 13612 momentum on TIP, while the isolated study used a daily 200-day average. The timing differs. The economic job is the same: TIP watches the rate and inflation side while the offensive signal watches risky assets.
I would judge the canary on that narrower job. The evidence supports a rate-stress filter with a real but concentrated historical payoff. The equity trend rule still owns the crash response, and position size still has to survive the case where TIP stays quiet.
Past performance does not guarantee future results. Backtested results are hypothetical and do not represent actual trading.