TQQQ Quadrant Stack began as a portfolio shared in r/LETFs by u/Separate-Ad-9633. BestFolio reproduced the rules and credits the author on the strategy card. That origin matters because the portfolio was not designed to make a single backtest line look smooth. It was built around a practical question: how much concentrated leveraged equity can a diversified portfolio carry if the most dangerous exposures get their own trend gates?
The current card covers 30.7 years, from January 1996 through October 2026. It reports 19.94% annualized return, a 0.86 Sharpe ratio, 21.91% volatility, and a -37.39% maximum drawdown. Those results are attractive. The construction and the failure years explain what an investor would have to tolerate to reach them.
The base portfolio
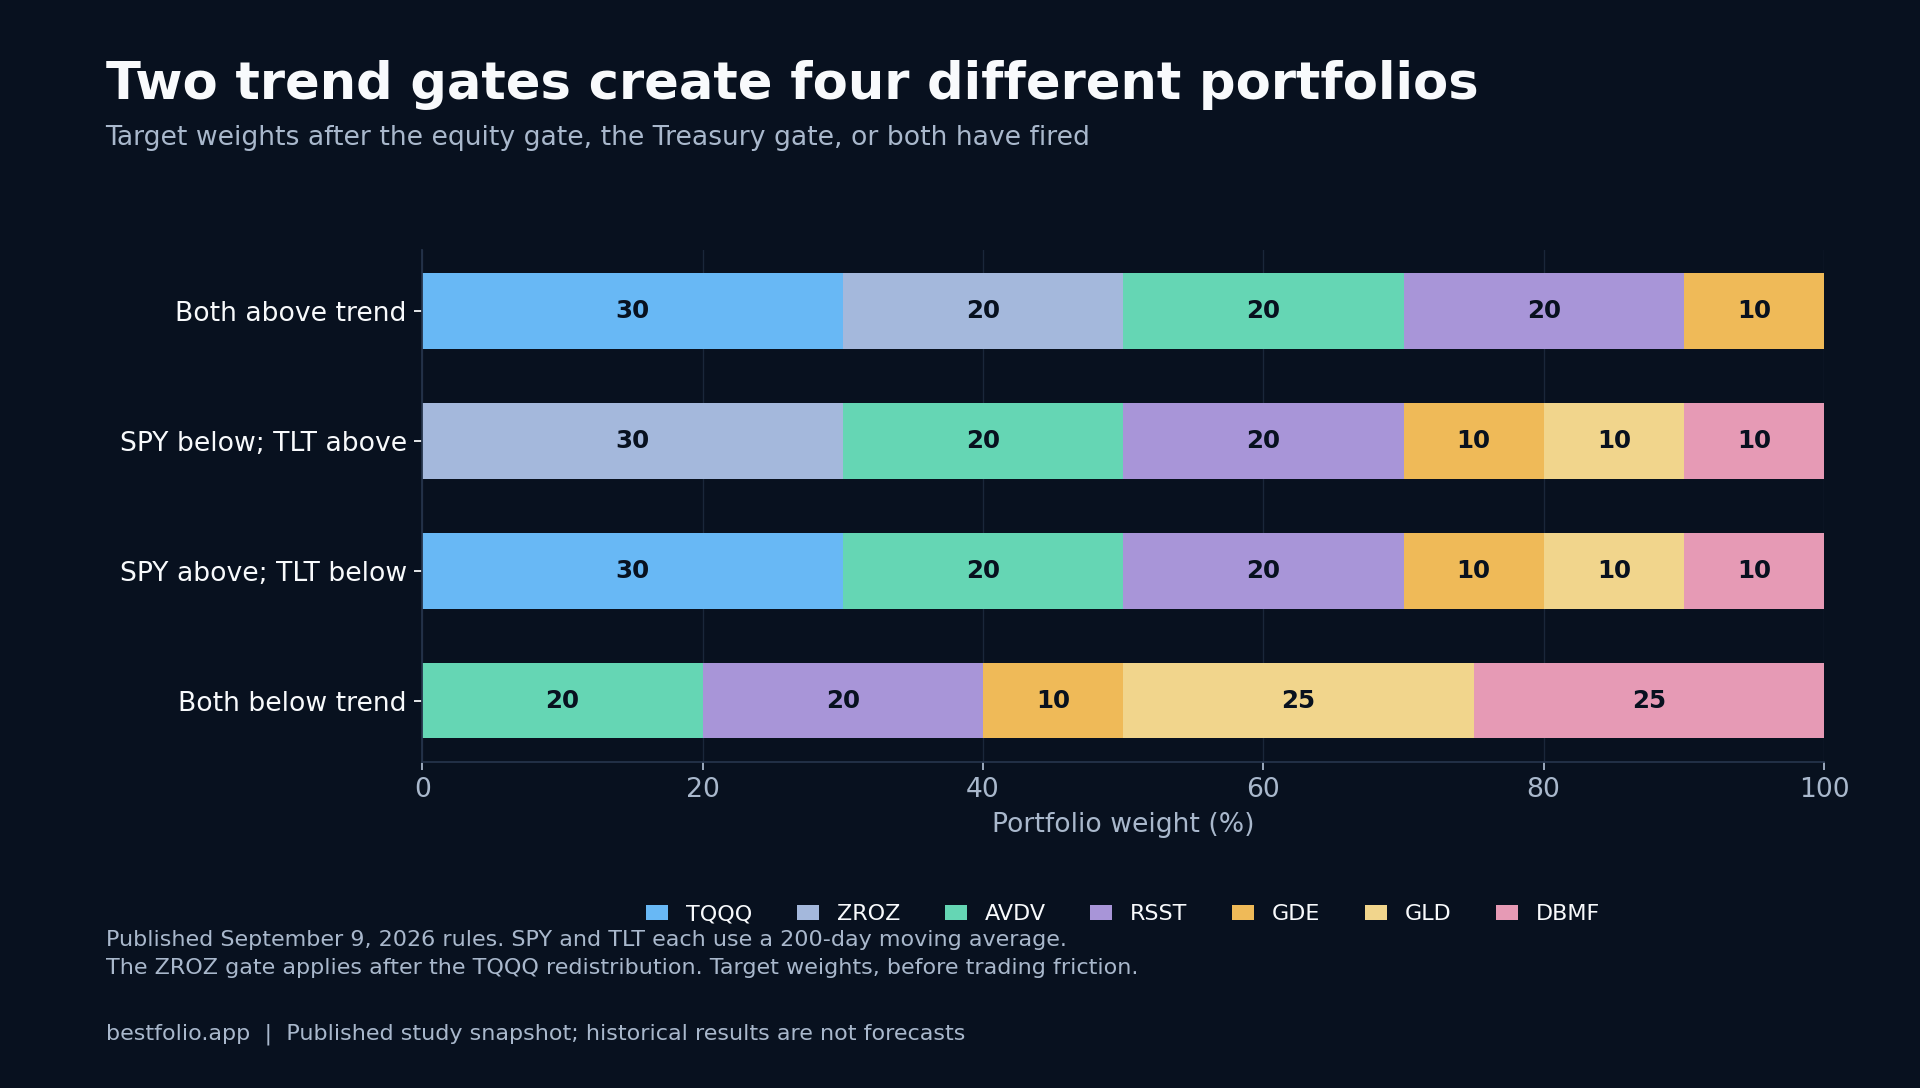
The starting allocation is 30% TQQQ, 20% ZROZ, 20% AVDV, 20% RSST, and 10% GDE. TQQQ supplies leveraged Nasdaq exposure. ZROZ supplies long-duration Treasuries. AVDV adds international small-cap value. RSST and GDE add return-stacked diversifiers. Half of the portfolio, AVDV, RSST, and GDE, never responds to the gates.
The other half has 2 separate controls. If SPY is below its 200-day moving average, the 30% TQQQ sleeve is divided equally among ZROZ, GLD, and DBMF. If TLT is below its own 200-day moving average, whatever ZROZ weight is present moves half to GLD and half to DBMF.
When both gates are off, the portfolio holds 20% AVDV, 20% RSST, 10% GDE, 25% GLD, and 25% DBMF. The risky assets do not move to cash. They move toward gold and managed futures, which are intended to carry a different return source during equity and bond stress.
Put together, the 2 gates create 4 possible books:
| SPY vs its 200-day | TLT vs its 200-day | What the book holds |
|---|---|---|
| Above | Above | Full base allocation: 30% TQQQ, 20% ZROZ, 20% AVDV, 20% RSST, 10% GDE |
| Below | Above | The 30% TQQQ sleeve is split equally among ZROZ, GLD, and DBMF |
| Above | Below | The ZROZ weight moves half to GLD, half to DBMF |
| Below | Below | Both redistributions at once: no TQQQ, no ZROZ in the book |
What the gates actually buy
The most useful comparison removes both gates while keeping the same base weights. On monthly marks, that static version suffered an -80.2% maximum drawdown. Daily marks reached -82.6%. The gated version cut the monthly figure to about -30.7% in the research run, while the live daily card now shows -37.39%.
| Quadrant mix | Max DD, monthly marks | Max DD, daily marks |
|---|---|---|
| Ungated, static weights | -80.2% | -82.6% |
| With both gates | about -30.7% (research run) | -37.39% (live card) |
That is a large improvement, but it is not a low-risk portfolio. The annual volatility on the current card remains 21.91%. A decline of more than 37% still asks for unusual conviction, especially when the rule is switching after prices have already fallen.
The gates also introduce a different failure mode: whipsaw. In 2018, the monthly strategy lost 16.8% while SPY lost 5.2%. In 2022, it lost 31.0% while SPY lost 18.6%. Stocks and bonds both challenged their trends, and the portfolio paid for moving between exposures without finding a durable safe regime.
Small rule changes are not free
Adding a 2% buffer around the moving averages sounds like a sensible way to reduce unnecessary switches. In the deep study it made the maximum drawdown worse, at -43.3%. Waiting for a wider confirmation band delayed some exits enough to outweigh the reduction in noise.
A 1-day execution delay reduced annualized return by about 0.9 percentage points. That does not invalidate the strategy, but it shows why a trend rule must define the signal timestamp and the trading timestamp separately. BestFolio's cards compute each signal at the close and fill it at that same close. That assumes you can act at the close on that day's data; in practice you would trade just before the close or in the next session, which is the gap a delay test measures. Our execution delay study puts one extra session at about 0.7 CAGR points for HAA.
Community credit and reproducibility
Publishing a community strategy creates 2 obligations. Obligation 1 is attribution. The credited author should remain attached to the rules as the strategy moves from a forum post into a formal card. Obligation 2 is reproducibility. The published version has to specify the weights, gate assets, lookback, replacement assets, rebalance timing, and behavior when both gates fire.
That precision makes disagreement productive. A reader can test the 200-day rule against another horizon, replace DBMF, apply a delay, or decide the concentration is too high. Without the full rule, the only possible reaction is to trust or dismiss a chart.
The useful conclusion
TQQQ Quadrant Stack does not make leverage safe. It changes the type of risk. The 2 gates dramatically reduce the catastrophic drawdown of the ungated mix, but the portfolio still has equity-like crashes, leveraged volatility, timing dependence, and years when both defenses get whipsawed.
The best case for the strategy is not its 19.94% annualized return. It is that the portfolio states exactly how it responds when the 2 most dangerous sleeves lose trend, while leaving the other half untouched. The best case against it is visible in 2018, 2022, the daily drawdown, and the delay test. Those are the numbers to size from.
Correction, 13 October 2026: the synthetic history of GDE before its March 2022 launch now matches the fund's 90/90 exposure (90% S&P 500 and 90% gold futures), so this strategy's card was rerun. The card figures above are restated from it: 18.48% a year, a 0.91 Sharpe, 22.28% volatility and a -37.19% maximum drawdown (was 18.57%, 0.91, 22.43% and -37.72%), over the card's current window. The research-run figures are as published.
Correction, 15 October 2026: the managed-futures history before KMLM and DBMF launched now uses the BTOP50 index, and volatility is now measured on observed prices, so months rebuilt from monthly data count at their month-end returns. The card was rerun, and the card figures above now read 19.04% a year, a 0.93 Sharpe and 21.90% volatility (was 18.48%, 0.91 and 22.28%), with the same -37.19% maximum drawdown. The research-run figures are as published.
Past performance does not guarantee future results. Backtested results are hypothetical and do not represent actual trading.