A maximum drawdown looks like one objective number. It is not. The result depends on how often the portfolio is observed. A monthly series sees the account at month-end. A daily series sees every close between those points. If the portfolio falls sharply and partly recovers before the month ends, the monthly maximum drawdown misses part of the loss an investor actually experienced.
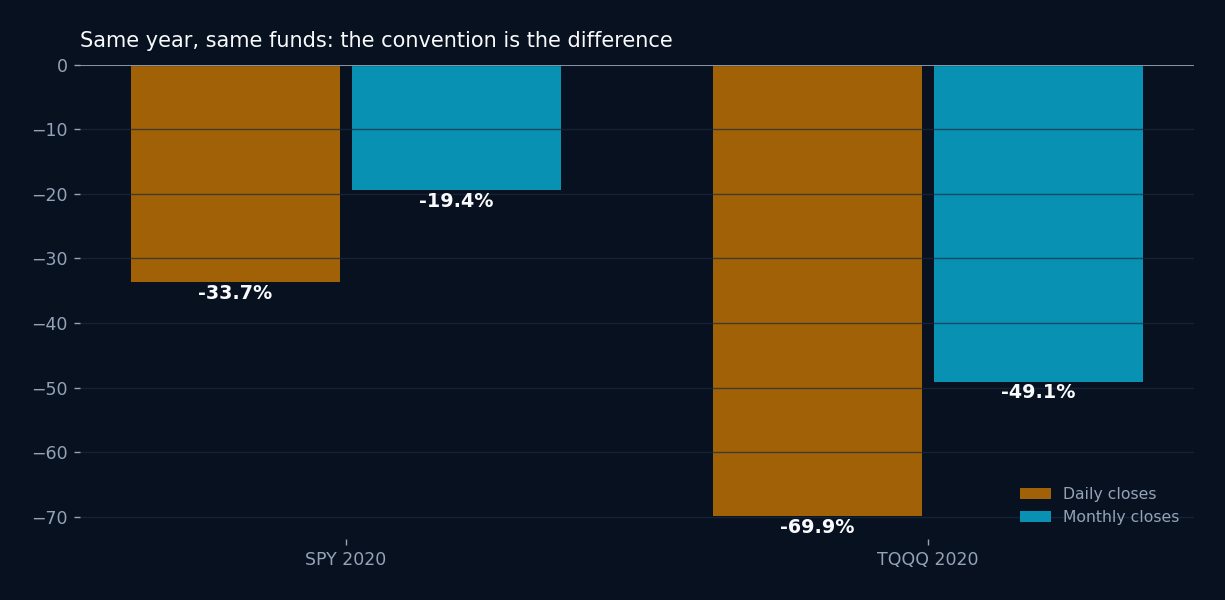
| Fund, 2020 | Max DD, daily closes | Max DD, monthly closes | Gap |
|---|---|---|---|
| SPY | -33.7% | -19.4% | 14.3 points |
| TQQQ | -69.9% | -49.1% | 20.8 points |
Both rows come from the same adjusted daily closes in BestFolio's production price database, recomputed both ways for this post. Nothing about the funds changed between the columns. SPY's monthly series reports -19.4% because part of the fall had already been recovered by the month-end close; the daily series saw the full -33.7%. TQQQ stretches the gap to 20.8 points, with leverage amplifying exactly the kind of fast fall-and-rebound that month-end sampling steps over.
TQQQ Quadrant Stack shows the same effect at the strategy level. The research run reported about -30.7% maximum drawdown on monthly marks. The live card, computed from the daily path, reports -37.38%. Same strategy. The extra 6.68 percentage points come from observing what happened inside the month.
The difference becomes more severe when leverage, volatile diversifiers, or fast reversals are involved. It also changes how we compare a tactical strategy with its benchmark.
How maximum drawdown is calculated
At every observation, the calculation records the highest portfolio value reached so far. Drawdown is the percentage decline from that running peak. Maximum drawdown is the lowest point in the full drawdown series.
Nothing in that definition chooses the observation frequency. Feed it monthly returns and it finds the worst month-end path. Feed it daily returns and it finds the worst daily-close path. Both computations can be correct while answering different questions.
Neither one captures an intraday low. A daily-close drawdown can still understate the loss seen during the session. The important rule is to label the frequency and apply it consistently.
Why monthly systems often report monthly pain
Many tactical strategies rebalance monthly, and their source research is published as a monthly return series. Using month-end net asset values makes the backtest reproducible and aligns the performance series with the decision frequency.
That convention is useful for the allocation rule, but the investor owns the portfolio every day. A monthly strategy can hold a leveraged ETF, a long-duration bond fund, or gold through a large mid-month move. The absence of a rebalance does not remove the economic drawdown.
For TQQQ Quadrant Stack, the ungated comparison makes the issue obvious. The static mix reached -80.2% maximum drawdown on monthly marks and -82.6% on daily marks. At that scale, both numbers describe a portfolio-ending experience for many investors, but the daily figure is still the more complete path.
The convention changes rankings
Sampling frequency does not add the same amount to every strategy. A low-volatility monthly bond rotation may have a small daily adjustment. A leveraged allocation that falls and rebounds quickly can have a much larger one. If one card uses monthly marks and another uses daily marks, ranking them by maximum drawdown is not a fair comparison.
The same problem affects recovery time. A monthly series dates the trough and recovery at month-end. A daily series can find an earlier low, a later full recovery, or both. The investor's lived path follows the higher-frequency series even if the rule itself only trades monthly.
What BestFolio should show
The headline card should use a consistent convention across strategies wherever the underlying history supports it. The methodology should state the observation frequency. When only monthly reconstructed data exist, the card should say that the result is month-end maximum drawdown rather than implying a daily path.
For deep histories, this creates an unavoidable split. The early proxy chain may exist only monthly, while modern ETFs exist daily. Splicing daily and monthly drawdowns into one headline can give the recent period more opportunity to record pain than the early period. A transparent card should identify that limitation.
The solution is not to discard monthly backtests. It is to separate 3 facts:
- The strategy's rebalance frequency.
- The return series frequency used for the long reconstruction.
- The observation frequency used for the headline maximum drawdown.
A better way to compare
When 2 strategies have daily histories, compare daily maximum drawdown. When the long history is monthly, compare both strategies on monthly marks and label the result. If a daily overlay is available for the modern period, show it as another risk statistic rather than silently replacing the long-history convention.
For a monthly investor, the daily figure is not noise. It is a behavioral stress test. A portfolio that closes the month down 20% after falling 35% still required the investor to live through 35%.
TQQQ Quadrant Stack did not become a different strategy when the sampling frequency changed. The reported pain became more complete. That is the purpose of the convention: not to punish a strategy, but to stop a month-end series from hiding the path between statements.
Read the BestFolio metrics methodology.
Past performance does not guarantee future results. Backtested results are hypothetical and do not represent actual trading.