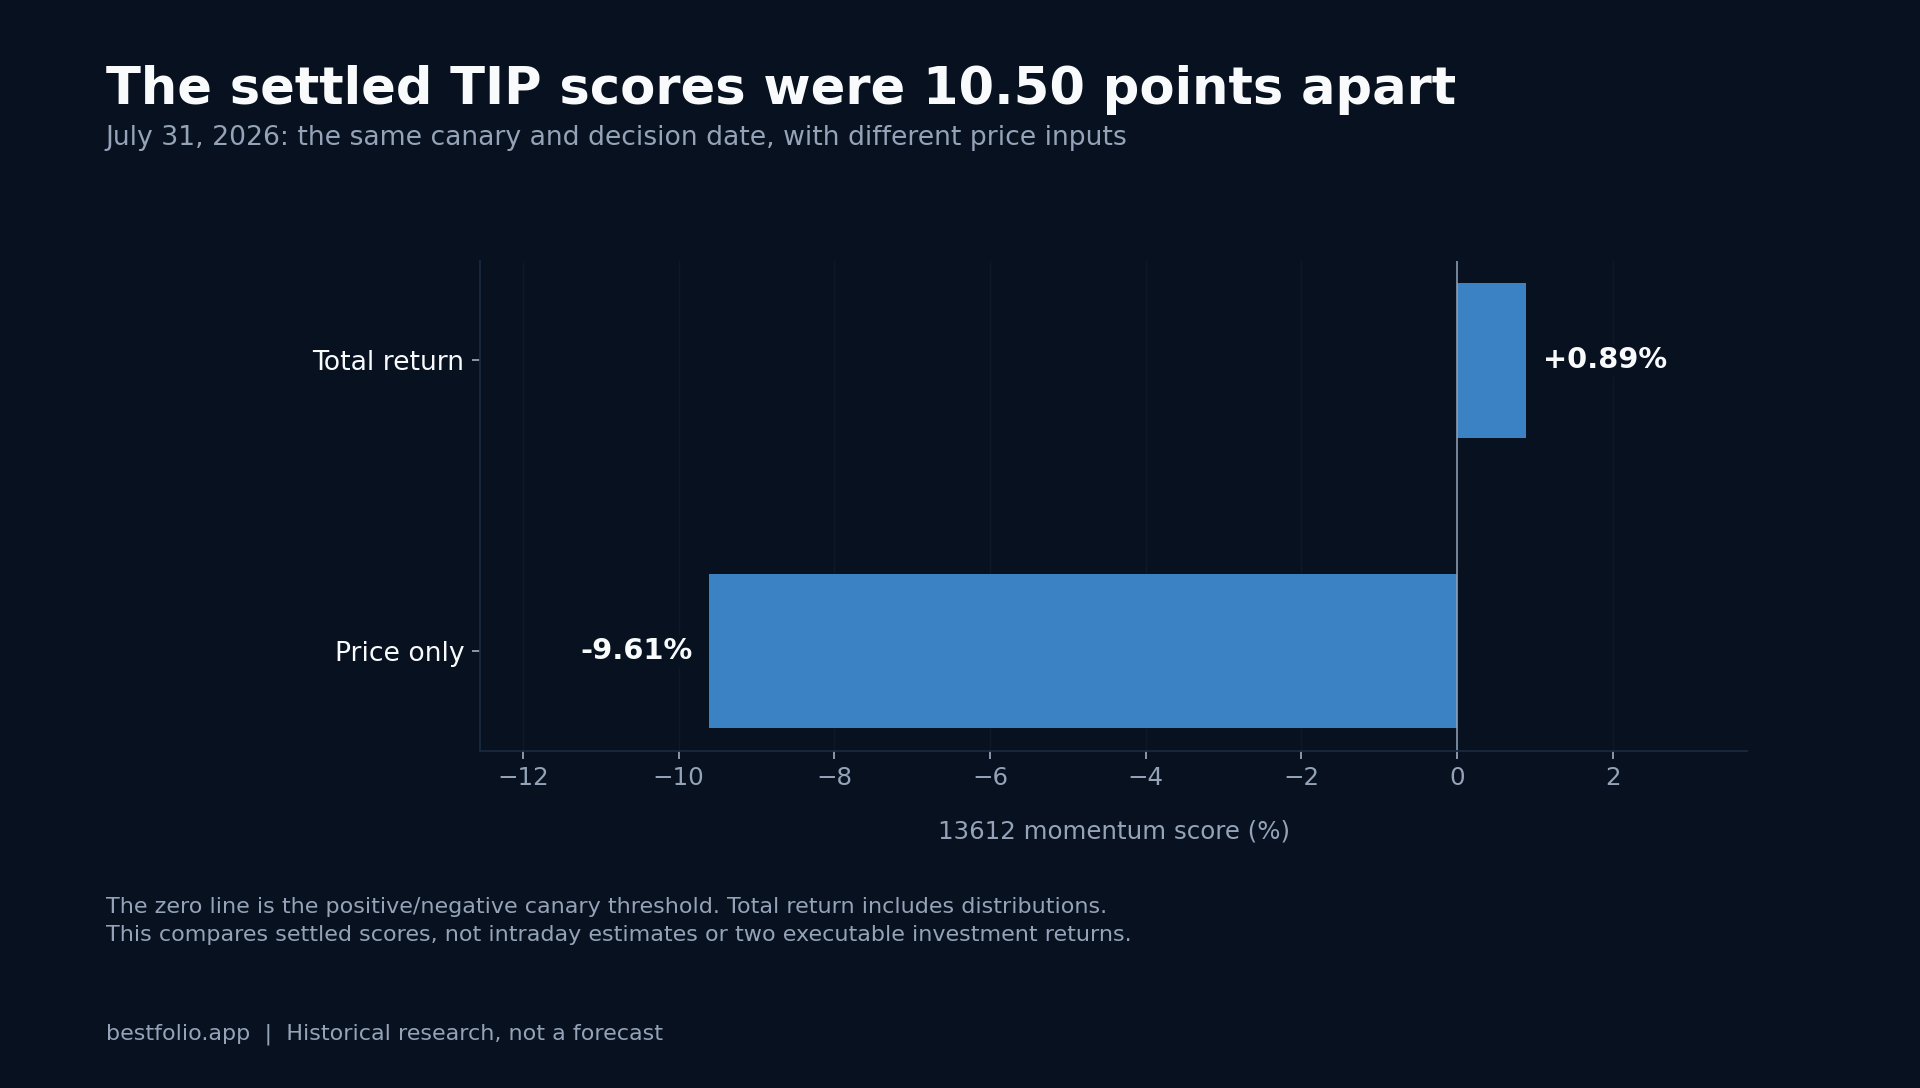
On July 31, 2026, the canary signal inside Wouter Keller and Jan Willem Keuning's Hybrid Asset Allocation read +0.89%. On the same day, from the same ETF, it also read -9.61%. The first number keeps the strategy fully invested. The second sends it 100% defensive. Both numbers are "correct" for the dataset that produced them, and that is the problem this post is about.
The canary in 30 seconds
HAA uses TIP, the iShares TIPS ETF, as its canary asset. Each month it computes TIP's momentum score, defined as the sum of the 1, 3, 6 and 12-month returns (Keller and Keuning call this the 13612 filter). Score at or above 0: hold the offensive universe. Score below 0: move everything to the best defensive asset. One number, computed once a month, controls the whole allocation.
That design concentrates all of the strategy's regime risk into a single threshold. And this summer, that threshold sat almost exactly at 0.
Trap 1: total return vs price-only
TIP's 2026 distribution calendar has been lumpy. It paid nothing from February through April, then $0.561 per share in May, $1.278 in June and $1.058 in July, a consequence of how inflation adjustments flow through the fund's income. If your data feed tracks total return (adjusted closes), those payouts are part of TIP's return. If it tracks price only, they simply vanish.
Run the canary on both series as of the July 31 close and the gap is not subtle. Total-return data puts the 13612 score at +0.89%. Price-only data puts it at -9.61%, because the missing distributions compound across all 4 momentum windows. Same ticker, same day: one dataset says risk-on, the other says the crash protocol is live.
Anyone running HAA off a price-only series spent this summer defensive while total-return implementations stayed invested. Neither made an arithmetic error. They fed the same rule different histories. Bond and TIPS ETFs are where this bites hardest, since distributions carry a large share of total return, but the same trap exists in any dividend-paying sleeve.
Trap 2: intraday vs settled
The second way to get 2 answers from one signal is to ask before the market has finished speaking. During the final session of July, an intraday reading of the canary dipped below 0. At the close, TIP finished the day at -0.10% and the settled score printed +0.89%. A monthly system that sampled its signal mid-session that afternoon would have flipped defensive on a number that never existed at settlement.
Near a threshold, this is not a rounding concern. It is the difference between holding equities through a rally and sitting in cash watching it.
July 31, minute by minute
The last day of July shows how thin the margin was. The TIP price that separated a positive canary from a negative one that day was $107.39. TIP opened at $107.48, above the line. By noon New York time it had slipped to $107.385 and the signal read negative, and it stayed negative until about 1:30 PM. The 2:30 PM close was $107.395, less than half a cent above the line. The decisive move only came at the end of the session, a push to the official close of $107.63. Anyone who checked the signal over lunch saw risk-off. The settled close said risk-on, by 22 cents.
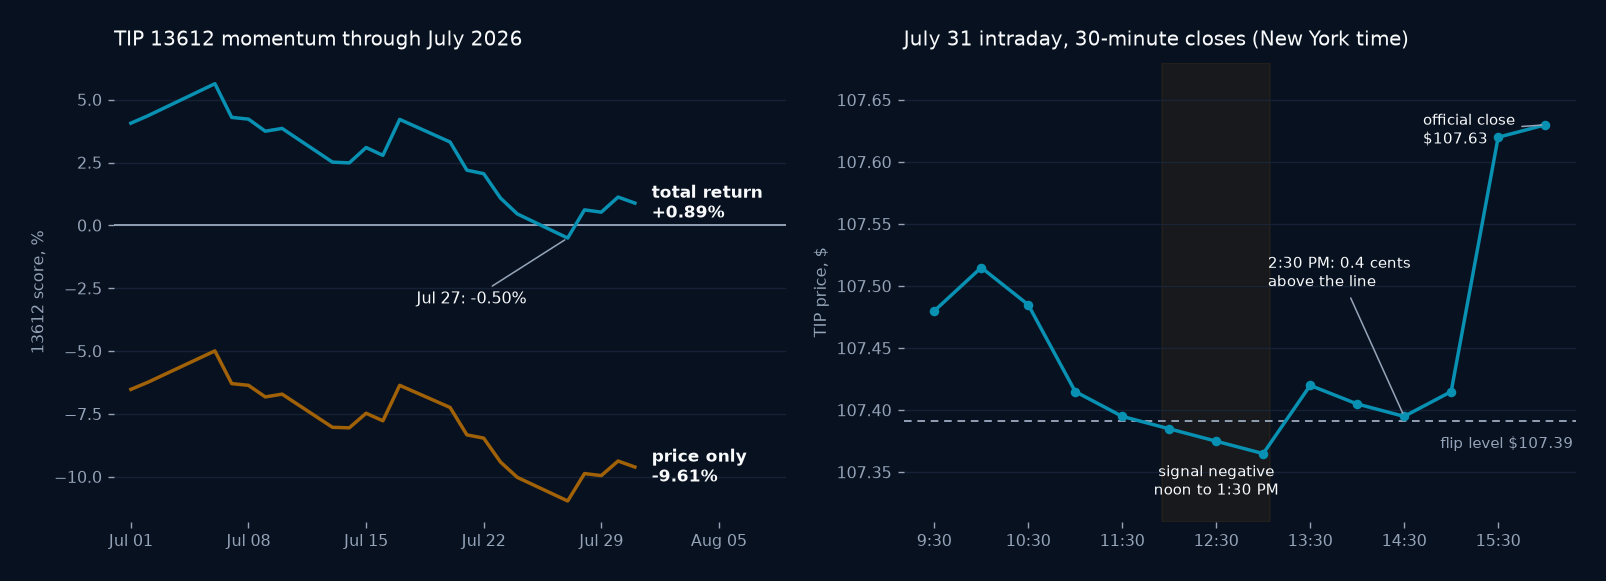
The month around it was no calmer. The total-return score printed -0.50% on July 27, was back at +0.62% a day later, and finished the month at +0.89%. 5 of the final 6 sessions ended within 1 point of the flip line. A monthly strategy asks you to act on exactly one of these readings, and July picked the one that settled 22 cents into positive territory.
What we changed on our side
Our own pipeline hit a version of this edge in July, which is why the platform now defers month-end signal computation until every fund in a strategy's universe has an official settled close, as noted in the changelog. Previews can use live prices; anything that persists or alerts waits for the settled data. The cost is a slightly later signal. The benefit is that the signal you act on is the one the strategy actually produced.
If you run this yourself
3 habits cover most of the risk. Use adjusted, total-return series for every signal input, and be especially suspicious of price-only data on bond and TIPS funds. Compute monthly signals from settled closes, not intraday snapshots, no matter how tempting the afternoon peek is. And when a canary-style score lands within about 1% of its threshold, treat it as a coin resting on its edge: check both versions of the data before trading, because that is exactly when they disagree.
The numbers above are reproducible from public data: monthly closes, adjusted and unadjusted, through July 31, 2026, with the 13612 score computed as the sum of the 1, 3, 6 and 12-month returns.
Educational information only, not investment advice. Past performance does not guarantee future results.
| Settled input | TIP 13612 score |
|---|---|
| Total return | +0.89% |
| Price only | -9.61% |
| Difference | 10.50 percentage points |