A safe withdrawal rate depends on the return sequence, the retirement start date and the inflation series used to raise spending. A correction to our century-scale calculations changed all five affected strategy rows. Three rates rose and two fell, even though the portfolio NAV histories stayed the same.
Correction incorporated September 15, 2026: the earlier article described these rows as using recorded inflation. In fact, a history-coverage rule discarded the CPI series, which began in 1947, and substituted a flat 3% inflation path for their whole history. The September 6 audit restated the figures using recorded US CPI-U back to 1913. The corrected results are now in the article itself.
What the withdrawal measures mean
The 30-year safe withdrawal rate is the largest initial annual withdrawal, raised with the modeled inflation path, that avoids exhaustion in every tested 30-year retirement window. The perpetual withdrawal measure additionally requires the ending portfolio to preserve its starting purchasing power over those tested windows. Its name does not establish that any rate will last forever.
The five corrected rows
These are the September 6, 2026 audit values. Each strategy retains its own original history, so the table measures the effect of fixing inflation inputs; it is not a matched-window strategy ranking.
| Strategy | Old SWR | Corrected SWR | Old perpetual rate | Corrected perpetual rate |
|---|---|---|---|---|
| UIS Standard | 2.72% | 2.27% | 0.00% | 0.00% |
| Paired Switching | 2.91% | 2.50% | 1.86% | 1.09% |
| Classic 60/40 | 2.70% | 3.31% | 1.41% | 1.57% |
| Century Momentum Standard | 4.99% | 6.57% | 4.74% | 6.43% |
| Century Momentum Cash Defensive | 4.54% | 5.66% | 4.22% | 5.48% |
The difficult retirement start changed too
The binding cohort is the retirement start that sets the lowest sustainable rate in the test. Correcting the inflation path moved that start in four of the five affected backtests. UIS remained January 1941. The chart shows the exact months, which a single withdrawal-rate column cannot reveal.
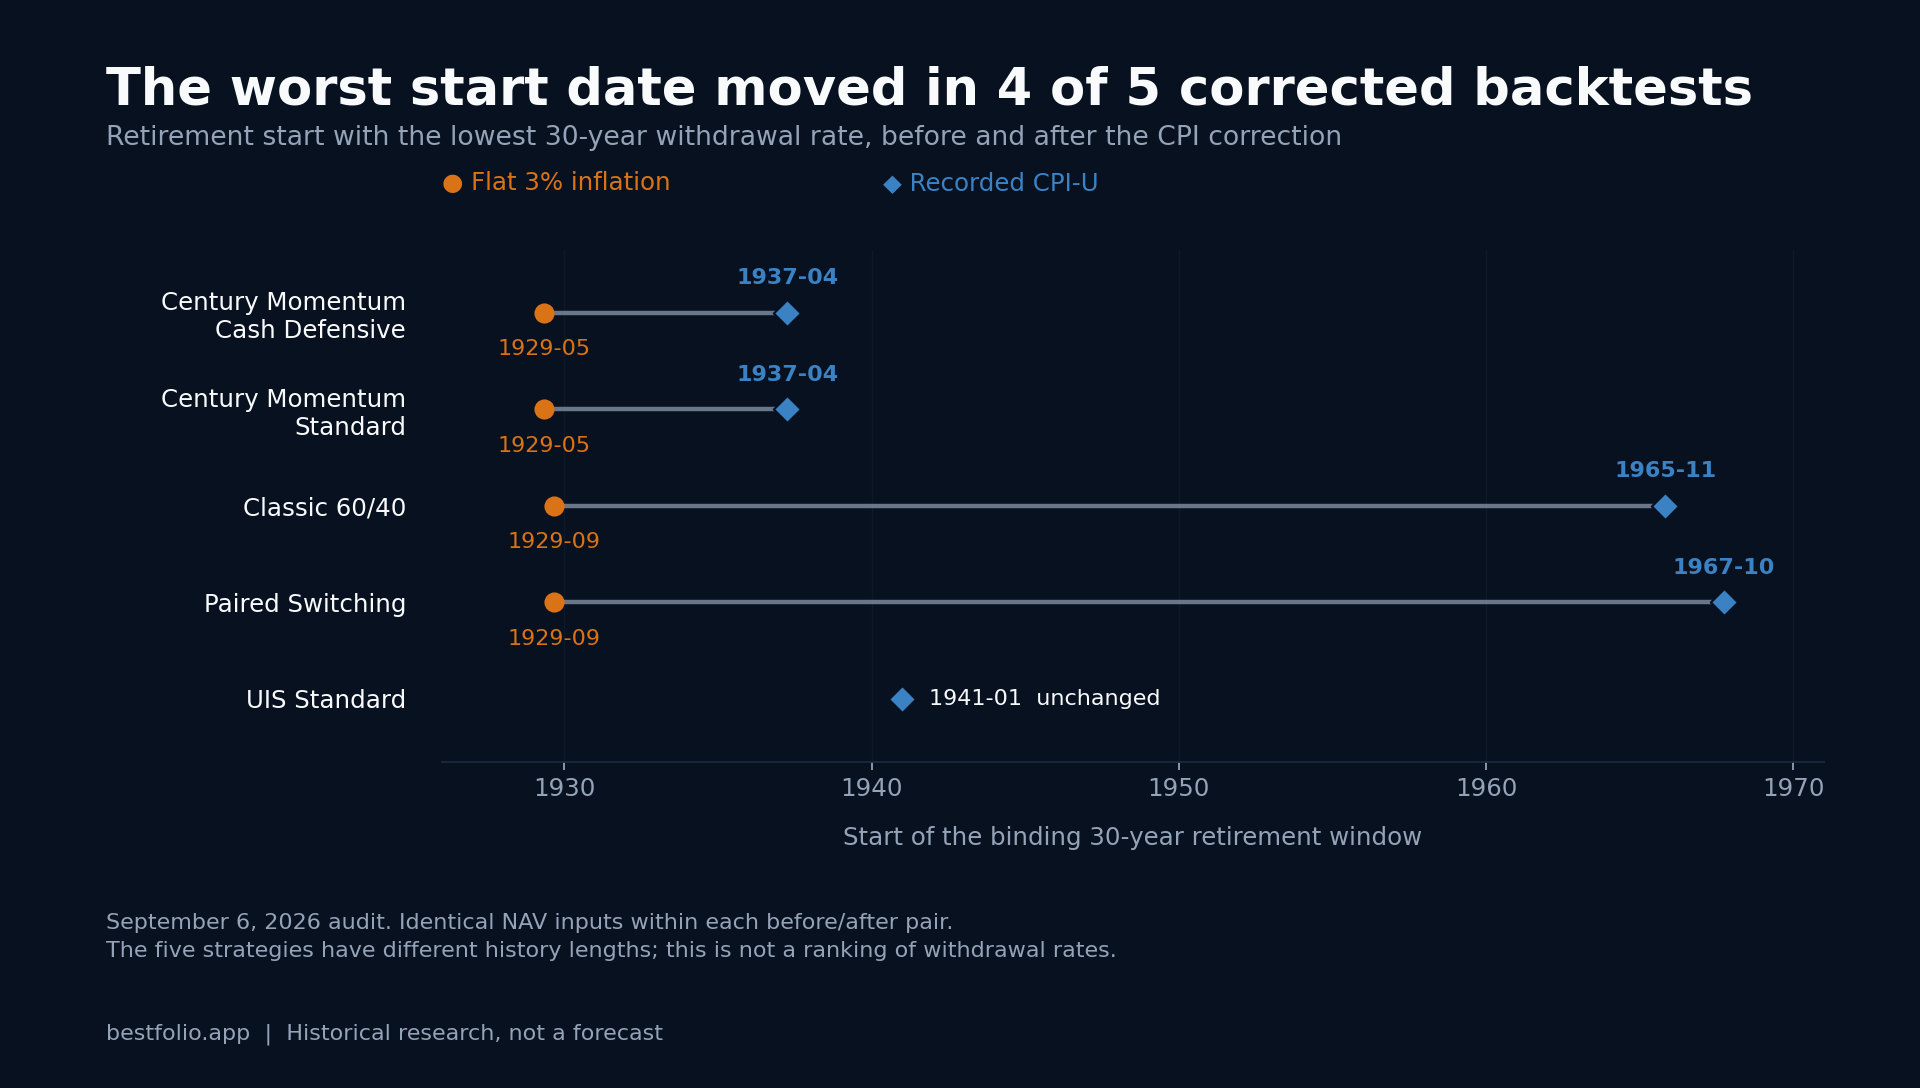
Recorded deflation in 1929–1933 reduced the nominal withdrawals needed to maintain purchasing power in those Depression cohorts. That raised the audited floors for the equity-heavy century rows and moved their binding starts to 1937 or 1965. For the bond-rotation rows, the correction made historical inflation more demanding than the old fixed path, and the rates fell. A more accurate input does not always make a backtest look worse.
What changed in the method
The inflation history now uses FRED CPIAUCNS from January 1913, spliced onto CPIAUCSL from 1947. Withdrawals use the recorded ratio inside each retirement window. The fixed 3% fallback applies only when that particular window lacks coverage.
Backtests starting in 1947 or later did not change because of this CPI coverage fix. Their live values can still move when the nightly NAV extension adds observations. The separate extension through the 1970s examines a different question: what happens when the return history includes an earlier retirement cohort.
What survives the correction
Sequence and inflation risks belong together. A strategy's return average cannot establish its retirement spending capacity. Neither can a backtest that skips an important inflation regime. The original article's cross-strategy distribution and broad tactical-versus-passive uplift are withdrawn here because that aggregate comparison has not been rebuilt with a common window after the correction.
Use these figures to understand the sensitivity of a historical test, then inspect the methodology, proxy history and assumptions behind the strategy you are studying. Personal taxes, broker costs, changing spending needs and future regimes can all differ from the model.
Educational research, not a recommended withdrawal rate or personalized investment advice. Backtests are hypothetical; past performance does not guarantee future results.