There was a thread on r/Fire last week with 240 upvotes and a simple worry behind it. The poster is about to retire after a 20-year career, understands the 4% rule, and keeps coming back to one person: the year 2000 retiree.
You can watch that retiree's portfolio on the Engaging Data visualizer. $2 million in an 80/20 portfolio, 4% withdrawals with inflation bumps. After 4 years: about $1.2 million. After 9 years: $780k. After 23 years: roughly $600k. And then the chart stops, because the tool's data ends in 2023.
The OP asked the obvious question, and nobody in 246 comments answered it with numbers: does that retiree actually make it through the full 30 years?
We ran it. Here is the answer, and then the more useful question behind it.
What happened after 2023
The cohort survives. On an 80/20 portfolio with 4% plus inflation adjustments, the $2 million becomes about $1.54 million nominal by mid-2026, which sounds almost fine until you deflate it: that is 39% of the starting purchasing power, funding a withdrawal that has grown to $158,000 a year. The low point was roughly $859,000 in February 2009. And of the 319 months of retirement so far, 317 were spent below the starting balance.
Surviving is not the same as feeling fine. This cohort spent essentially its entire retirement watching the balance shrink. The 4% rule "worked" in the way a parachute that opens at 200 feet works.
Why 2000 and not 1987 or 2020
The 2000 retiree is the modern stress test because both halves of the disaster hit the same cohort. The dotcom bear took the S&P down about 49% over 2000-2002, and before the portfolio could rebuild, 2008 took another 57% slice off the top. Two deep bears inside the first 9 years, which is exactly the window where withdrawals do permanent damage.
That is sequence risk in one sentence: the same average return, delivered in a different order, produces a completely different retirement. Early losses plus fixed withdrawals convert temporary drawdowns into permanent capital loss. You are selling the most shares precisely when they are cheapest.
The same cohort, tactical
Here is the question we actually wanted to answer. Suppose the 2000 retiree had run a defensive tactical strategy instead of a static 80/20. Same $2 million, same 4% + inflation withdrawals, same dates.
| Portfolio | End balance (nominal) | End purchasing power vs start | Lowest point | Months below starting value |
|---|---|---|---|---|
| 80/20 (control) | $1.54M | 39% | $859k (Feb 2009) | 317 of 319 |
| Permanent Portfolio | $4.10M | 104% | $1.83M (Jul 2002) | 44 of 319 |
| GEM | $9.94M | 251% | $1.67M (Oct 2000) | 47 of 319 |
| HAA | $24.9M | 629% | $1.90M (May 2001) | 29 of 319 |
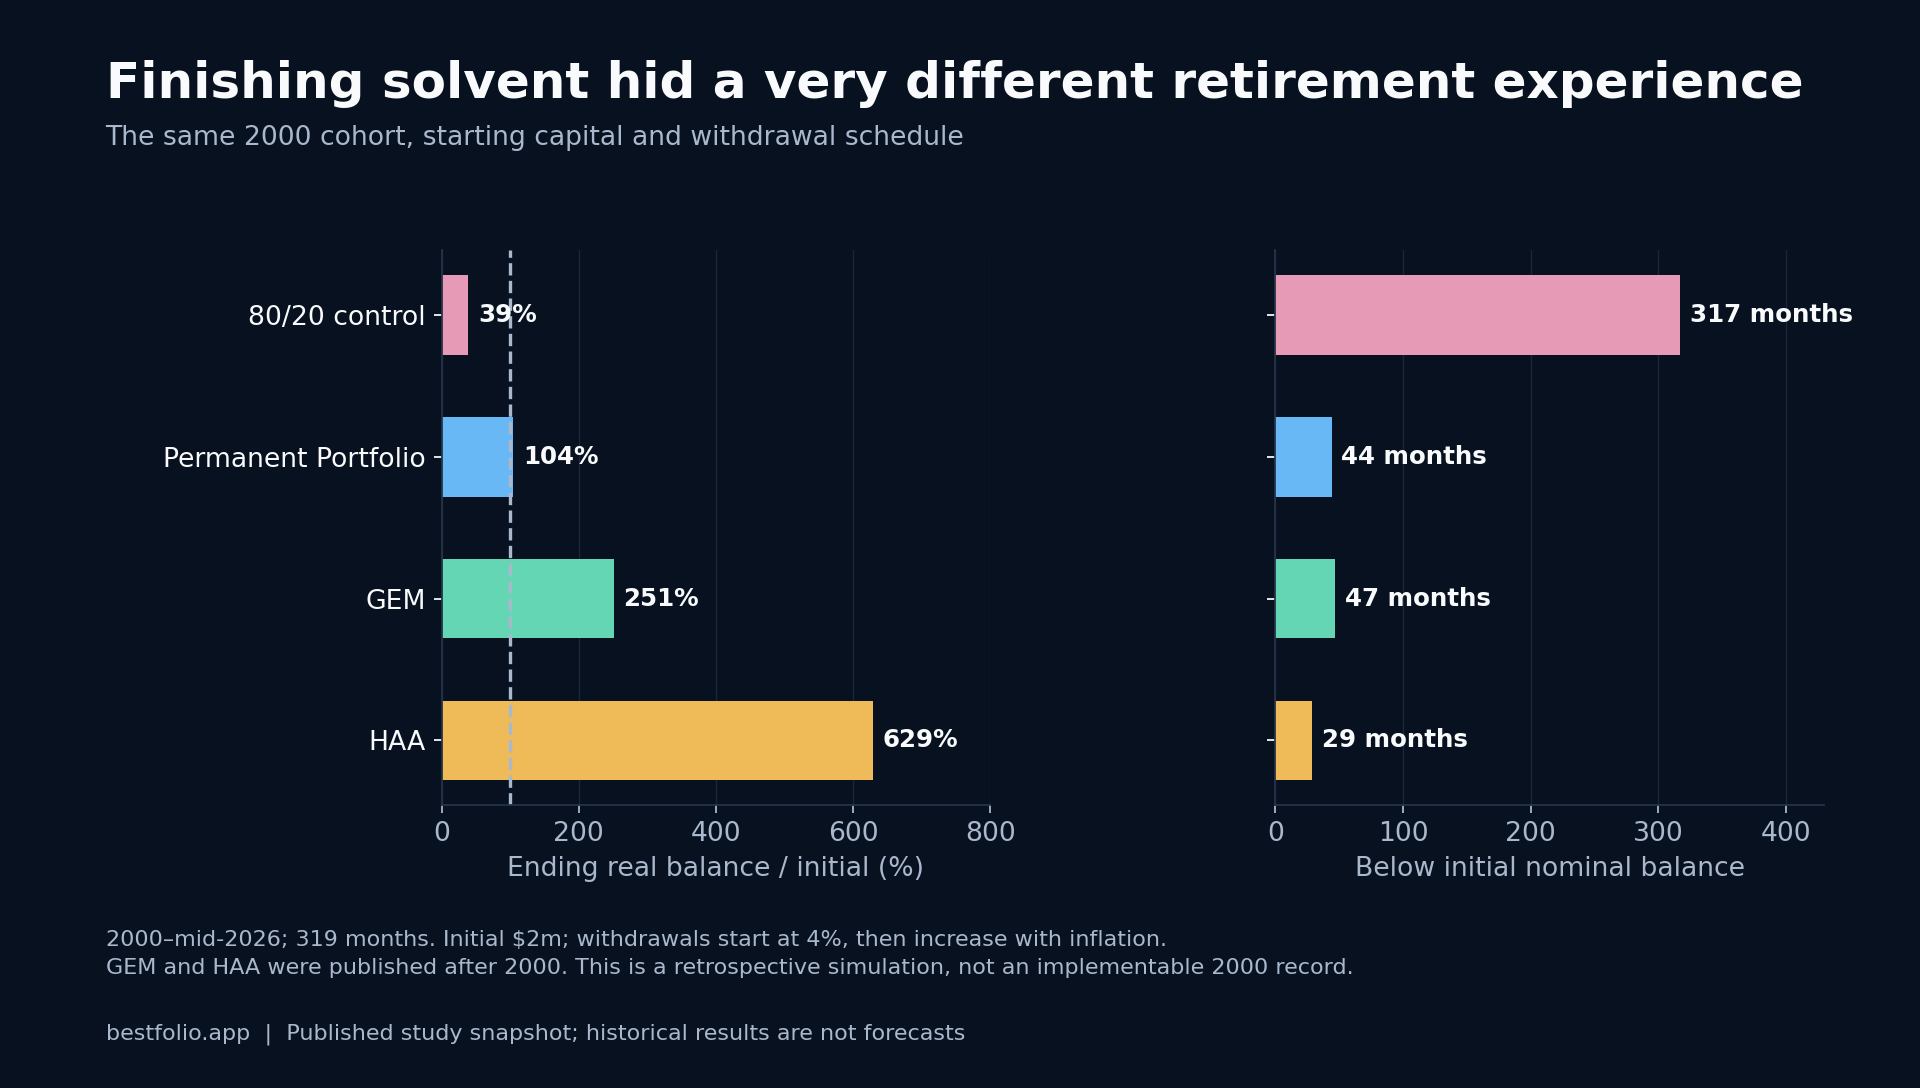
Read the last column before the first one. The 80/20 retiree spent 26 years underwater; the Permanent Portfolio retiree spent 44 months there, bottoming at $1.83 million in July 2002 and ending with more purchasing power than they started with. That is what removing the deep drawdowns does to a withdrawal engine, even for a portfolio whose CAGR nobody brags about.
The mechanism is not magic. Trend and momentum rules moved these strategies partly or fully out of equities during 2001-2002 and 2008. Missing the middle of those two bears means the withdrawal engine keeps selling assets that have not collapsed. The cost is whipsaw in the sideways years, and you can see that cost in the table too. It is real, and it is much smaller than the thing it protects against in this specific cohort.
What this does not prove
Honesty section. HAA was published in 2023. GEM in 2013. Running them across 2000-2013 is a backtest on data their authors could see, not an out-of-sample track record. The rules are simple and were not fit to this window specifically, but a skeptic should discount the exact numbers and keep the shape: mechanical de-risking rules cut the left tail of sequence outcomes, at the price of some average return.
Second honest point: a real 2000 retiree had cheaper options than a time machine. Cutting spending 15% for two years, or earning a little side income in 2002, changes the trajectory almost as much as the strategy choice. The r/Fire crowd is right about that. Strategy selection and spending flexibility are not competing answers; they attack the same tail from two sides.
If you are the 2026 version of that retiree
The 2026 parallels write themselves: high CAPE, an AI capex boom, a two-year melt-up behind us. Maybe it resolves like 1996 (years of gains left) and maybe like 2000. Nobody knows, which is the point. A retirement plan that only works if the next decade looks like the last one is not a plan.
Three things that survive contact with a 2000-style decade: a withdrawal rate with margin, spending you can actually flex, and an allocation that has a rule for getting defensive that does not depend on your nerve in month 18 of a bear. For the third one, our strategy catalog shows the full drawdown history of every rule we track, and the drawdown analyzer will show you what any ETF portfolio did through 2000-2013, not just its CAGR.
Related reading: our safe withdrawal rate study across 50+ TAA strategies and the 1974 extension through stagflation.