A subscriber sent us a write-up they liked. The author had built a portfolio on a paid TAA tracking platform by blending three of its tactical strategies through the platform's optimizer, and the combined result looked genuinely strong: about 16% annual growth since 1971 with a worst drawdown near -9%. The question for us was simple. One of the three strategies is closed, its rules are private. Could we add it to BestFolio anyway?
Short answer: no, and nobody else can either. The strategy's author shared the rules privately with the tracking platform, which verified the results and publishes the track record. The rules themselves stay secret. Nothing wrong with that arrangement, but you can't independently implement rules you can't read. BestFolio only lists models whose rules are published and verifiable, so this one stays out.
The interesting question came next: how close can you get using only strategies whose rules are fully public?
The setup
Two of the three pillars in that write-up are already in our catalog: Bold Asset Allocation in its aggressive G4 configuration, and Hybrid Asset Allocation. Both are Wouter Keller models (HAA with Jan Willem Keuning) with published papers and exact rules.
The closed strategy plays a specific role in that portfolio: fast momentum, heavily tilted to short lookbacks, quick to move the whole book to defensives at the first sign of weakness, about seven times the annual turnover of a typical monthly TAA model. The closest public model we track in that spirit is Accelerating Dual Momentum, which scores assets on the average of their 1, 3, and 6 month returns and switches monthly. So the candidate trio became BAA-G4, HAA Standard, and ADM.
Monthly correlations across the three since 1986: HAA to BAA 0.66, HAA to ADM 0.59, BAA to ADM 0.49. All three are tactical momentum models, so they rise together in long risk-on stretches, but they disagree often enough at the turns for a blend to have something to work with.
What the blend does
We ran the trio through the same engine that powers the Blend page, over the common history from March 1986 to July 2026, 485 monthly observations. All figures below are monthly granularity, before costs and taxes.
| CAGR | Volatility | Sharpe | Max drawdown | Longest underwater | |
|---|---|---|---|---|---|
| HAA Standard alone | 14.5% | 10.7% | 1.04 | -11.8% | 25 months |
| BAA-G4 alone | 16.5% | 14.5% | 0.92 | -20.6% | 35 months |
| ADM alone | 14.5% | 14.6% | 0.79 | -25.3% | 39 months |
| Trio, equal weight | 15.4% | 11.2% | 1.07 | -10.8% | 23 months |
| Trio, risk parity (40/30/30) | 15.4% | 11.0% | 1.08 | -10.8% | 20 months |
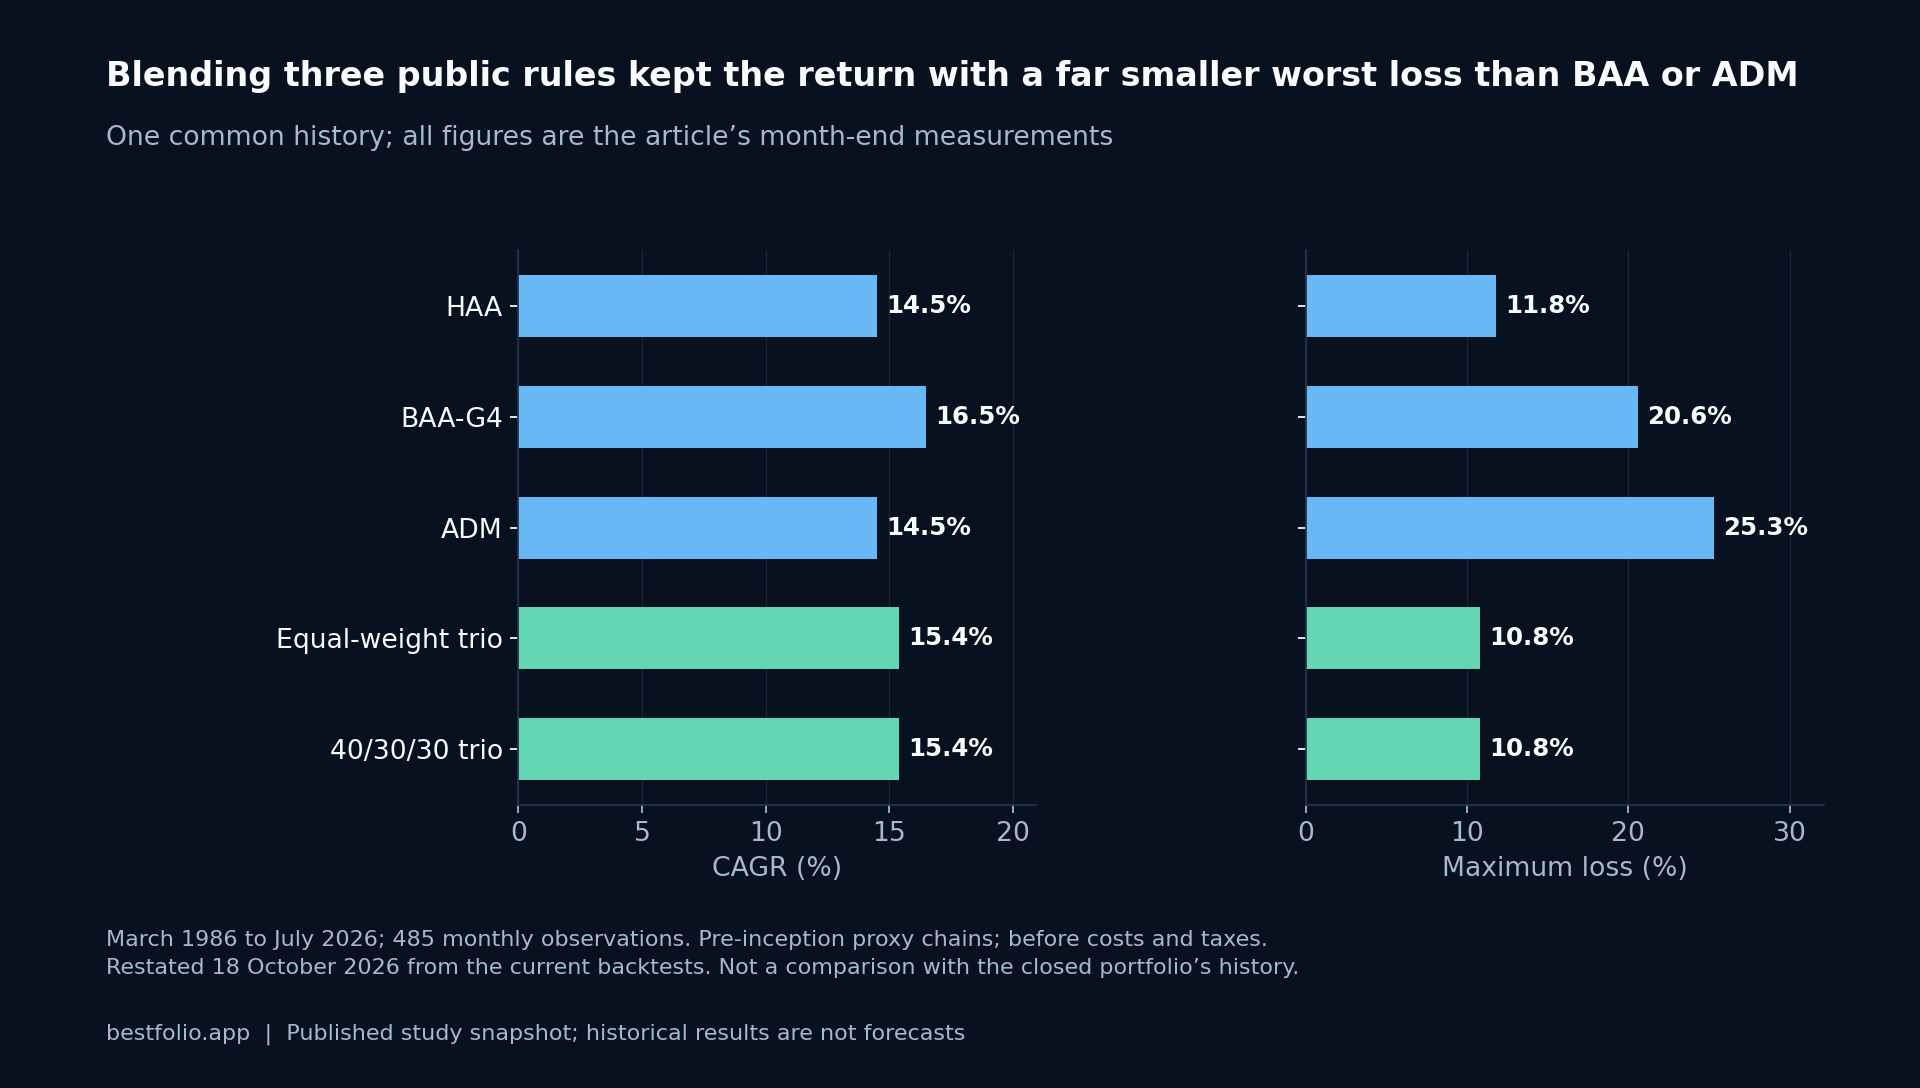
Each sleeve alone is respectable and each has a real flaw. BAA and ADM both spent roughly three years underwater at their worst, and ADM's 2022 drawdown reached -25%. The blend keeps nearly all of the return and roughly halves their worst drawdown, and it dipped less than HAA alone too. In 40 years the combined portfolio never lost more than 10.8% from a monthly peak. Its worst episode was the global financial crisis: down 10.8% from October 2007 to October 2008, back at its high two months later, then a second dip of 9.0% early in 2009. August 1990 cost it 10.4%, recovered in nine months. The two meaningfully negative calendar years were 1990, at -7.6%, and 2022, at -7.2%.
One honest detail about weighting methods: our max-Sharpe optimizer, which estimates expected returns from the trailing 36 months, concentrated 86% into HAA and dropped BAA entirely. Recency-driven weights do that. We'd pick risk parity as the sane configuration for this trio, with equal weight nearly indistinguishable.
Side by side with the closed portfolio
The original write-up reports its optimized portfolio at 16.3% annual growth, 9.0% volatility, Sharpe 1.31, and a -9.1% worst drawdown, computed from 1971. Our common window starts in 1986, and window choice matters: the 1970s were a golden decade for trend and gold, so the 1971 start flatters any long backtest. On the closest matched window we can run, October 1993 to July 2026, the risk parity trio lands at 14.6% growth, 10.9% volatility, Sharpe 1.09, and a -10.8% worst drawdown, longest underwater stretch 20 months against their reported 17.
A lower Sharpe (1.09 against 1.31), a drawdown 1.7 points deeper, about 1.7 points less annual growth. That gap looks honest to us. The closed strategy trades far more actively than anything in our trio and apparently earns some real offense with it. Insisting on open rules costs you some return here. The shape of the portfolio, the part that decides whether you can actually live with it, carries over closely.
Caveats worth keeping
It's a backtest: monthly granularity, no costs, no taxes. The deep-history sleeves rely on our standard proxy chains before their ETFs existed. ADM is our reading of the closed strategy's role from its public description; if it's doing something smarter than fast momentum, the true gap is larger than the table suggests. And while a blend of three momentum models spreads signal risk, the momentum style itself stays fully concentrated: a regime that punishes tactical momentum broadly will hit all three sleeves at once, as 2022 showed in miniature.
Try it
Pro subscribers can rebuild this in about two minutes on the Blend page with HAA Standard, BAA-G4, and ADM Standard; risk parity lands at roughly 40/30/30. We liked the result enough to add it to the portfolio library as Open Momentum Trio, where you can clone it. And if you have a strategy request of your own, the feedback box is read by a human. This entire study started there.