BestFolio's withdrawal table covers 187 strategy backtests with one engine. The median safe withdrawal rate is 6.91%. The 10th percentile is 5.02%, the 90th percentile is 11.1%, the maximum is 15.07%, and 97% of the backtests exceed 4%.
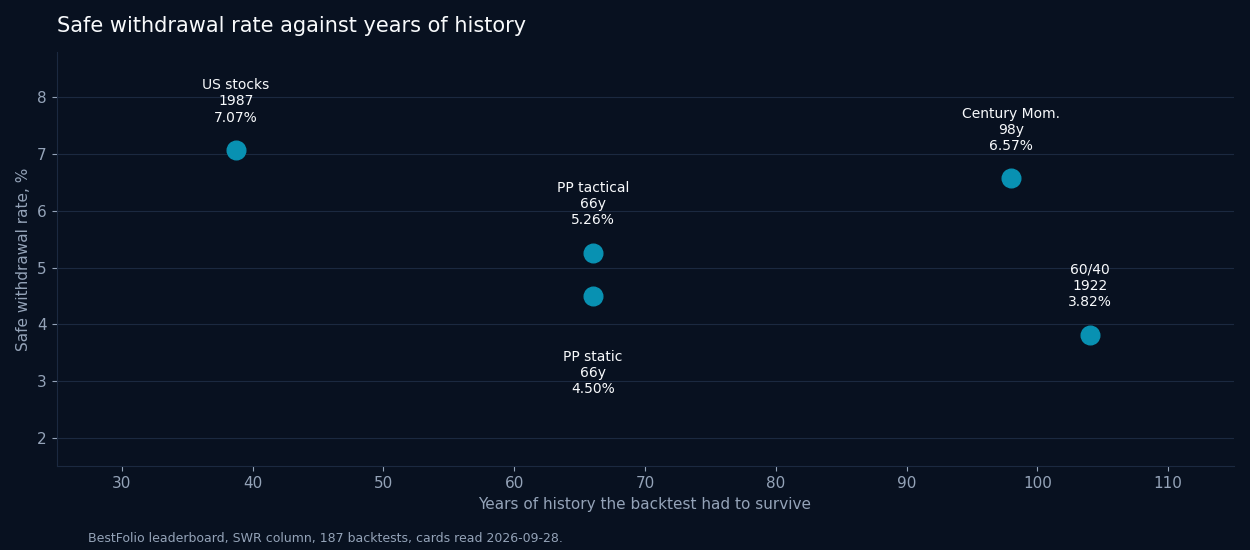
| Row | History | Safe rate | Perpetual rate |
|---|---|---|---|
| Classic 60/40 (1922) | 104 years | 3.82% | 2.51% |
| Century Momentum | 98 years | 6.57% | 6.43% |
| Permanent Portfolio, static | 66 years | 4.50% | 2.64% |
| Permanent Portfolio, tactical | 66 years | 5.26% | 3.70% |
| 100% US stocks (1987) | 38.7 years | 7.07% | 6.26% |
Figures as of 28 September 2026. They move as the backtests extend.
That summary sounds like a decisive rejection of the 4% rule. It is not. The strategies do not share the same history. A withdrawal rate is the floor across the retirement cohorts available inside a backtest, so the number can only survive disasters present in that sample.
The right comparison begins with the years column.
One engine, different weather
The engine uses rolling 30-year retirements, monthly withdrawals, actual inflation increases, and the highest initial rate for which every cohort finishes without exhausting the portfolio. That method is held constant across all 187 rows.
A classic 60/40 portfolio begins in 1922 and covers 104 years. Its safe withdrawal rate is 3.82%, and its perpetual withdrawal rate is 2.51%. It includes retirements beginning before the 1929 crash and during the long inflation shock beginning in the 1960s.
A 100% US stock backtest begins in 1987, covers 38.7 years, and reports a 7.07% safe withdrawal rate. The engine is identical. The sample is not. The later history misses the 2 retirement environments that set the older 60/40 floor.
This does not prove that US stocks deserve a 3.82% rate or that the 7.07% result is useless. It means the 2 headline numbers answer different historical questions.
Matched histories isolate more of the rule
The static Permanent Portfolio and its tactical version share the same 66-year window. The static strategy reports a 4.50% safe withdrawal rate. The tactical version reports 5.26%. Same assets, same inflation history, and the same possible retirement start dates.
That 0.76-point difference is not a pure causal estimate. Trading rules change returns, drawdowns, and the timing of losses together. It is still a much cleaner comparison than putting a post-1987 equity row beside a portfolio that begins in 1922.
Century Momentum provides another long-history check. Across 98 years, it reports a 6.57% safe withdrawal rate and a 6.43% perpetual withdrawal rate. The small gap between the 2 rates suggests that its worst sequence was not merely delayed beyond the 30-year horizon.
Safe and perpetual rates answer different questions
A safe withdrawal rate asks whether the portfolio survives a fixed retirement horizon. A perpetual withdrawal rate adds the stricter condition that the ending real balance does not fall below the starting real balance. A portfolio can fund 30 years while consuming principal and therefore show a larger safe rate than perpetual rate.
The difference matters when comparing retirement goals. Someone planning to spend down capital is asking a different question from someone trying to preserve purchasing power for heirs or an indefinite institution.
The largest number deserves the most scrutiny
The maximum safe withdrawal rate in the table is 15.07%, and the highest rate flagged fragile is 14.34%, in 4th place. That strategy is flagged as statistically fragile by BestFolio's robustness method, while the 3 above it are not. This is not a coincidence to dismiss. Shorter, friendlier samples can create a high withdrawal floor while also giving weak evidence that the backtested edge will persist.
Every double-digit safe withdrawal rate in the table comes from a backtest beginning after 1970, so none of them had to survive a retirement starting in 1966. A high rate can reveal more about missing crises than about a superior retirement portfolio.
A 4-step comparison
- Match the withdrawal definition and retirement horizon.
- Compare the backtest start date and total years.
- List the major inflation and drawdown regimes inside each sample.
- Only then compare safe and perpetual withdrawal rates.
The years column is not a caveat beside the result. It is part of the result. A strategy cannot prove that it survives a retirement shock its history never encountered.
Explore the full SWR and PWR table.
Past performance does not guarantee future results. Backtested results are hypothetical and do not represent actual trading.