Note (24 September 2026): figures in this post are dated. Later data corrections moved some of them; each strategy page carries the current numbers.
There are 2 ways to rank an investment strategy. You can rank it by how well it holds up in testing, or by how many people actually put it in their portfolio. Those sound like they should agree. Running BestFolio, I can see both rankings at once, so I checked whether they do.
The short answer: barely. The rank correlation between how often members pick a strategy and how well it scores on our robustness metric is 0.156. If people simply picked by score, that number would sit near 1. Near 0 means the popularity contest and the quality contest are almost separate events.
What I counted, and one trap I had to remove first
The raw data is every active portfolio on the site: 1,084 of them, of which 1,032 hold at least 1 of the 175 public strategy variants from the leaderboard. I read this in aggregate only. No individual accounts were opened, and everything below is a share, not a person.
The trap is the default. New members get a starter portfolio holding GEM, the Golden Butterfly, and Paired Switching, and 363 portfolios still carry that exact trio untouched. Counting those as votes would make the default look like a landslide. So the popularity contest below counts only the 221 members who built or modified their own mix, and a strategy gets their vote only when it appears outside an untouched starter portfolio.
| Starter strategy | Portfolios holding it | Outside the untouched starter | Presence that is just the default |
|---|---|---|---|
| GEM Standard | 438 | 75 | 83% |
| Golden Butterfly | 412 | 49 | 88% |
| Paired Switching (SPY/TLT) | 399 | 36 | 91% |
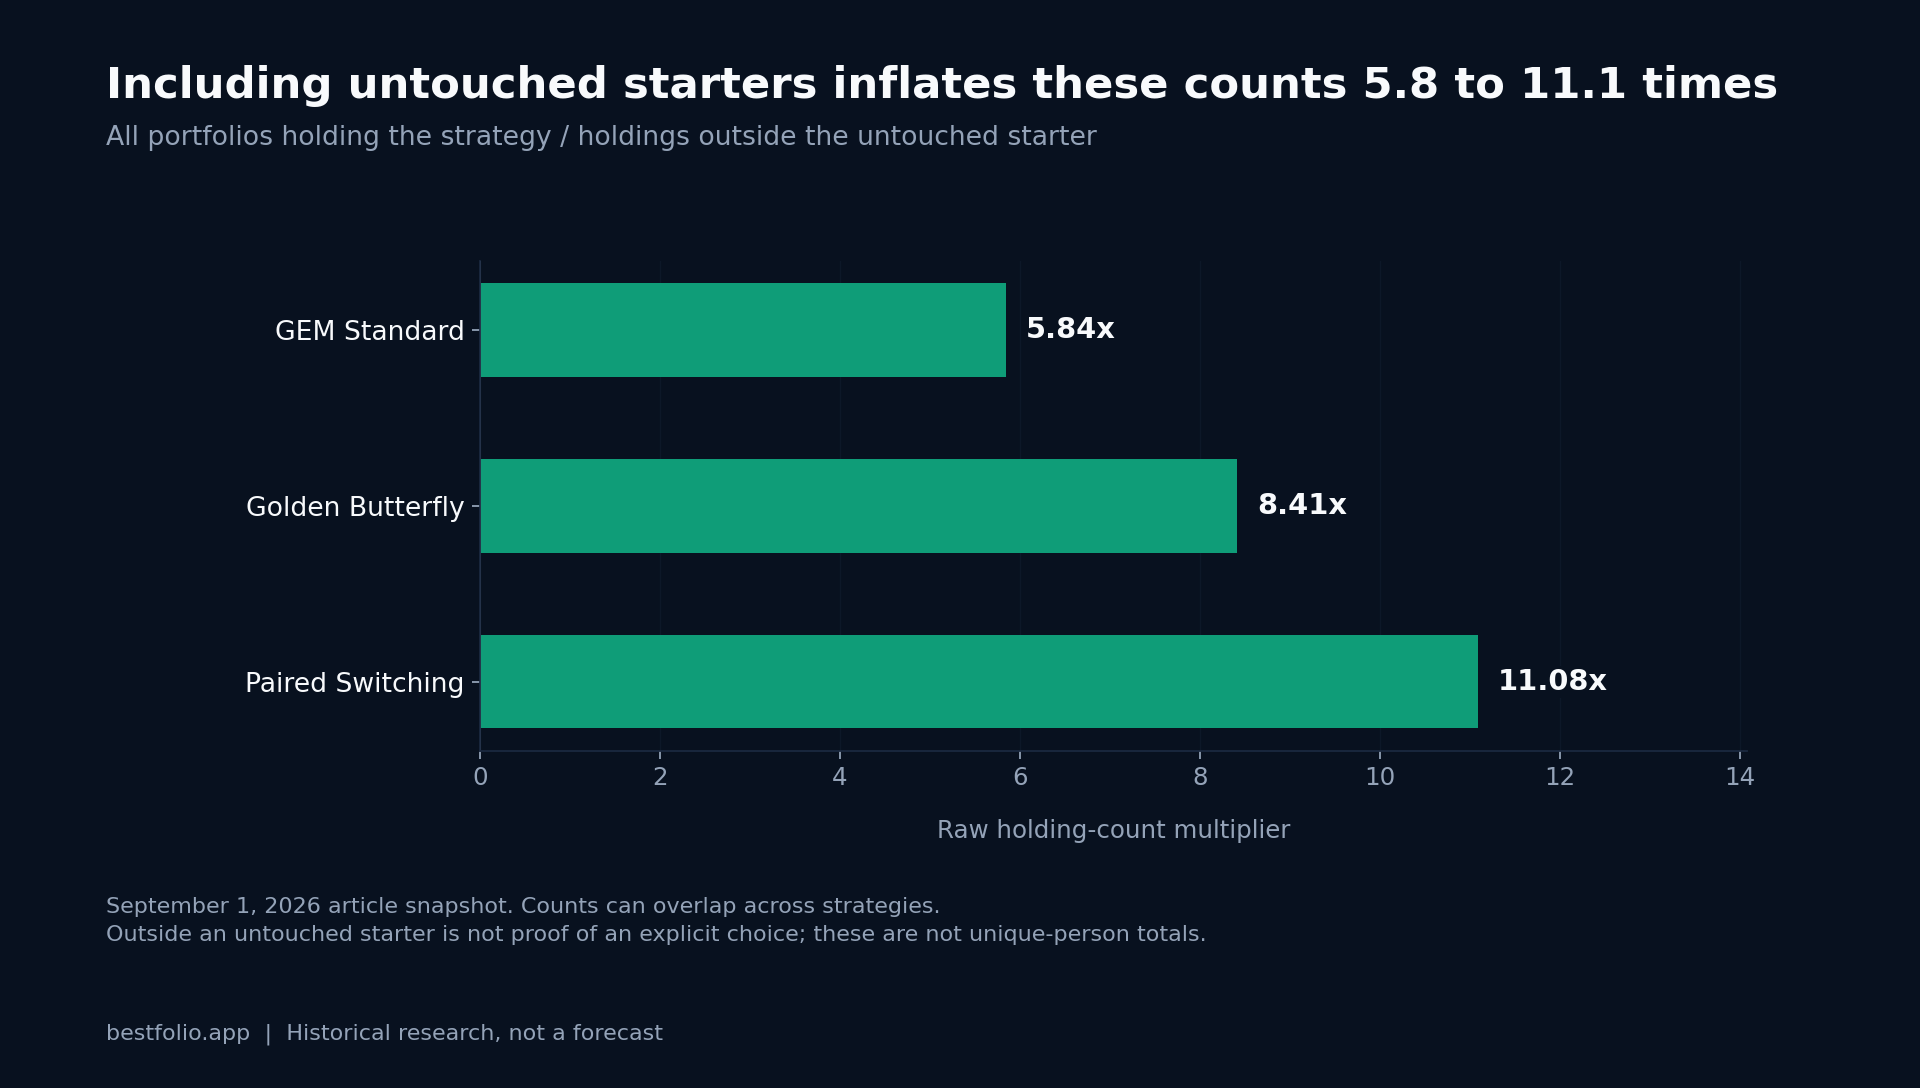
That table is worth a pause on its own. If you ever wonder why some products report huge adoption of a feature, check what the default was.
The actual popularity contest
Here are the 10 variants members picked most, as a share of those 221 self-assembling members. The robustness column is the deflated Sharpe ratio from the leaderboard: a Sharpe ratio marked down for how many strategies we tested to find it, so a lucky backtest can't score well. Details are on the methodology page. Our catalog flags anything under 0.90 as fragile.
| Rank | Variant | Share of members | Deflated Sharpe | Full-period CAGR |
|---|---|---|---|---|
| 1 | HAA Standard (with QQQ) | 31.7% | 1.0000 | 16.2% |
| 1 | GEM Standard | 31.7% | 0.9939 | 12.3% |
| 3 | Buy the Dip Standard | 26.7% | 0.9762 | 22.3% |
| 4 | HAA Leveraged (2x) | 24.4% | 1.0000 | 26.6% |
| 5 | Composite Momentum Standard | 23.1% | 1.0000 | 11.4% |
| 6 | Golden Butterfly | 20.8% | 0.9991 | 8.4% |
| 7 | RP Gold+SCV (GLD/VIOV/IEF) | 20.4% | 0.9341 | 6.6% |
| 8 | Regime Detector Standard | 16.3% | 0.7341 | 12.8% |
| 9 | Paired Switching (SPY/TLT) | 15.8% | 0.8954 | 9.1% |
| 10 | ADM Standard | 11.8% | 0.9993 | 15.5% |
The top of the table is reassuring. HAA ties with GEM at the top, and GEM keeps its crown even after I stripped out its default advantage, which surprised me. Buy the Dip in 3rd place is the simplest idea on the whole list, and its 22.3% full-period CAGR probably explains the appeal better than any scoring metric does.
Where the 2 rankings disagree
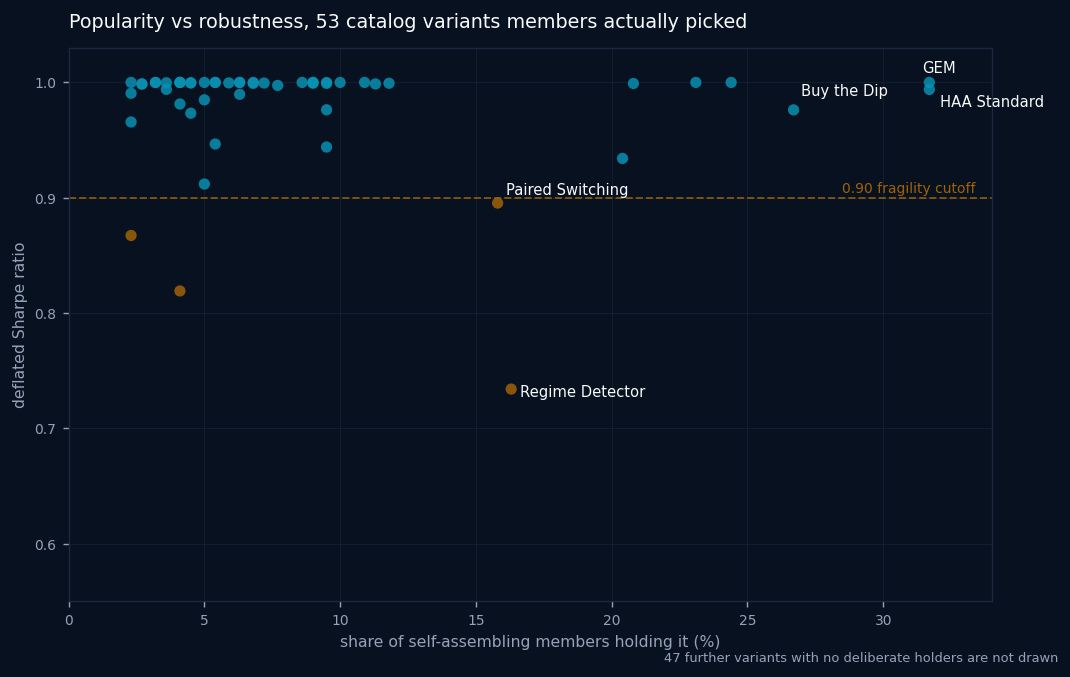
Look at Regime Detector Standard. 16.3% of self-assembling members hold it, which makes it the 8th most popular deliberate pick, and its deflated Sharpe is 0.7341. That is not a borderline case: it is the lowest score of anything in the top 10, sitting well under the 0.90 line where our own catalog labels a variant fragile. Paired Switching is the quieter version of the same story at 0.8954, held by 15.8% of members on purpose and by another 300 or so portfolios through the default.
The mirror image exists too. 47 of the 175 public variants have no deliberate holders at all, and that group is not a junk drawer. Triad+, Stoken's ACA with dynamic bonds, Faber's 12-Month High Switch, and the Permanent Portfolio (Gave) all sit in it with deflated Sharpe scores of 1.0. Perfect robustness scores, zero votes.
What I make of it
The lazy reading is that the crowd picks badly. I don't think the data says that. The deflated Sharpe measures 1 thing: how likely the backtest result is to be real rather than lucky. Members are clearly also weighing familiarity, simplicity, and whether they understand why a strategy works, and those are legitimate inputs that no scoring metric captures. GEM and the Golden Butterfly have books and years of public discussion behind them. Triad+ has a perfect score and no story anyone has heard.
But a 0.156 correlation means the scoring information is barely being used at all, and the Regime Detector case shows the cost. If 1 member in 6 holds a variant our own metric flags as fragile, the flag isn't reaching them, or it isn't persuading them. I'd rather learn which one it is than assume the metric settles it.
Portfolio composition was read on 2026-08-31 and scores come from the 2026-08-28 leaderboard snapshot. Counts are portfolios and member shares, not dollar amounts: this data says what people hold, not how much they trust it.