Where should a momentum strategy hide when it steps out of the market? Toma Hentea and Martin Schwoerer answered that differently, and in 2022 the answer mattered more than anything else in the rules. Hentea published the rules on Seeking Alpha in January 2020. Schwoerer, who runs his own version, later nicknamed it the Holy Grail, so read the name as a nickname, not a promise. Both versions joined BestFolio on 27 October.
The rule
At each month-end it ranks 10 funds on their total return over the last 3 calendar months: US large caps, the Nasdaq 100, US mid caps, developed international, emerging markets, Chinese stocks, real estate, gold, long Treasuries and corporate bonds. It holds the best 4 at 25% each. There is no filter on each fund, so a top-4 fund with a negative return is still held.
A single fund works as the risk switch. When the Vanguard Total Bond Market fund returns less than 3-month T-bills over the same 3 months, the whole portfolio steps aside into a single safe asset.
2 versions, 1 difference
Hentea's original steps aside into long-term Treasuries (TLT) and uses a Fidelity emerging markets fund. Schwoerer's version steps aside into cash (T-bills) and uses VWO for emerging markets. Everything else is the same.
| February 2005 to October 2026 (backtest) | Return a year | Sharpe ratio (above cash) | Worst fall |
|---|---|---|---|
| Holy Grail (Schwoerer's version, cash, the default) | 11.7% | 1.00 | -18.7% |
| Toma Hentea's Original (long Treasuries) | 11.7% | 0.76 | -42.6% |
| S&P 500, same dates | 11.0% | 0.67 | -55.2% |
Same return over the whole backtest, very different worst falls. The switch explains it: it turns risk-off exactly when the bond market trails T-bills, which is what happens when bonds are falling. Through the 2022 bond crash the original held long Treasuries in most months and fell about 43% from its December 2021 high to October 2023. Schwoerer moved to cash for that reason, and his version's worst fall is about 19%, from October 2007 to March 2009.
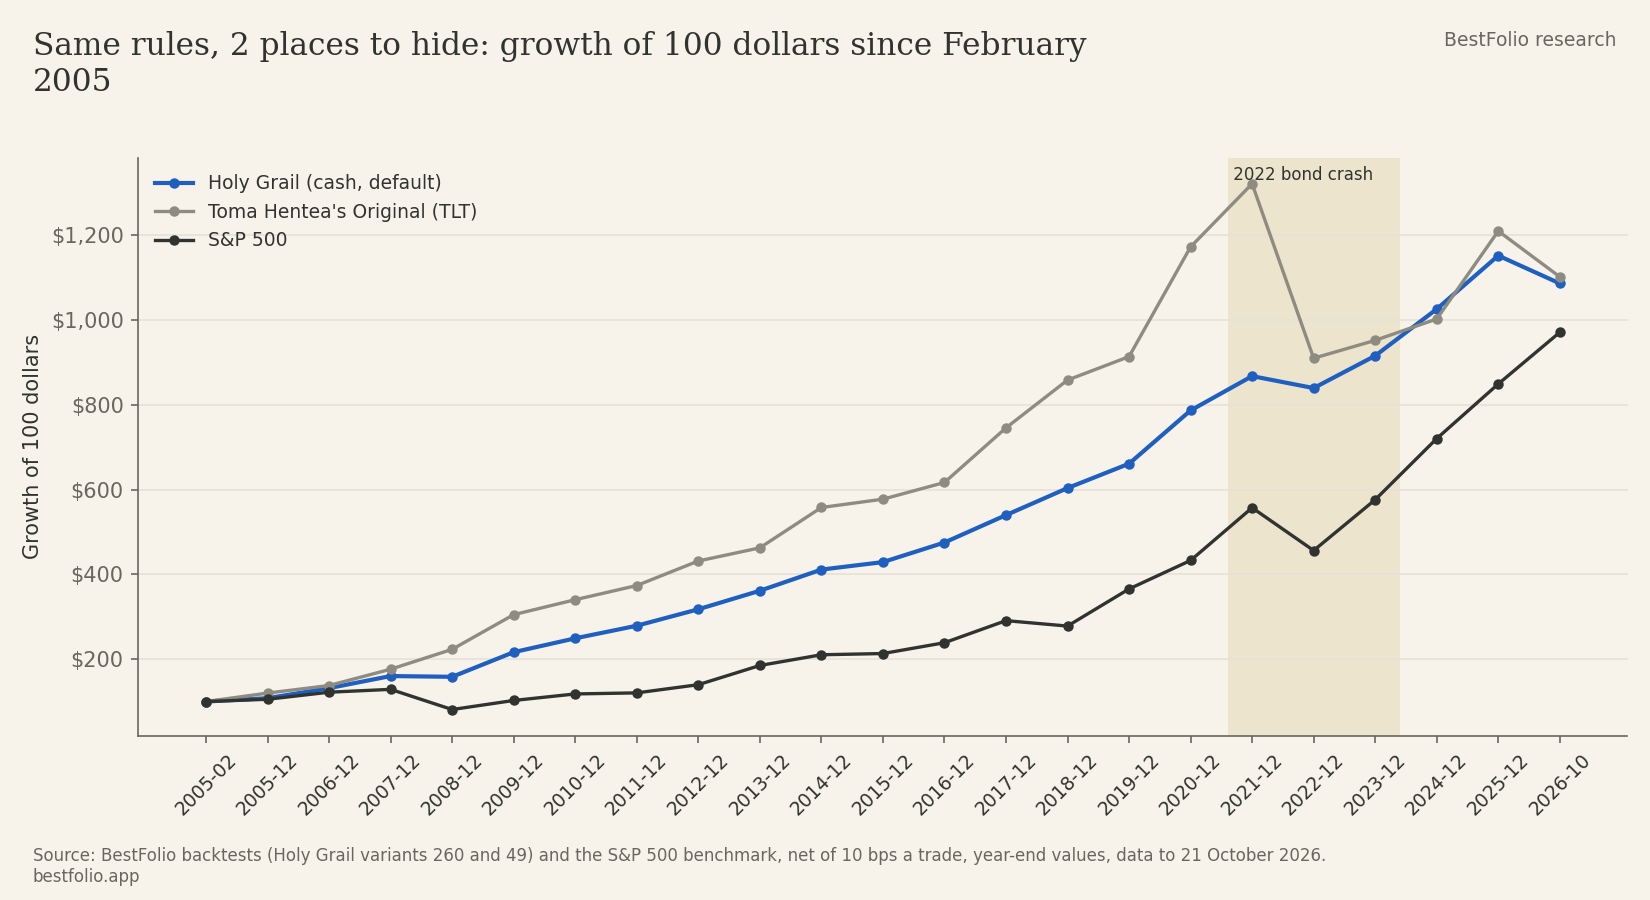
The 2 calendar years that show the trade-off best:
| Calendar year | Holy Grail (cash) | Hentea's Original (TLT) | S&P 500 |
|---|---|---|---|
| 2008 | -1.1% | +26.6% | -37.0% |
| 2022 | -3.3% | -31.1% | -18.1% |
Why the cash version is the default
It's the version the name comes from and the one Schwoerer's readers follow, and it has the shallower worst fall for the same return. Our rebuild of it comes within 0.1 point a year of the figures he publishes, before trading costs: 13.3% against his 13.4% a year from 2006 to mid-2023. Hentea's original stays on the page as a variant, credited as the origin of both.
What to keep in mind
- The backtest is short by our standards. It starts in 2005, so it has 1 real equity crash (2008) and 1 bond crash (2022) in it, not the 1970s or the 1987 crash.
- Cash isn't always the better hiding place. When long Treasuries rally while stocks fall, as in 2008, the original's risk-off asset adds to returns and cash only waits. The cash version gives up that cushion to avoid the 2022 kind of fall.
- It has trailed the S&P 500 since 2010. The cash version returned 10.1% a year from 2010 to 21 October 2026, against 14.3% for the S&P 500, through a long run led by US stocks.
- 4 out of 10 is concentrated. At 25% a fund, 1 bad pick, Chinese stocks or gold in a sharp reversal, moves the whole month.
- It trades every month. Expect regular turnover and, outside a tax-sheltered account, tax on it.
- A data check is still open. Our stored history of the bond fund the switch reads differs slightly from Yahoo's. With Yahoo's series our rebuild matches Hentea's published 2006 to 2019 figures exactly; with ours it comes out 0.7 point a year lower, because 4 of 259 monthly switch readings flip.
The strategy page has both versions, their full histories and the live signal for Pro members. Thanks to Toma Hentea for the rules and to Martin Schwoerer for the version most people follow.
Backtests are hypothetical and include no taxes. Past returns do not predict future ones.