A subscriber read the Behaviour Check section of our methodology recently and said it was worth a blog post. The method that shipped is on that page. This post is about the versions that failed first, because they explain every choice in the one that survived.
Why behaviour and not returns
Once a strategy runs live, you want to know if it still does what its backtest did. Returns can't answer that in any useful time. At 15% annual volatility, telling a 2 percentage-point difference in annual return apart from noise takes about 225 years of live data. After 10 months live, the standard error on the annual return is still roughly 16 points.
Behaviour moves much faster. How often a strategy trades, how much of the book it moves, how much sits in bonds or cash: these have a far smaller spread relative to their average than returns do. For the same confidence, returns need on the order of 100 times more data. And when something breaks (a bad price feed, a lagged signal, a changed parameter), it shows up as a steady offset, which is what a distribution test catches in a small sample.
So the card on each strategy page asks one narrow question. Is the live strategy still trading the way its own backtest did?
Version 1: score each month
The obvious build takes the last 6 months and scores each one against the strategy's history of single months. There are 4 metrics: the share of the book in defensive assets, turnover, the strategy's own trigger reading where it stores one, and how close its last pick came to the first reject. Take the most unusual of the 4 and show one of 3 states: in line, unusual below 0.05, outside its range below 0.01.
Before shipping it I backtested the monitor itself. 87 monthly strategies over 176 months, each month scored using only data available at the time.
It flagged more than a third of strategies in a typical month, 37% in that first run. The card changed its verdict in 17% of month-to-month transitions, and alerts in the amber "unusual" tier typically lasted a single month. A card that flips one month in 6 is noise with a badge.
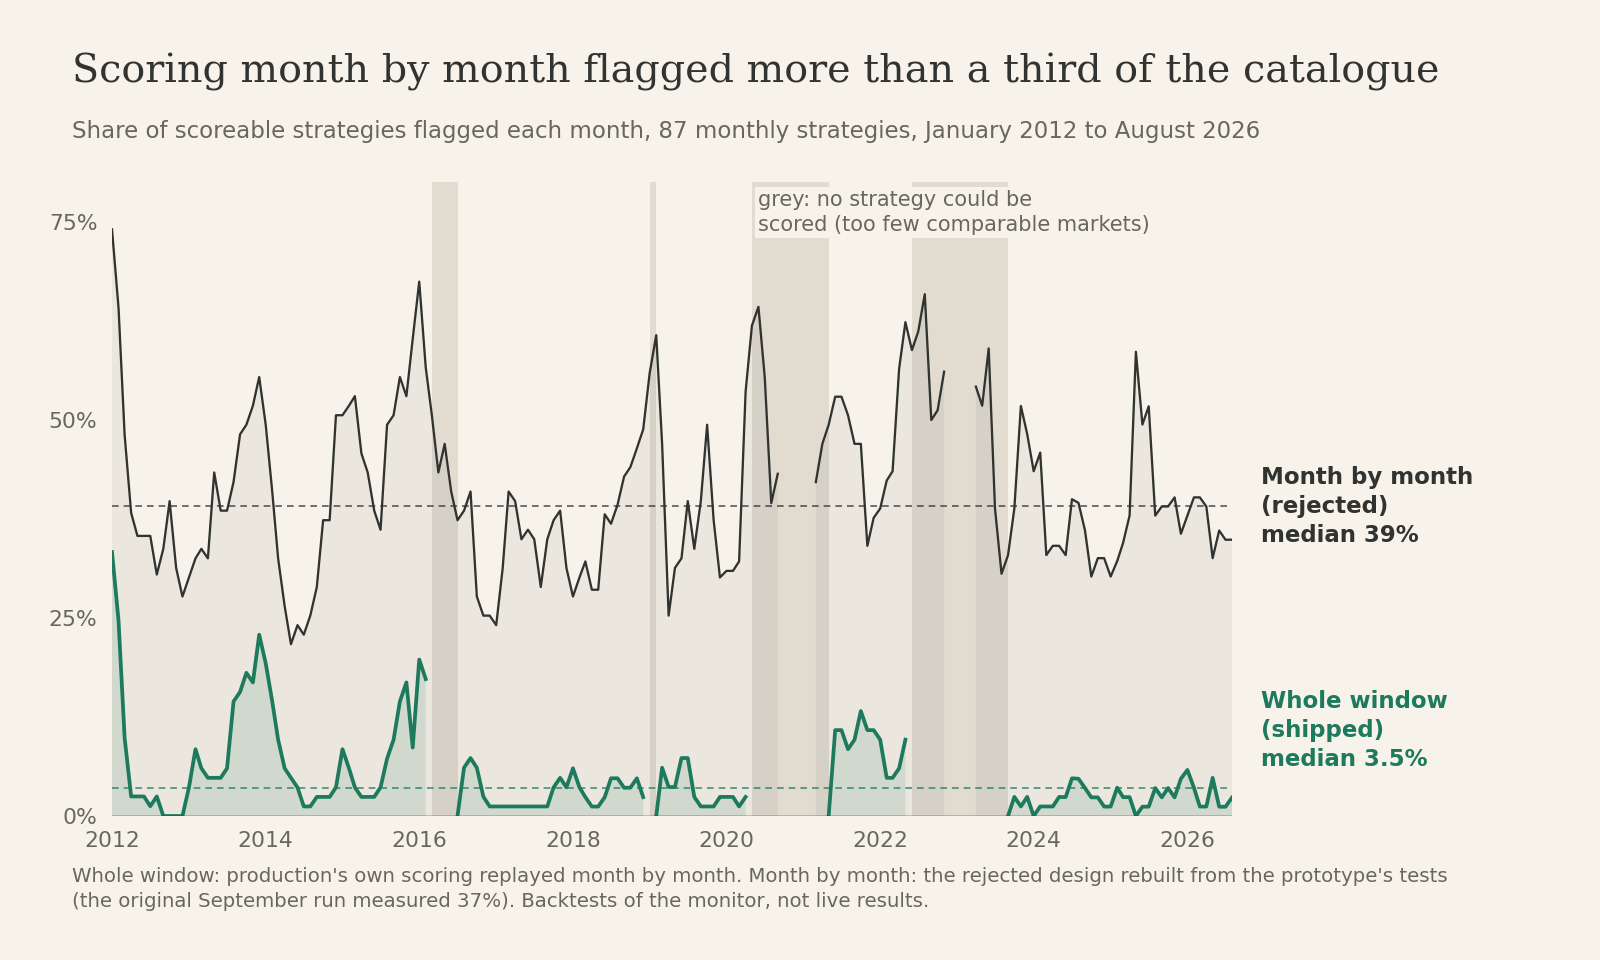
When I rebuilt that version for this post, counting only the months it could actually score, it flagged 39% in a typical month and changed its verdict 19% of the time.
Why it failed: 6 months are not 6 coin flips
My first instinct was to tighten the threshold. The real cause sat one level down, in an assumption the whole design rested on: that the 6 months are independent draws.
They aren't. Regime is persistent. Once a trend filter goes defensive, it tends to stay there.
HAA (Hybrid Asset Allocation) is a good example. In its backtest since 1974 it was mostly defensive, meaning more than half the book in risk-off assets, in 134 of 631 months. That's about 21%. Treat those months as independent and 6 in a row should come up about once in 10,900 stretches of 6 months. It came up 36 times in 626, about 1 in 17.
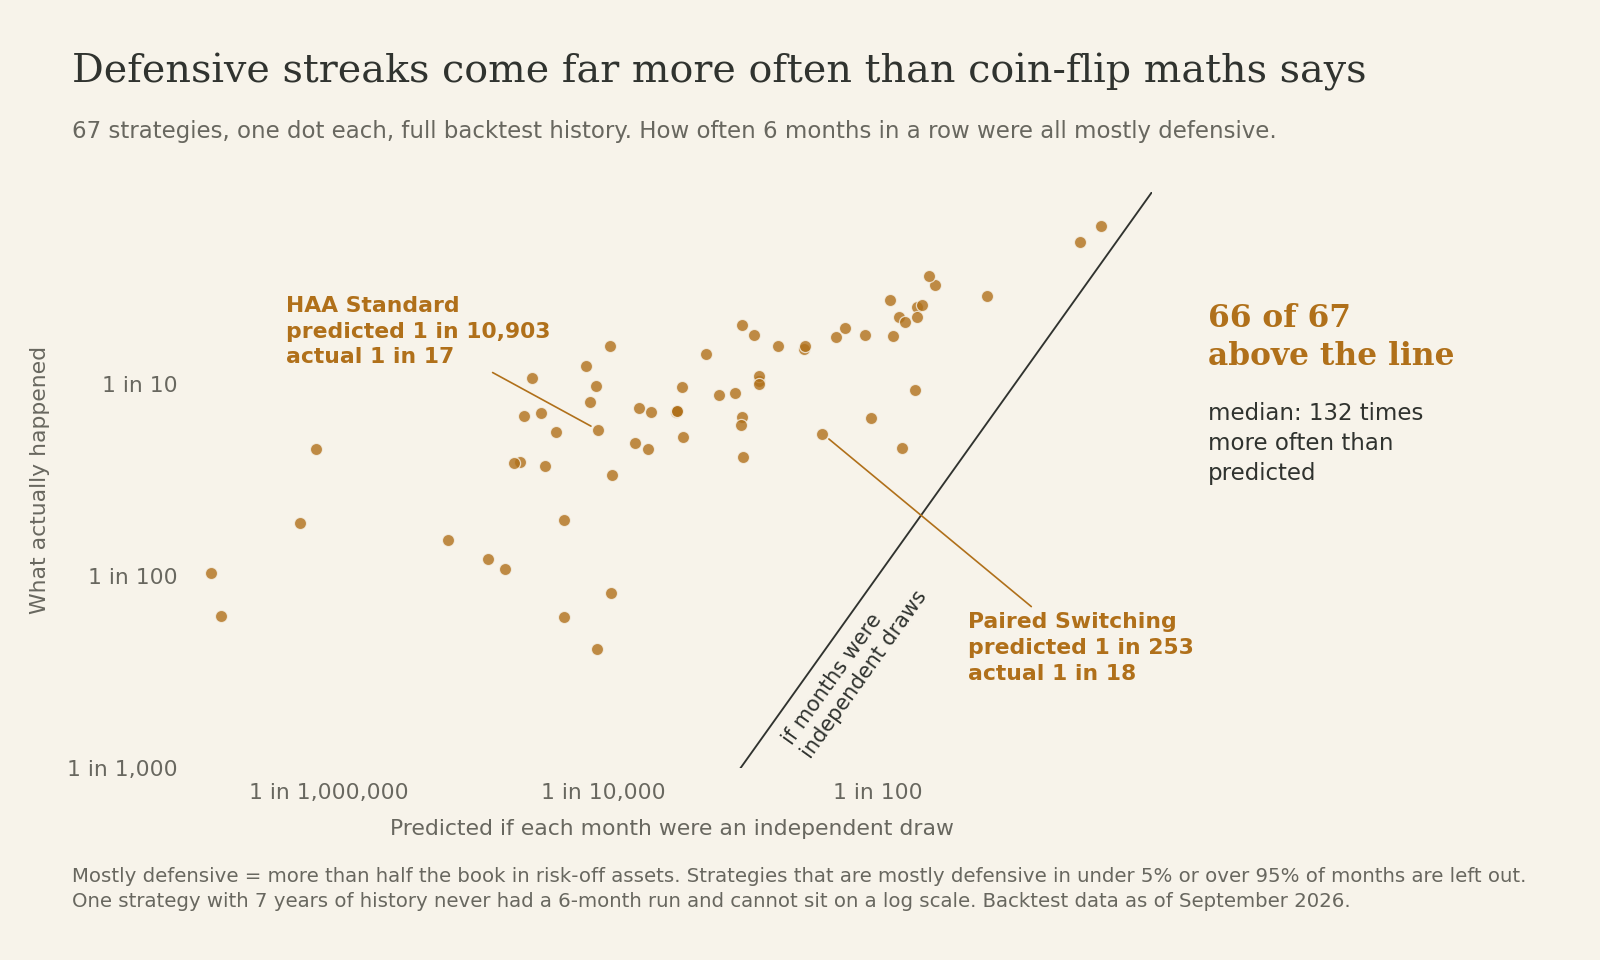
Across the 67 strategies that actually switch between offence and defence, 66 had more 6-month defensive runs than independence predicts. The median was about 132 times more often. The exception has 7 years of history and never had a run at all.
So the per-month test scored ordinary behaviour as a rare event. Its p-values came out far too small, what statisticians call anti-conservative. It had 2 smaller problems on top of that. Taking the most unusual of 4 metrics is itself a multiple comparison: at 0.05 it fires about 19% of the time on pure noise. And a flag that lasts one month means little on a page people read once a month.
Version 2: has it ever done this before?
The fix changes the unit of comparison. We take the last 6 rebalances as one window, average each metric over it, and compare that with every 6-rebalance stretch in the strategy's own history that happened in a similar market. The p-value is the share of those historical windows at least as extreme, on either side.
The reference windows carry the same persistence as the live one, so serial correlation is handled by construction. It's also the question a person actually asks when a strategy looks odd: has it ever done this before?
"A similar market" has to come from outside the strategy. Cohorting on the strategy's own regime label is circular, since a defensive month has a high defensive weight by definition. So the market state comes from the broad US equity benchmark: whether its trailing 12-month return is up or down, and whether its trailing 12-month volatility is under 12%, between 12% and 20%, or above 20%. The cut-offs are fixed numbers on purpose. Cutting at quantiles of the full history would let the future leak into what counts as a normal market.
Then 3 guards, with the gate at 0.01:
- Enough history. With fewer than 40 comparable windows, the metric isn't scored at all. An empirical p-value can't resolve below one over the number of windows, so saying nothing beats guessing.
- One lottery ticket. The best of the metrics is corrected for how many were run (a Sidak correction), so the card no longer gets 4 tries at looking unusual.
- Say it twice. A flag has to hold at 2 consecutive rebalances before it shows, while clearing takes a single in-line window. The check works that out by rescoring the window that ended one rebalance earlier, so there's no stored history to drift.
The repeat rule does less than you'd think. On its own it took flagged strategy-months from 6.9% to 5.0% of those scoreable, and month-to-month changes from 3.6% to 2.7%. The big drop came from comparing windows.
Same 87 strategies, same 176 months, same data. Rates are over the months that could be scored:
| Month by month (rejected) | Whole window (shipped) | |
|---|---|---|
| Strategy-months that couldn't be scored | 6% | 19% |
| Scoreable strategy-months in line | 59% | 95% |
| Strategies flagged in a typical month | 39% | 3.5% |
| Verdict unchanged, consecutive scoreable months | 81% | 97% |
| Median life of a flag | 1 month ("unusual"), 3 months ("outside") | 2 months |
The shipped column is production's own scoring code replayed over that history, so it's what a subscriber would have seen each month. A typical flag lasts 2 months, and 44% last 3 or more. A given strategy is flagged in a median 2% of the months it can be scored, and 21 of the 87 were never flagged.
About 1 strategy-month in 5 can't be scored
That 19% in the table is the check's main limit. In about 1 strategy-month in 5 there isn't enough comparable history to score the strategy at all, and the card says so instead of calling it in line.
Those months bunch up when markets are unusual. After the Covid crash the benchmark was rising with volatility above 20%, a mix that covers only 30 of the 454 months in its labelled history. From May 2020 to April 2021 no strategy could be scored, and the same happened from June 2022 to August 2023. The unscoreable share was 67.1% of strategy-months in 2020, 59.3% in 2022 and 67.5% in 2023. In 32 of the 176 months nothing could be scored (the grey bands in the first chart). The check has least to say when markets are least like the past.
3 tiers became 2
The middle tier survived into the window design at first. It fired on about 1% of the strategy-months that could be scored. A state that rare gives you nothing to act on, so it went. The card now says In line or Outside its range.
More tiers feel more careful. Anything like 6 tiers would have been 5 more than our data could support.
The designs we threw out
Our internal methodology notes keep a list of these so nobody proposes them again. These taught me the most:
- The strategy's own regime label as the market state. Circular: the metric could never fire on the thing it exists to detect.
- Volatility buckets at quantiles of the full history. They leak the future into the definition of normal.
- A hand-made list of cash tickers. It scored a strategy sitting fully in AGG, a bond fund, as 0% defensive. Now it uses the product's own risk classification.
- One row per variant. 16 HAA variants produced 16 identical alerts from a single reading of its TIP canary. One fact, reported 16 times. Rows are now one per strategy.
- Our panel-wide false-discovery correction applied to your card. With 200+ tests a month, our internal queue needs one. You're looking at one strategy and don't have that problem, so on your card it would only hide real findings from the person they concern.
What the card can and can't tell you
When we ran it on the live catalogue in early September, before launch, 2.8% of the variants it could score were outside their range. Close to what the backtest suggested.
- It isn't a return forecast. A flag means the strategy is behaving differently from its backtest, in either direction. It says nothing about whether it's about to do well or badly.
- It doesn't prove the edge is real. It checks that the live version does what the tested version did, which is a narrower question than whether the backtest was overfit.
- It can't score everything. Coverage is 174 of 225 variants. Annual strategies don't rebalance often enough to fill a 6-rebalance window, so they're never scored.
There's also a second, separate check that asks whether our own published history still matches the signals in your account. That one is about us rather than the strategy, and I'll write it up separately.
Pro members see the Behaviour Check on the Backtest tab of every strategy page, for example HAA or Paired Switching. The short version of the method is in the methodology. If you want the card on the strategies you follow, it's part of Pro.