On 4 October David Varadi published Orthogonal Cluster Risk Parity on CSS Analytics. It's the successor to the Cluster Risk Parity he and Michael Kapler introduced in 2012. It comes with two strong claims. One is Sharpe ratios of 1.18 to 1.31 on three ETF universes since 1991. The other is weights that don't move at all when you add a duplicate of a fund you already hold.
There was no code with the post, so I rebuilt it from the written rules and ran it on our engine. It's in the catalog from today. It's also not a strategy I'd pick over a plain 60/40, and this post explains why, with the numbers. Three of them up front, from the engine backtest of January 1988 to October 2026, with Sharpe ratios measured above cash (T-bills):
- OCRP returned 5.9% a year with a Sharpe ratio of 0.51 and a worst fall of 20.4%. A plain 60/40 on the same dates returned 9.2% a year, with a Sharpe ratio of 0.69 and a worst fall of 33.7%.
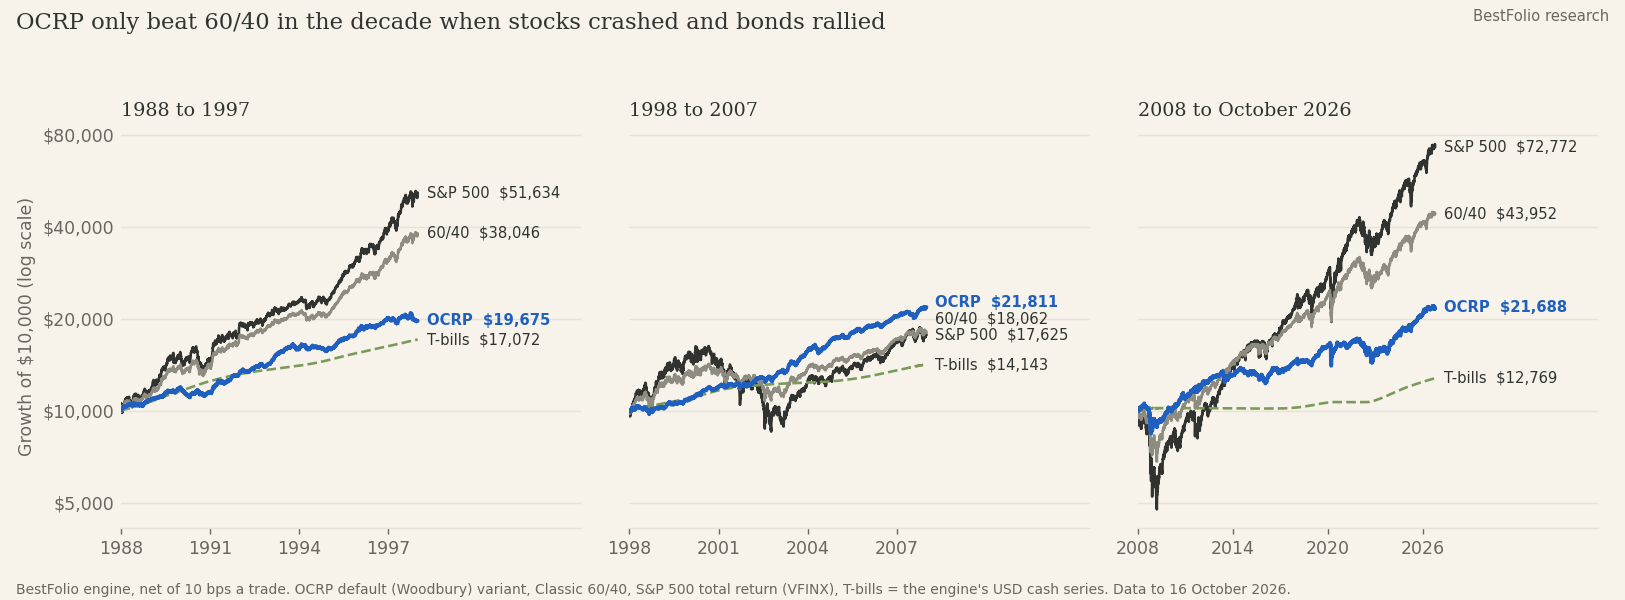
- It beat 60/40 in one decade only, 1998 to 2007, when stocks crashed and bonds rallied: 8.1% a year against 6.1%, with a worst fall of 6.5%.
- It made about 3 points a year more than T-bills both before 2008 and after. What fell in 2008 was the T-bill rate, from 4.5% a year to 1.3%.
What it does
Plain risk parity gives every fund the same share of risk. That works on a tidy menu and goes wrong on a messy one: list five stock funds and one bond fund, and the portfolio ends up mostly in stocks. Varadi's fix is to balance risk across sources instead of tickers. It works on a year of daily returns, and each month it goes through four steps:
- Remove funds that duplicate others: near-identical funds, leveraged and inverse copies, and blends that can be rebuilt from funds already held.
- Pick the few funds that together explain 95% of the movement of the whole universe, usually four to six, and treat them as factors.
- Group every fund with the factor it tracks most closely.
- Balance risk across the groups. Inside each group, lean toward the lower-volatility funds.
The universe is the post's twelve asset classes: SPY, EFA, EEM, EWJ, IEF, TLT, LQD, HYG, TIP, DBC, GLD and IYR. It's always fully invested and holds about 61% bonds on average. In the latest signal, on 30 September, high yield (HYG) alone was 37% of the portfolio.
The headline numbers reproduce, with a catch
On the post's 12-asset universe, my rebuild lands close to the published Sharpe ratios when I measure them the way the post does:
| Method | Post, no cash subtracted (Sharpe ratio) | Our rebuild, no cash subtracted (Sharpe ratio) | Our rebuild, above cash (Sharpe ratio) |
|---|---|---|---|
| OCRP, Woodbury version (the default here) | 1.18 | 1.21 | 0.76 |
| OCRP, equal risk inside groups | 1.11 | 1.15 | 0.73 |
| Plain equal risk contribution | 1.11 | 1.12 | 0.70 |
| Hierarchical Risk Parity | 1.16 | 1.22 | 0.73 |
| Minimum variance | 1.10 | 1.24 | 0.68 |
The catch is how those numbers are measured. The post's figures are daily Sharpe ratios with no cash rate subtracted, so every year of T-bill interest counts as skill. Subtract cash and my rebuild of the headline version drops from 1.21 to 0.76. The history also starts before most of these ETFs existed. Run the same rules on each fund's real listing date and every method in the table falls to about 0.65 without cash, and to between 0.35 and 0.45 above it, because before 2002 the 12-asset set is mostly SPY.
On the post's own measure, Hierarchical Risk Parity and minimum variance come out level with OCRP or ahead of it, so I couldn't reproduce the post's ranking. Above cash OCRP edges ahead, 0.76 against 0.73 for Hierarchical Risk Parity, a gap too small to mean much.
Problem 1: above cash, it trails a plain 60/40
This is the one that matters most. On the engine's backtest from January 1988, OCRP's Sharpe ratio above cash is 0.51, against 0.69 for a plain 60/40 over the same dates, and it returned 5.9% a year against 9.2%. That 0.51 is lower than the rebuild's 0.76 because the two runs differ in start date, data and method (the engine uses monthly returns and our corrected stand-in history), so compare it with the 60/40 next to it, not with the table above. Split the record into decades and you can see what kind of portfolio it is.
| Measure | Period | OCRP | 60/40 | S&P 500 |
|---|---|---|---|---|
| Return a year | 1988-1997 | 7.0% | 14.3% | 17.8% |
| Sharpe ratio above cash | 1988-1997 | 0.30 | 1.01 | 0.99 |
| Worst fall | 1988-1997 | -7.6% | -11.6% | -19.2% |
| Return a year | 1998-2007 | 8.1% | 6.1% | 5.8% |
| Sharpe ratio above cash | 1998-2007 | 0.90 | 0.33 | 0.22 |
| Worst fall | 1998-2007 | -6.5% | -24.4% | -47.5% |
| Return a year | 2008-2026 | 4.2% | 8.2% | 11.1% |
| Sharpe ratio above cash | 2008-2026 | 0.44 | 0.71 | 0.67 |
| Worst fall | 2008-2026 | -20.4% | -31.9% | -52.5% |
From 1988 to 1997 stocks boomed and T-bills paid 5.5% a year. A portfolio that is mostly bonds made 7.0%, and its Sharpe ratio was 0.30 against 1.01 for 60/40. From 1998 to 2007 the S&P 500 lost almost half its value in the dot-com bust while bonds rallied, and that was OCRP's decade: 8.1% a year against 6.1% for 60/40, with a worst fall of 6.5%. Since 2008 it returned 4.2% a year, about half of what 60/40 made, with a Sharpe ratio of 0.44 against 0.71. Since 2020 the gap is wider, 0.23 against 0.61.
Leave cash out and the years before 2008 look excellent: measured the post's way, the engine's 1988 to 2007 Sharpe ratio is 1.49. Above T-bills, which paid 4.5% a year back then, it's 0.59, below 60/40's 0.67. OCRP made about 3 points a year more than T-bills both before 2008 and after. The strategy didn't get worse in 2008. The T-bill rate fell, and with it the part of the old record that was really cash.
Problem 2: it doesn't beat simpler methods
In my reproduction OCRP never beat plain equal risk contribution, Hierarchical Risk Parity or minimum variance by a statistically meaningful margin. Over the post's full window the test against Hierarchical Risk Parity gives p = 0.91 and against minimum variance p = 0.78. Since 2007 it's level with plain risk parity (p = 0.88), which trades about a quarter as much. Those tests use the post's measure. Above cash the gaps are just as thin: 0.76 for OCRP against 0.73 for Hierarchical Risk Parity, 0.70 for equal risk contribution and 0.68 for minimum variance.
Varadi says this himself. In his words, the return margins are "thin and inside the noise", and the advantages he expects to last are robustness in 2022 and the exact handling of duplicates. So I tested those two.
Problem 3: 2022 was a double-digit loss
| Calendar year | OCRP | 60/40 | S&P 500 |
|---|---|---|---|
| 2008 | -6.0% | -18.9% | -37.0% |
| 2013 | 0.7% | 18.6% | 32.2% |
| 2022 | -11.5% | -16.1% | -18.2% |
OCRP lost 11.5% in 2022. That's better than 60/40 and the S&P 500, and well short of "roughly flat". It's the 1998 to 2007 lesson in reverse: when bonds fall with stocks, a portfolio that is mostly bonds has nowhere to hide, and the factor step doesn't see a rate shock coming, it reacts to correlations after they've changed. 2013 shows the other side: a calm year for stocks, a bad one for bonds, and OCRP made 0.7%.
Problem 4: duplicate removal works on paper, not on real ETFs
On simulated copies the duplicate step is exact. Add a clone, a 60/40 blend, a 2x fund or an inverse fund to a small portfolio and the weights on the original funds don't move at all. I checked that and it holds.
Real ETFs are noisier. Two aggregate bond funds tracking the same index, AGG and BND, correlated only 0.92 day to day over 2014. A balanced allocation fund like AOR rebuilds from the twelve asset classes at 0.96 to 0.98. The post's thresholds are 0.995 and 0.98. So I took the twelve funds and added twelve real look-alikes: IVV, VOO, VTI, SSO, SH, AOR, AOM, IAU, SCHR, VGLT, AGG and BND.
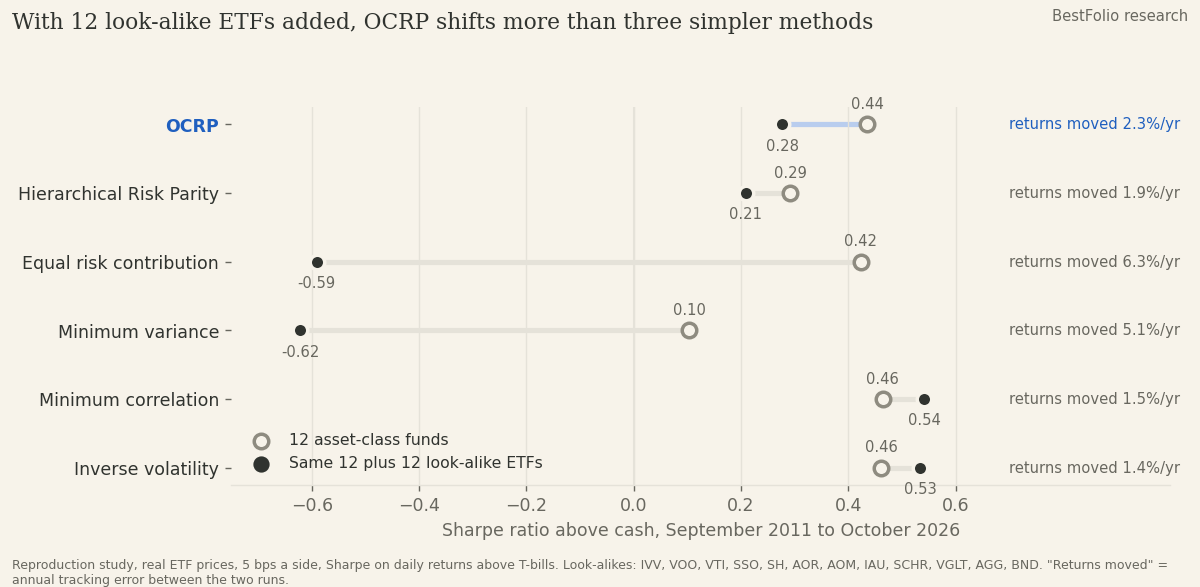
It caught the S&P 500 clones, the 2x fund and the inverse fund every time. It let the rest through as new sources of risk, and its returns moved 2.3% a year, more than Hierarchical Risk Parity (1.9%), minimum correlation (1.5%) or plain inverse volatility (1.4%). Its Sharpe ratio above cash fell from 0.44 to 0.28. Loosening the thresholds didn't fix it: the drift stayed around 2% a year, and at the loosest setting the step started deleting genuine asset classes from the clean menu.
Plain equal risk contribution did far worse (6.3%), so the idea isn't wrong. It just doesn't deliver the "exact" part once prices are real.
What it does well
It's a low-volatility, bond-heavy portfolio, and it behaves like one. The worst fall since 1988 was 20.4%, against 33.7% for 60/40 and 55.3% for the S&P 500, and it lost 6.0% in 2008. It earns its keep when bonds rally while stocks fall, as they did from 1998 to 2007. If what you want from a strategy is a smaller worst case, and you accept a lower return in most other markets, that's what it offers.
One change from the post, on our side. Before each ETF existed, our engine uses index funds and indices. For a few assets in the early years, those are monthly series spread across trading days. They show almost no daily movement, and any risk-parity method will pile into them. Our version leaves a fund out of any month where its past year looks like that, so TIPS only enter at the end of 1998. These stand-ins matter more here than for most strategies. In October we fixed several of them: Japanese stocks had been read in yen, and gold now uses daily prices. OCRP's 1988 to 1997 return went from 9.8% to 7.0% a year.
Why it's in the catalog anyway
It's a serious method from the author of the Minimum Correlation Algorithm, which is already in the catalog. And it's easier to judge running next to everything else than described in a blog post. The strategy page carries the same caveats as this post, and the default variant is the post's own headline version, so you're looking at the method as published.
The original post is worth reading for the method itself. The strategy page has the full backtest and live signal for Pro members.
Past performance does not guarantee future results. Engine figures are net of 10 bps a trade and use data to 16 October 2026. Sharpe ratios are measured above cash (T-bills) unless a table says otherwise. Reproduction figures come from a separate study on real ETF prices at 5 bps a side.