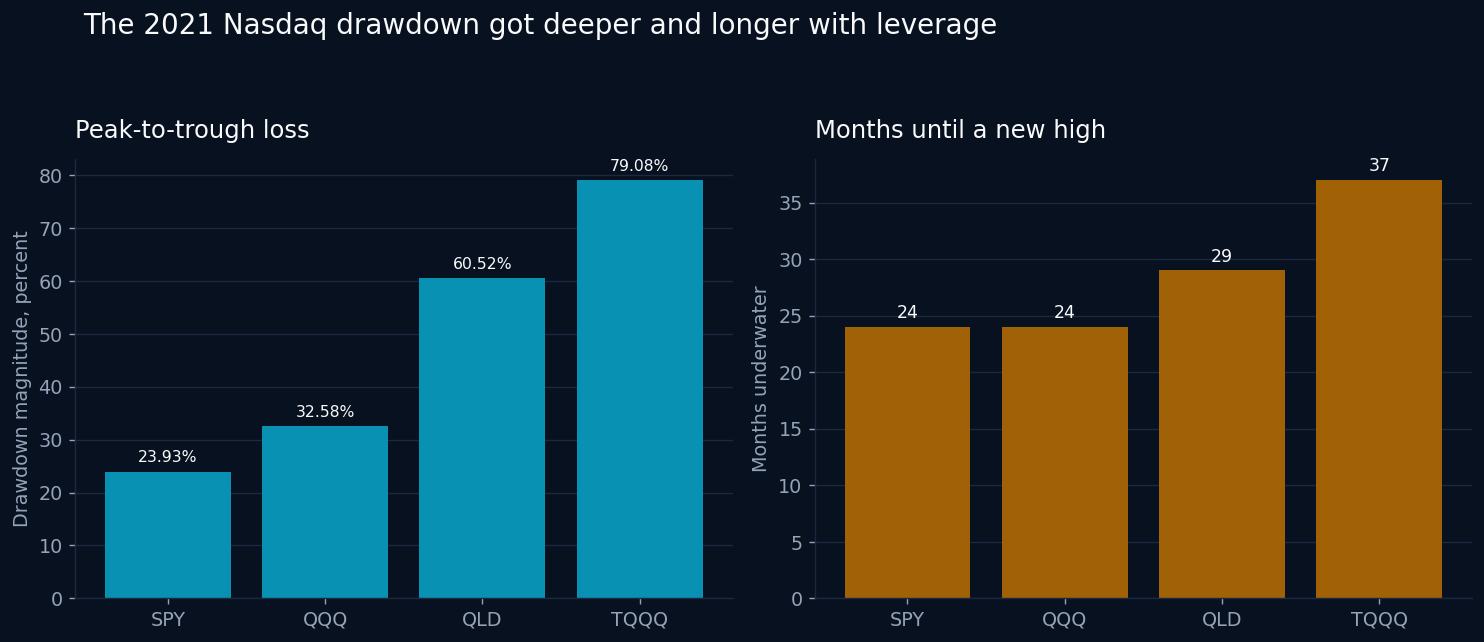
SPY, QQQ, QLD, and TQQQ all peaked in December 2021. Their paths back to a new high ranged from 24 months to 37 months.
The trough gets most of the attention. Recovery is where leverage keeps charging the investor after the selling stops.
Use the same peak
The BestFolio Drawdown Analyzer separates observed fund history from synthetic extensions. This comparison uses observed prices only. Every fund was live for the full event.
The event begins at the December 2021 peak. SPY reached its trough in September 2022. QQQ, QLD, and TQQQ reached theirs in December 2022. Recovery ends when the fund makes a new monthly high above the old peak.
| Fund | Peak | Trough | Drawdown | New high | Months underwater |
|---|---|---|---|---|---|
| SPY | Dec 2021 | Sep 2022 | -23.93% | Dec 2023 | 24 |
| QQQ | Dec 2021 | Dec 2022 | -32.58% | Dec 2023 | 24 |
| QLD | Dec 2021 | Dec 2022 | -60.52% | May 2024 | 29 |
| TQQQ | Dec 2021 | Dec 2022 | -79.08% | Jan 2025 | 37 |
Depth changes the recovery math
A percentage loss and the required rebound are asymmetric because the rebound compounds from a smaller base. A leveraged fund can therefore join the rebound, post a strong annual return, and remain underwater.
That is exactly what the dates show. QLD and TQQQ bottomed in the same month as QQQ. QQQ recovered by December 2023. QLD needed 5 more months. TQQQ needed 13 more months than QQQ.
The distance between the trough and the old high created the delay.
SPY and QQQ needed the same 24 months
SPY lost -23.93%, while QQQ lost -32.58%. Both completed the peak-to-recovery trip in 24 months. QQQ fell further but also rebounded quickly enough to close the timing gap.
This is a useful reminder that drawdown depth does not determine recovery time by itself. The return path after the trough matters. A shallower portfolio can recover later if its rebound is slow, and a deeper one can recover earlier if the rebound is sharp.
Daily leverage adds path dependence
QLD targets 2x daily Nasdaq exposure and TQQQ targets 3x. Daily reset means the multi-month result depends on the order of returns. Volatile down-and-up paths can leave the leveraged fund behind a simple multiple of QQQ even after the index has recovered.
The observed event makes that cost visible without relying on a pre-inception simulation. QLD's drawdown reached -60.52% and lasted 29 months underwater. TQQQ reached -79.08% and lasted 37 months. QQQ was back at a new high after 24 months.
What a risk card should show
Maximum drawdown answers how far the portfolio fell from its prior peak. Months underwater answers how long the old peak remained unrecovered. Both belong beside leveraged results.
I would also keep the observation rule visible. These figures use month-end closes from observed fund history. A daily-close series can find a deeper intramonth path, while an intraday low can go further again. The recovery definition must use the same frequency as the peak and trough.
The 2021 event gives a clean sizing test. A TQQQ investor had to survive a -79.08% month-end drawdown and keep following the plan for 37 months before the old high returned. CAGR alone cannot describe that job.
Past performance does not guarantee future results. Historical drawdowns do not define the next loss or recovery.