A common defense of long-term leveraged ETFs goes like this: a deep crash hurts a lump sum, while a saver keeps buying cheaper shares every month. Continued contributions should rescue the outcome.
They help. They also leave a surprisingly wide set of losing paths.
We tested every historical start month since 1993, then scrambled the sequence in 12-month blocks. The average return stayed useful, though the order of returns kept deciding who won.
The model
We used SPY total returns for the unlevered route. The leveraged route resets to 2x each day and pays a 0.95% annual product cost plus financing on one borrowed dollar at the effective Federal Funds rate plus 0.50%. The rate series comes from FRED DFF.
This is a synthetic structure rather than a reconstruction of one fund. It gives the cost model a time-varying cash rate and preserves daily compounding, which are the 2 pieces that a simple "2 times annual return" shortcut loses.
For DCA, the investor contributes $1 at the beginning of every month. We compare terminal wealth with the same dollars and dates in SPY. Taxes and trading spread stay outside the test.
Every historical start month
| Horizon | Start months | 2x trails, lump sum | 2x trails, monthly DCA | Worst DCA ratio |
|---|---|---|---|---|
| 10 years | 282 | 40.78% | 41.84% | 0.43x |
| 15 years | 222 | 45.05% | 31.08% | 0.42x |
| 20 years | 162 | 42.59% | 7.41% | 0.83x |
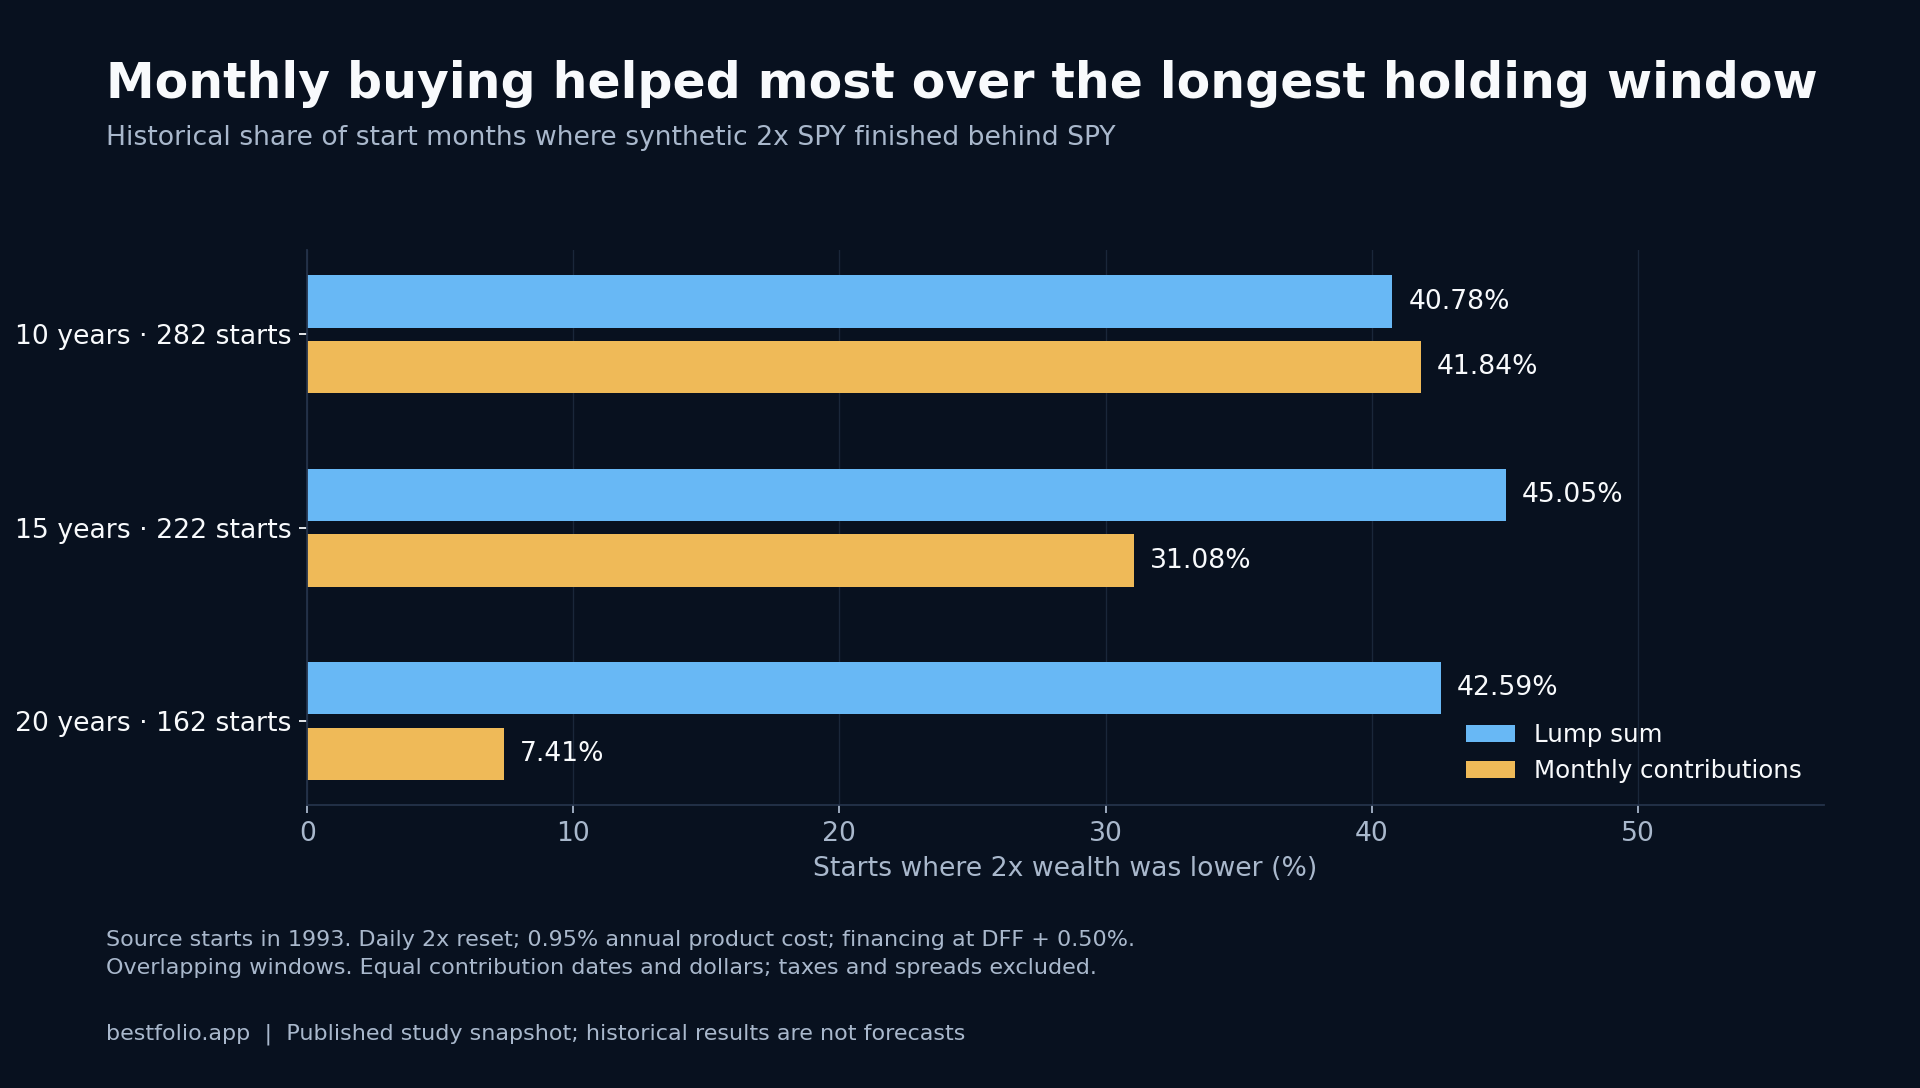
The 20-year DCA result is the strongest case for continued buying. The leveraged route beat SPY in 92.59% of historical starts, and its median terminal wealth was 1.51 times the unlevered result.
The tail remained. Its worst 20-year DCA start finished at 0.83 times SPY. At 15 years, 31.08% of starts trailed, and the worst route ended with 42 cents for every dollar accumulated by the unlevered route.
Lump-sum outcomes behaved differently. Even over 20 years, 42.59% of historical starts lagged SPY. Contributions bought more shares after crashes, so DCA benefited from a recovery that arrived while fresh money was still entering. A lump sum had no new capital to exploit the lower price.
Historical starts still share one history
Rolling windows overlap. A 15-year start in January and another in February share 179 of 180 months. They give a useful view of contribution timing, while their outcomes are far from independent.
We added a block bootstrap for a different test. Each simulated 15-year path draws complete 12-month blocks from the observed monthly record. The blocks preserve some serial structure inside each year, then recombine bull markets, crashes and recoveries in new orders. We ran 5,000 paths with the same contribution schedule.
| 15-year block-resampled result | 2x wealth / SPY wealth |
|---|---|
| 5th percentile | 0.63x |
| Median | 1.42x |
| 95th percentile | 3.09x |
| Share where 2x trails | 24.74% |
The median is attractive. The spread around it is enormous. Identical monthly savings produced a 5th-percentile route that ended 37% behind SPY and a 95th-percentile route worth more than 3 times SPY.
What DCA can and cannot repair
DCA is most helpful when the bad period arrives early and a sustained recovery follows while contributions continue. A late crash has fewer remaining deposits to buy the damage. Sideways volatility creates another problem: daily reset keeps compounding the back-and-forth while the saver adds capital into the same drag.
The bootstrap has limits. It can only reuse regimes present since 1993, and 12-month blocks break relationships that last longer than a year. The synthetic fund also assumes financing at DFF plus 0.50% throughout. A real fund can track better or worse.
The result still answers the narrow claim. Monthly buying improved the long-horizon odds, especially at 20 years. It never turned 2x equity into a sequence-proof savings plan.
A rule such as Golden Ratio Dual Gate takes a different route by cutting the leveraged sleeve when either of its trend gates loses support. That trades some upside for a different path through large drawdowns.
Related: The Hunt for a 2x VT.