Every backtest on BestFolio pays for its trades. Each time a strategy changes what it holds, the engine takes a trading cost out of that day's return, with one rule for every fund, every strategy and every year. Is that rule realistic? The question comes up regularly in replies to my posts, so here is exactly how it works, why I built it that way, and what the same trades cost a real account of $10,000, $100,000 or $1,000,000.
At the median, my backtests charge 0.25% a year. At today's spreads and commissions, the same trades cost about 0.17% a year on a $10,000 account, 0.06% on $100,000 and 0.06% to 0.12% on $1,000,000. For 182 of the 201 strategy variants, the backtest charges more than a $100,000 account pays, and that margin is on purpose. Leverage matters much less than volume: TQQQ, a 3x fund, costs 2 to 4 basis points a side at every size I tested, while a thin 3x fund like TYD can cost up to 0.74% a side on a $1,000,000 order.
How my backtests charge for a trade
When a signal changes the portfolio, the engine compares what the account holds at that moment, after each holding has drifted with its own price, with the new target. The share of the portfolio that changes hands is the turnover. Moving everything from one fund to another counts as 1: you sell the whole portfolio once and buy it once. The engine charges 0.10% for each unit of turnover, which is 5 basis points (0.05%) on each side of the trade.
Then there's a volatility multiplier. If the portfolio's own daily returns over the previous 20 trading days have swung by more than 1% a day, about 16% a year, the cost is multiplied by that ratio, up to 3 times. So a full switch costs between 0.10% and 0.30% of the portfolio, or 5 to 15 basis points a side. That's the whole model, and it's the same for SPY as for a thin 3x fund.
Why I built it this way
- One yardstick. Every strategy on the site pays by the same rule. When I compare 2 strategies, the gap comes from their signals and how much they trade, not from different cost assumptions.
- Heavy on purpose. 5 basis points a side is more than a liquid ETF costs most accounts today, as the numbers below show. A backtest that charges a little too much is safer than one that charges too little.
- Stress costs more. Spreads widen when markets are under stress, and tactical strategies tend to trade in exactly those weeks. The multiplier charges more when the portfolio has been volatile, which is when a real fill is most likely to be worse.
To see how this compares with a real account, I priced every trade the strategies actually made at what the actual funds cost to trade today.
What a real trade costs
3 things, and which one matters depends on the size of the order.
- The spread. You buy at the ask and sell at the bid, so each side costs half the gap. SEC Rule 6c-11 (2019) requires every US ETF to publish its median bid/ask spread over the last 30 days. I collected it for 40 funds my strategies trade, as of 9 to 12 October 2026, and found it for 31.
- The commission. I used IBKR's fixed rate: $0.005 a share, with a $1 minimum per order. The minimum is what small accounts feel: $1 on a $500 order is 20 basis points.
- Market impact. A large order in a fund that trades little moves the price. I estimated it with the usual square-root rule: half the fund's daily volatility times the square root of the order's share of a day's dollar volume. For ETFs that's an upper bound, because market makers can create new shares, so a big order isn't limited to what trades on screen.
Some issuers list SPY and QQQ at 0.00% (they round), and ProShares doesn't show the figure on its fund pages. For those I took one cent on the share price, marked with an asterisk.
| Fund | Published spread | Daily volume | $10,000 order | $100,000 order | $1,000,000 order |
|---|---|---|---|---|---|
| SPY* | 0.00% | $32.6bn | 1.1 bp | 0.2 bp | 0.4 bp |
| TLT | 0.01% | $3.0bn | 1.6 bp | 1.3 bp | 1.7 bp |
| TQQQ* | one cent | $3.8bn | 2.0 bp | 2.3 bp | 4.3 bp |
| UPRO* | one cent | $283m | 2.0 bp | 2.9 bp | 7.8 bp |
| TMF | 0.04% | $183m | 4.3 bp | 5.7 bp | 10.0 bp |
| KMLM | 0.06% | $12m | 5.9 bp | 8.6 bp | 17.0 bp |
| RSST | 0.08% | $4m | 8.7 bp | 15.7 bp | 38.0 bp |
| NTSX | 0.22% | $2.6m | 14.6 bp | 20.1 bp | 37.9 bp |
| TYD | 0.24% | $0.5m | 20.3 bp | 33.3 bp | 74.4 bp |
| GDE | 0.41% | $6.7m | 25.5 bp | 33.8 bp | 61.0 bp |
Cost of one side of a trade, spread plus commission plus impact. Daily volume is the 60-day average in dollars.
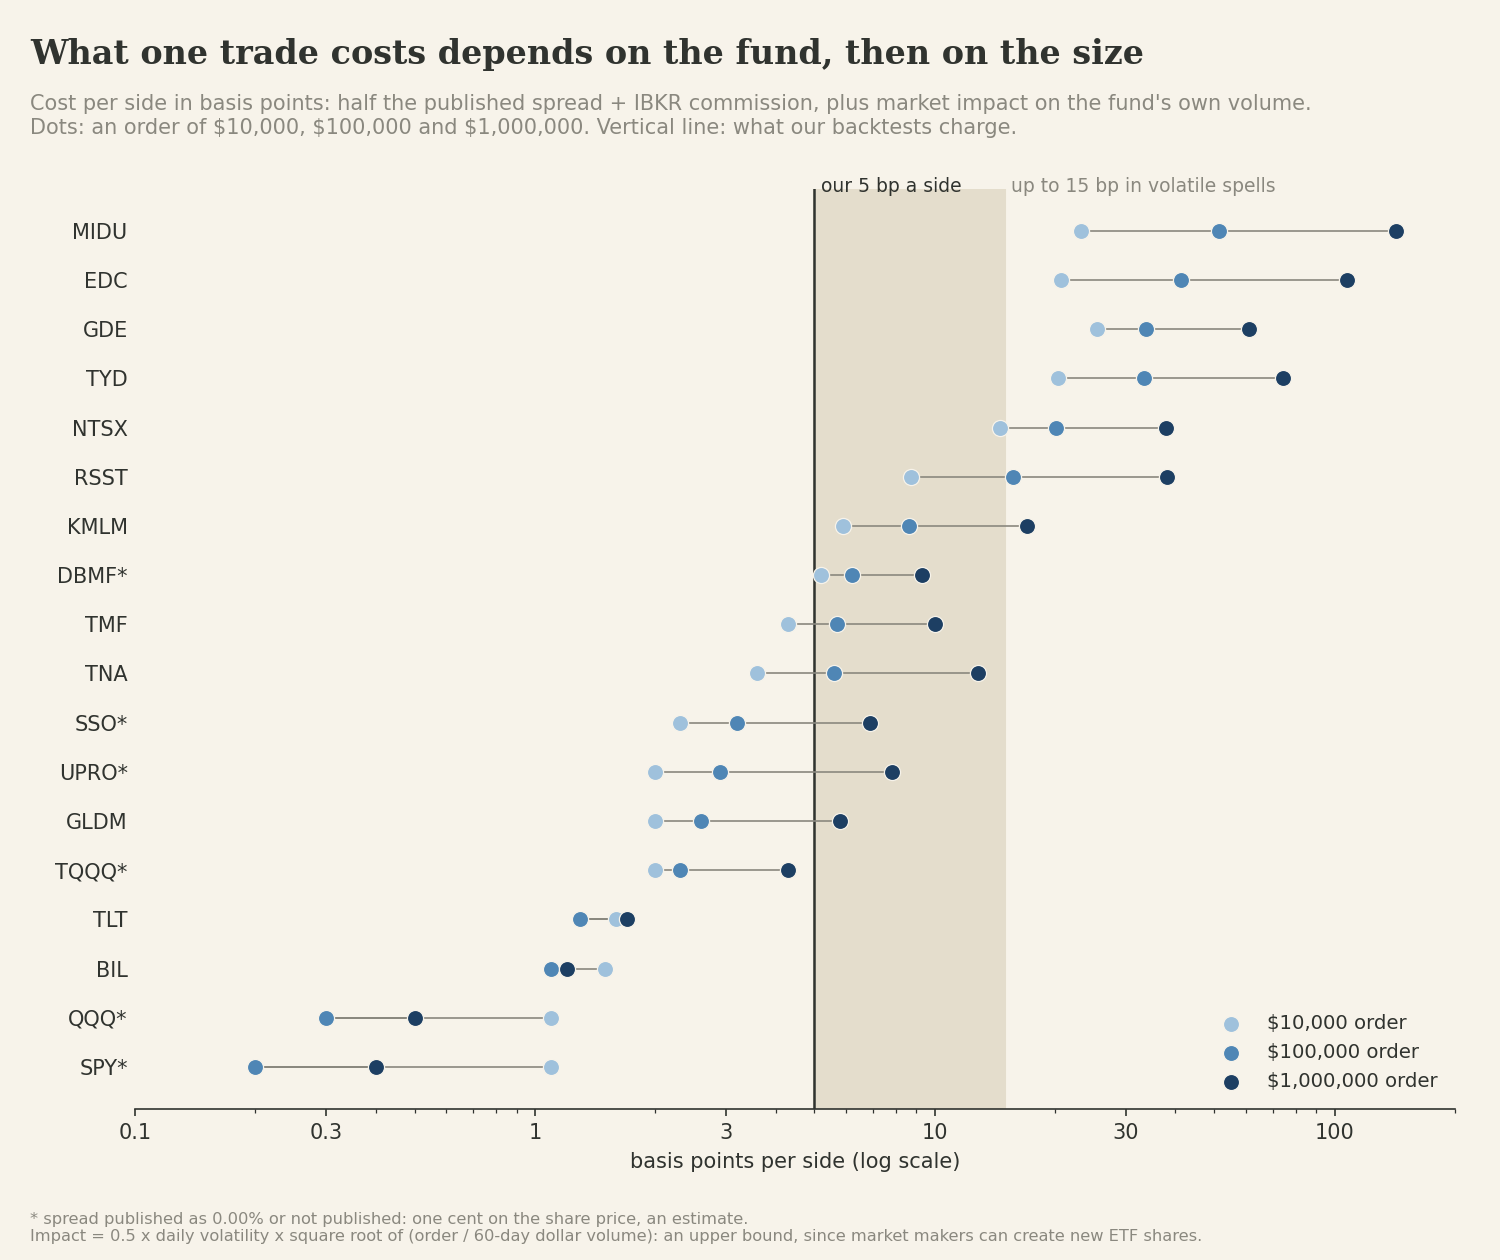
Leverage isn't what makes a fund expensive to trade. Volume is. TQQQ costs 2 to 4 basis points a side at every size I tested, close to TLT. TYD, also 3x, trades about $0.5m a day, and a $1,000,000 order in it can cost up to an estimated 0.74% a side. SPY even costs more on a $10,000 order than on a $100,000 one, because the $1 minimum is a bigger share of a small order.
What it adds up to over a year
I took the 201 released strategy variants on BestFolio, with their full signal histories as of 16 October 2026, and priced every trade at each account size. Static portfolios only trade when they rebalance, so I spread their yearly turnover over one order per holding per rebalance.
| Strategy | Turnover a year | My backtests | $10,000 | $100,000 | $1,000,000 |
|---|---|---|---|---|---|
| Median of 201 variants | 2.1 | 0.25% | 0.17% | 0.06% | 0.06% to 0.12% |
| HAA-Simple | 2.0 | 0.21% | 0.05% | 0.03% | 0.03% to 0.04% |
| HAA Standard | 3.1 | 0.32% | 0.24% | 0.08% | 0.07% to 0.12% |
| Momentum-Correlation Triplet | 4.0 | 0.42% | 0.29% | 0.13% | 0.13% to 0.33% |
| Buy the Dip (TQQQ, daily) | 5.8 | 0.96% | 0.54% | 0.29% | 0.28% to 0.60% |
| RVol Shifter (QLD, TQQQ or cash, daily) | 8.6 | 1.97% | 0.28% | 0.22% | 0.22% to 1.00% |
| HAA Leveraged 2x (thin 2x funds) | 3.1 | 0.39% | 0.61% | 0.47% | 0.47% to 2.39% |
| VAA-G4 SmartStack (thin 3x funds) | 6.0 | 0.63% | 0.78% | 0.63% | 0.63% to 4.91% |
Drag on the yearly return, at today's spreads. The $1,000,000 range runs from spreads and commissions alone to spreads, commissions and the upper-bound market impact.
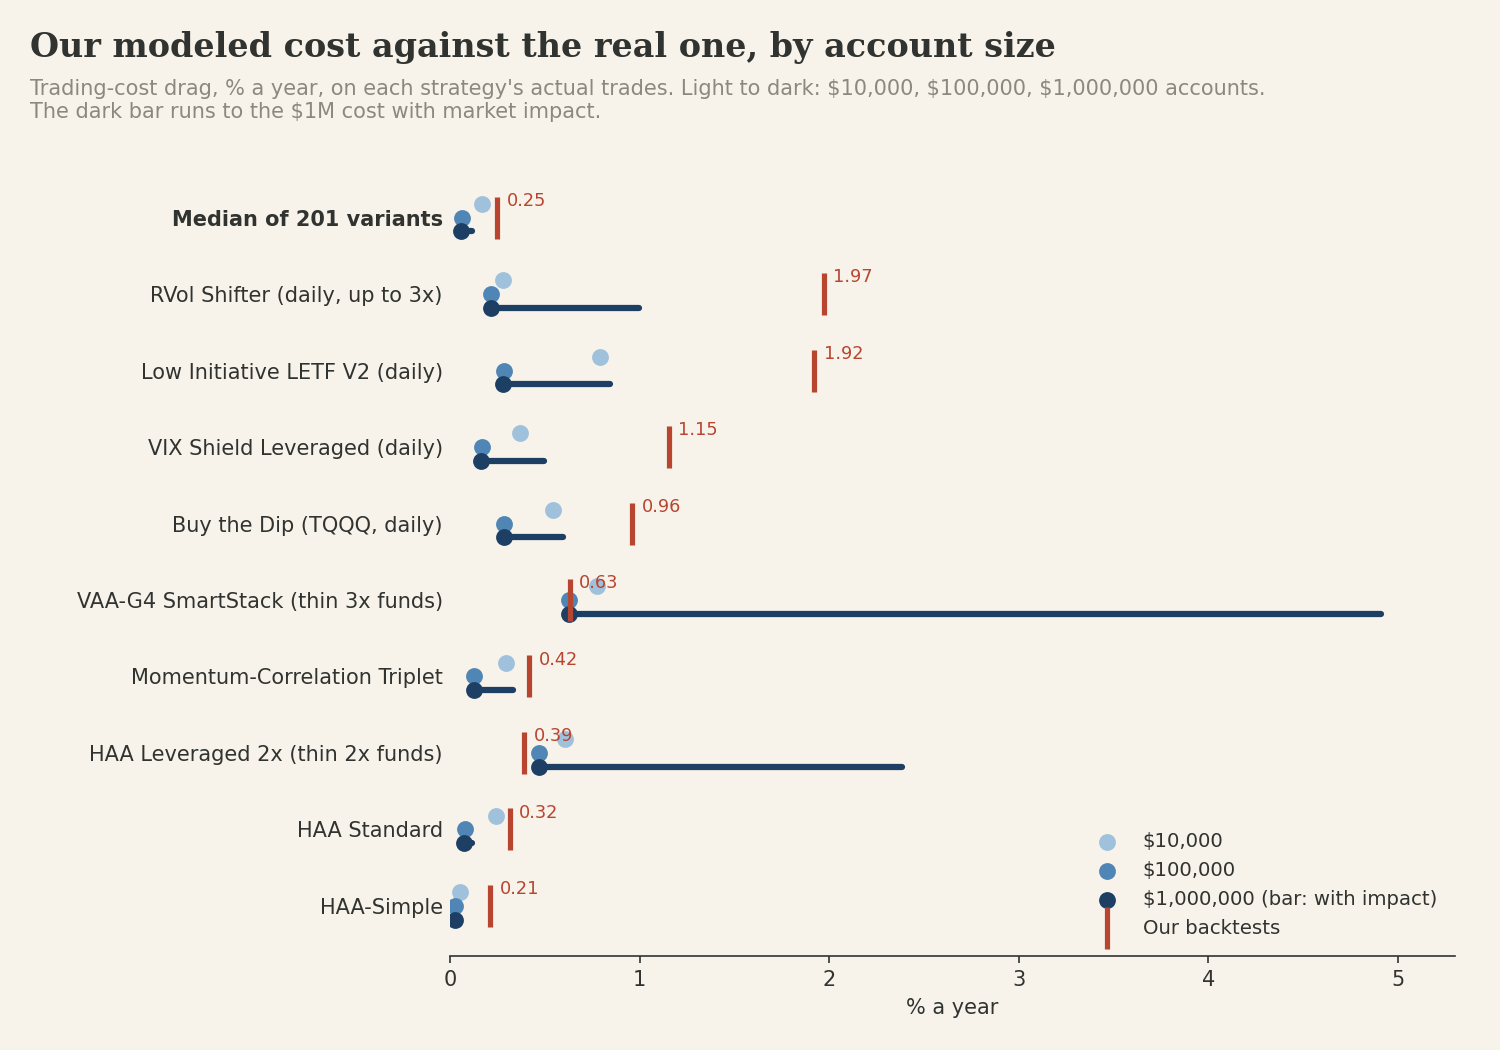
My backtests charge more than today's real cost for 123 of the 201 variants at $10,000, 182 at $100,000 and 196 at $1,000,000 before impact (166 with it).
3 account sizes
$10,000. The commission does most of the damage. Many orders are small, and each pays at least $1. The median variant loses 0.17% a year, close to the 0.25% my backtests charge. Skipping the smallest rebalancing trades, which change little, is the obvious lever.
$100,000. The sweet spot. Commissions shrink to under a basis point per trade and the spread is most of what's left. The median variant pays about 0.06% a year, a quarter of what my backtests charge.
$1,000,000. Liquid funds still cost almost nothing: a $1,000,000 order in SPY, TLT or TQQQ costs a few basis points. Thin funds are the other story. A strategy that moves a quarter of a $1,000,000 account into TYD, EET or EFO, which each trade under $1m a day, can pay well above my model. Limit orders, working the order through the day, or asking the broker for a quote from a market maker bring that down, but the risk is real.
Where a real account lands further away
I use the model as a yardstick for comparing strategies, not as a quote from your broker, and it lands furthest from a real account in 2 places.
Daily leveraged strategies pay the multiplier almost every time they trade, because a portfolio holding 3x funds is nearly always volatile by this measure. RVol Shifter is charged 1.97% a year for trades that cost 0.22% to 1.00% even at $1,000,000 today, so its backtest is on the cautious side.
Strategies on thin funds go the other way once the account is large. HAA Leveraged 2x is charged 0.39% a year, and its trades cost more than that at every size. The SmartStack variants cost a $1,000,000 account more than they're charged once impact is counted. If you run one of those with a big account, I'd use the tables above to see roughly how much to add.
Every number on the site uses this one model, with the same rate for every fund. I think that's right: the same rule for every strategy, set on the heavy side for the liquid funds most of them trade.
What this check leaves out
- Every trade is priced at today's spreads, including the early years: 185 of the 201 variants start before the first US ETF in 1993, and for those years the backtest trades a proxy (an index, a mutual fund or a synthetic series) in the fund's place, at the same rate.
- Spreads widen in crashes, and tactical strategies trade most in crashes. That's what the volatility multiplier is for. The real-account figures above use today's spreads with no such widening.
- Timing. The backtest trades at the closing price of the signal day. A real follower fills a little later, at a different price, and that gap is probably larger than every cost above.
- Taxes aren't in any of these figures.
If you want to check a fund yourself, the spread is on its issuer page, usually as the "30-day median bid/ask spread".