A trend band is supposed to reduce whipsaw. A permanently wide band often buys that calm by waiting longer to exit, which can deepen the loss it was meant to control.
BestFolio's TQQQ whipsaw study found a better shape: give the trend room when realized volatility is quiet, then narrow the band as volatility rises. Over the real TQQQ period from February 2010 through September 2026, the volatility-scaled rule returned 32.4% annualized with a -54.8% maximum drawdown. A plain 200-day gate returned 32.6% with a -55.6% drawdown. The two returns are effectively the same. What the buffer changed was how often the strategy switched.
The published strategy behind the test
The live TQQQ/QQQ 200MA Band card credits XXXMrHOLLYWOOD (r/TQQQ). Its standard rule reads SPY against a 200-day moving average. It enters 100% TQQQ when SPY closes 4% above the average, exits to 100% QQQ when SPY closes 3% below, and holds the current state between those lines.
The standard card covers October 1985 through August 2026. It reports 27.8% CAGR, a 0.72 Sharpe ratio, and a -95.8% maximum drawdown. Most of that history predates TQQQ, so the deep section uses a synthetic 3x Nasdaq series. The card's drawdown is already a warning against reading the band as a safety guarantee.
| Published standard rule | Setting |
|---|---|
| Signal | SPY versus its 200-day moving average |
| Enter aggressive state | SPY above +4% |
| Exit aggressive state | SPY below -3% |
| Between bands | Hold the prior state |
| Aggressive holding | 100% TQQQ |
| Defensive holding | 100% QQQ |
The study variant isolates the gate more tightly. It reads QQQ, holds TQQQ when risk is on, and moves to BIL when risk is off. That is a different variant on the same live card. Comparing it with a plain QQQ 200-day gate keeps the holding choice fixed and changes only the buffer.
Let volatility set the distance
The rule measures 20-day realized volatility and ranks it against the previous 756 trading days, about 3 years. The symmetric buffer is:
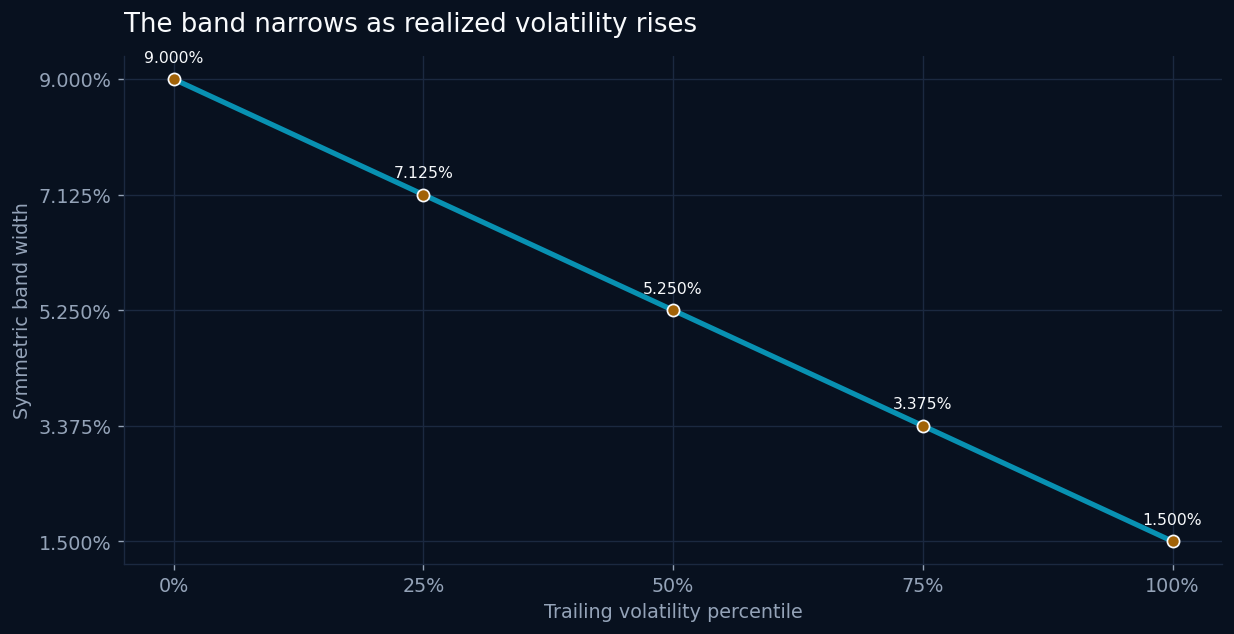
buffer = clip(0.09 - 0.075 × volatility percentile, 0.005, 0.20)
At the bottom of its recent volatility range, the band is 9.000% wide on each side. At the top, it contracts to 1.500%. The formula gives a quiet trend room to move while demanding a faster exit once volatility is already elevated.
| Volatility percentile | Symmetric band width |
|---|---|
| 0% | 9.000% |
| 25% | 7.125% |
| 50% | 5.250% |
| 75% | 3.375% |
| 100% | 1.500% |
What changed in the real-fund window
| QQQ 200-day gate, 2010 to 2026 | CAGR | Max DD | Round trips |
|---|---|---|---|
| Plain gate | 32.6% | -55.6% | 102 switches |
| Volatility-scaled buffer | 32.4% | -54.8% | 24 switches, about 1 quarter of baseline |
The return did not rise. It came in 0.2 percentage points behind the plain gate, which is noise at this scale. The maximum drawdown improved by 0.8 points, and the switch count fell by 76%, from 102 to 24. That is the finding worth keeping: this buffer bought a large reduction in churn without paying for it through a deeper drawdown or a lower return. It did not buy extra return.
The absolute risk stays high. A -54.8% loss requires a 121.3% gain to recover. The buffer changes when the strategy switches. It cannot change the fact that the aggressive state holds a daily-reset 3x Nasdaq fund.
Where the curve can fail
A volatility percentile reacts after volatility has risen. A very fast gap can cross a narrow or wide band before the next usable close. A slow decline can remain calm long enough for the wide setting to give back more ground. And the 3-year ranking window can describe a newly changed market poorly.
The formula is still easier to audit than a collection of exceptions. Every day has a volatility reading, a percentile, a band, and a state. I would use the variant to reduce churn, then size the sleeve from the -54.8% observed-window drawdown rather than from its 32.4% CAGR.
Past performance does not guarantee future results. Backtested results are hypothetical and do not represent actual trading.