The Stacked Trend Allocator is an idea from the r/LETFs community: 3 trend gates that switch between funds holding more than 100% exposure. On a 54-year backtest it looks strong. It's not in our catalog, and here's why.
Its whole lead over the S&P 500 came from 3 stretches, it has trailed the index since 2010, and its worst fall came from gold. I couldn't see why anyone should hold it, so it's in the rejection log, with the numbers below.
What it did
It ran 3 trend gates, each on a fund against its 200-day average: SPY (the SPDR S&P 500 ETF) for stocks, GLD for gold and IEF (the iShares 7-10 Year Treasury Bond ETF) for intermediate Treasuries. A gate turned on when its fund closed more than 3% above the average and off when it closed more than 3% below. At each month-end it held the sleeves whose gate was on, through funds that hold more than 100% exposure: NTSX (the WisdomTree U.S. Efficient Core Fund) for stocks and Treasuries, GDE for stocks and gold, and in the version from the original post, ESBG for all 3.
On the strategy card it looked strong. From January 1973 the default version (Established Funds) returned 13.8% a year with a Sharpe ratio of 0.64 above cash and a worst fall of -45.7%. The S&P 500 returned 11.0% with a Sharpe ratio of 0.48 and a worst fall of -55.2%.
Where the lead came from
The card averages 54 years into one line. To see when the strategy earned its edge, I divided its growth by the S&P 500's. When my line rises it's pulling ahead, and when it falls it's losing ground.
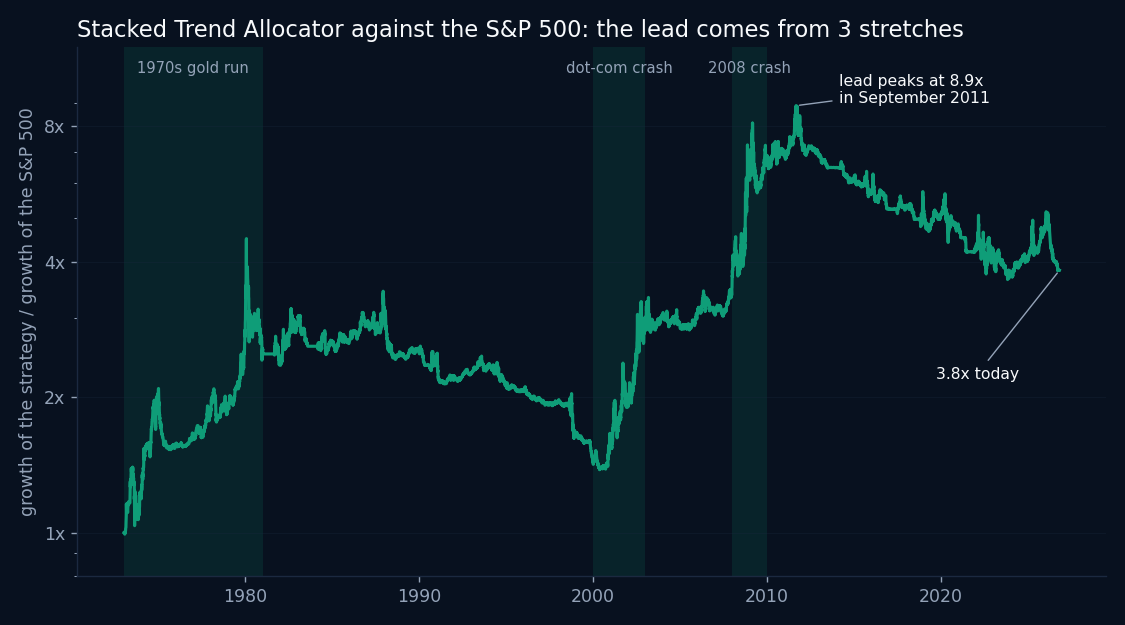
3 stretches did all the work. From 1973 to 1980, while gold ran, it grew 2.5 times as much as the S&P 500. In the dot-com crash, 2000 to 2002, it grew 2.1 times as much, and in 2008 and 2009 1.9 times as much.
Outside them it mostly lost ground. From 1981 to 1999 it returned 13.7% a year against 17.1% for the S&P 500. Its lead peaked in September 2011, at 8.9 times the index's growth since 1973, and it has been shrinking since: it's 3.8 times now.
| Return a year, net of costs | Stacked Trend Allocator | S&P 500 |
|---|---|---|
| 1973 to 1980 | 19.3% | 6.4% |
| 1981 to 1999 | 13.7% | 17.1% |
| 2000 to 2009 | 15.4% | -1.0% |
| 2010 to 2019 | 10.5% | 13.6% |
| 2020 to 4 November 2026 | 10.7% | 15.2% |
| 1973 to 4 November 2026 | 13.8% | 11.0% |
The original r/LETFs post tested from 2001, which starts inside the second good stretch. From 2001 our default version returned 12.8% a year against 9.1% for the S&P 500, which is why it looked so good there.
It has trailed for 16 years
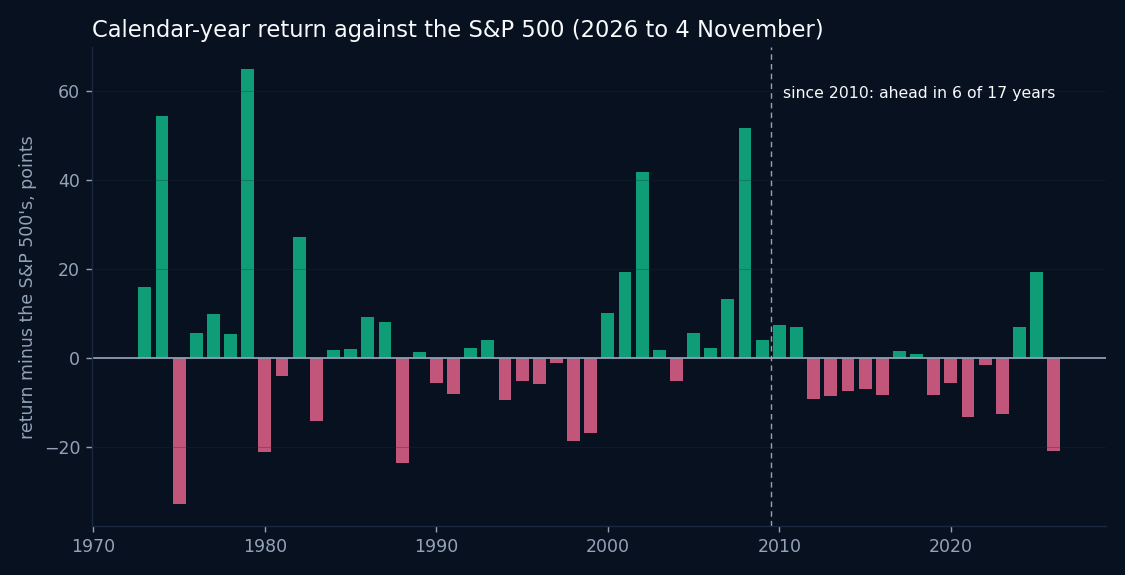
Since 2010 it beat the S&P 500 in 6 of 17 calendar years. It returned 10.5% a year from 2010 to 2019 against 13.6%, and 10.7% since 2020 against 15.2%. Holding ESBG's mix all the time, without the gates, did better in both periods: 13.1% and 16.6% a year. In 2026 it's at -7.4% to 4 November, while the S&P 500 is up 13.4%.
Trailing in bull markets is the price of any trend filter, and it can be worth paying. It pays back when a long bear market comes. Our backtest has 3 of those, and they carry the whole result. If the next 10 years look like the last 16, I think you'd be paying the price without the payback.
Its worst fall came from gold
The -45.7% came from January to March 1980, when gold fell from its January 1980 peak. With stocks and gold both trending, the strategy held GDE, which carries about 90% in each. Take the gold gate out (the No Gold version) and the worst fall over the full history is -33.1%, in the October 1987 crash.
Since 2001 gold added return, 12.8% a year against 10.2% without it. It didn't add much on risk: since 2001 the Sharpe ratio was 0.87 with gold and 0.88 without. A 2001 start also lines up with the start of a long rise in gold, which flatters the posted results.
The funds are too new
The version in the original post leans on 2 funds that barely trade. ESBG was listed in November 2025 and GDT in January 2026. Over the 60 sessions to 2 October, ESBG traded a median of about $3,000 a day and GDT about $47,000. ESBG also holds only about 70% of each sleeve, and costs 0.95% a year. The default version avoided both, but GDE only exists since March 2022, so before that the backtest uses a stand-in built like the fund. For 49 of the 54 years, we're testing a model of the fund.
Why it doesn't make the cut
In September, after turning down another candidate, I raised the bar for new strategies. Now a strategy has to give you something the index can't, in a form you'd actually hold. The Stacked Trend Allocator fails that test: its edge is 3 bear markets and gold, and holding it meant trailing the index for 16 years.
What happens to it
- Its rejection log entry has the full numbers for all 3 versions.
- We keep our backtests of it. It still counts as one of the strategies we tried when we correct Sharpe ratios for how many we've tested.
Thanks to the r/LETFs community for the idea. It was worth testing, and testing it properly is how it ended up here.
How we tested it
- BestFolio's production engine on daily data, from January 1973 for Established Funds and No Gold and from February 1974 for the posted version, to 4 November 2026. 10 bps on every trade, plus the funds' fees and the financing cost of exposure above 100%.
- Gold before 1999 is the daily Frankfurt fixing. GDE before March 2022, NTSX before its launch, and ESBG and GDT before theirs use stand-ins built like the funds.
- The S&P 500 is our benchmark series on the same dates. Sharpe ratios are measured above cash.
- "Grew 2.5 times as much" compares the strategy's growth over a stretch with the S&P 500's over the same stretch.
Backtests are hypothetical and include no taxes. Past returns do not predict future ones.